Bathymetry of Cannikin Lake, Amchitka Island, Alaska, with
Bathymetry of Cannikin Lake, Amchitka Island, Alaska, with
Bathymetry of Cannikin Lake, Amchitka Island, Alaska, with

Create successful ePaper yourself
Turn your PDF publications into a flip-book with our unique Google optimized e-Paper software.
.><br />
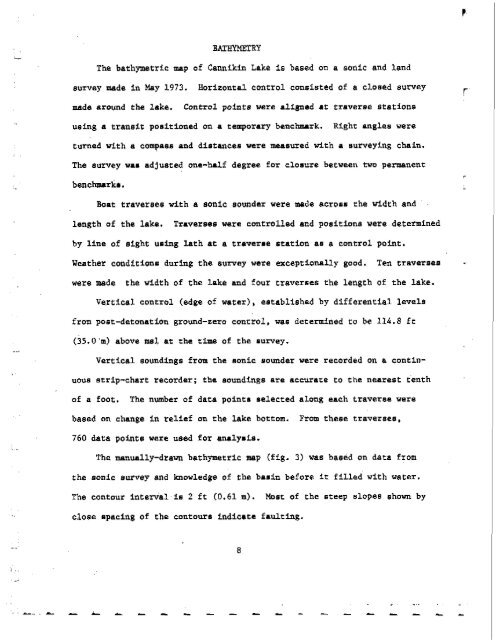
BATHYMETRY<br />
The bathymetric map <strong>of</strong> <strong>Cannikin</strong> <strong>Lake</strong> is based on a sonic and land<br />
survey made in May 1973. Horizontal control consisted <strong>of</strong> a closed survey<br />
made around the lake. Control points were aligned at traverse statfons<br />
using a transit positioned on a temporary benchmark. Right angle8 were<br />
turned <strong>with</strong> a compass and distances were measured <strong>with</strong> a surveying chain.<br />
The survey wan adjusted one-half degree for closure between two permanent<br />
benchmark*.<br />
Boat traverses <strong>with</strong> a sonic sounder were made acronr the width and<br />
length <strong>of</strong> the lake. Traverses were controlled and positions were determined<br />
by line <strong>of</strong> sight uning Lath at a traverme station as a control point.<br />
Weather conditiunm during the survey were exceptionally good. Ten traverses<br />
were made the width <strong>of</strong> the lake and four traverses the length <strong>of</strong> the lake.<br />
Vertical control (edge <strong>of</strong> water), established by differential levels<br />
from poet-detonation ground-zero conrrol, was determined to be 114.8 ft<br />
(35.0'm) above ml at the time <strong>of</strong> the Purvey.<br />
Vertical eoundings from the eonic sounder were recorded on a contin-<br />
uoua strip-chart recorder; the eoundings are accurate to the nearest tenth<br />
<strong>of</strong> a foot. The number <strong>of</strong> data pointa selected along each traverae were<br />
based on change in relief on the lake bottom. From these traverses,<br />
760 data points were used for anrlymis.<br />
The m~nually-drawn bethymetric map (fig. 3) was based on data from<br />
the sonic survey and knowledge <strong>of</strong> the bamin before it filled <strong>with</strong> water.<br />
The contour intervilis 2 ft (0.611~). Most <strong>of</strong> the steep slopes shown by<br />
close mpacing <strong>of</strong> the contourm indicate faulting.<br />
r