- Page 1 and 2: Fayette County, Pennsylvania Housin
- Page 3 and 4: Fayette County Housing Market Analy
- Page 5 and 6: Fayette County Housing Market Analy
- Page 7 and 8: Fayette County Housing Market Analy
- Page 9 and 10: Index of Figures Fayette County Hou
- Page 11 and 12: Fayette County Housing Market Analy
- Page 13 and 14: Fayette County Housing Market Analy
- Page 15 and 16: Fayette County Housing Market Analy
- Page 17 and 18: Figure 1-3 Fayette County Populatio
- Page 19: Fayette County Housing Market Analy
- Page 23 and 24: Fayette County Housing Market Analy
- Page 25 and 26: Fayette County Housing Market Analy
- Page 27 and 28: Figure 1-6 Fayette County Patch Com
- Page 29 and 30: 2. ACKNOWLEDGEMENTS Fayette County
- Page 31 and 32: Fayette County Housing Market Analy
- Page 33 and 34: Fayette County Housing Market Analy
- Page 35 and 36: Fayette County Housing Market Analy
- Page 37 and 38: Table 4-7 Fayette County Inflow and
- Page 39 and 40: Fayette County Housing Market Analy
- Page 41 and 42: Fayette County Housing Market Analy
- Page 43 and 44: 50.0% 45.0% 40.0% 35.0% 30.0% 25.0%
- Page 45 and 46: 50.0% 45.0% 40.0% 35.0% 30.0% 25.0%
- Page 47 and 48: Table 4-22 Fayette County Populatio
- Page 49 and 50: Fayette County Housing Market Analy
- Page 51 and 52: Fayette County Housing Market Analy
- Page 53 and 54: 11.0% 10.0% 9.0% 8.0% 7.0% 6.0% 5.0
- Page 55 and 56: Fayette County Housing Market Analy
- Page 57 and 58: Fayette County Housing Market Analy
- Page 59 and 60: Fayette County Housing Market Analy
- Page 61 and 62: Fayette County Housing Market Analy
- Page 63 and 64: Fayette County Housing Market Analy
- Page 65 and 66: Fayette County Housing Market Analy
- Page 67 and 68: Fayette County Housing Market Analy
- Page 69 and 70: Fayette County Housing Market Analy
- Page 71 and 72:
Table 5-6 Fayette County Units per
- Page 73 and 74:
v. Homeowner Housing Fayette County
- Page 75 and 76:
Table 5-9 Fayette County Owner Hous
- Page 77 and 78:
Fayette County Housing Market Analy
- Page 79 and 80:
Fayette County Housing Market Analy
- Page 81 and 82:
vii. Homeowner Housing by Indicator
- Page 83 and 84:
Fayette County Housing Market Analy
- Page 85 and 86:
Fayette County Housing Market Analy
- Page 87 and 88:
Table 5-17 Fayette County Cost Burd
- Page 89 and 90:
Table 5-19 Fayette County Cost Burd
- Page 91 and 92:
Table 5-20 Fayette County Renter Ho
- Page 93 and 94:
Fayette County Housing Market Analy
- Page 95 and 96:
Fayette County Housing Market Analy
- Page 97 and 98:
Fayette County Housing Market Analy
- Page 99 and 100:
Fayette County Housing Market Analy
- Page 101 and 102:
Fayette County Housing Market Analy
- Page 103 and 104:
Table 5-29 Fayette County Cost Burd
- Page 105 and 106:
Table 5-31 Fayette County Cost Burd
- Page 107 and 108:
Fayette County Housing Market Analy
- Page 109 and 110:
Fayette County Housing Market Analy
- Page 111 and 112:
Fayette County Housing Market Analy
- Page 113 and 114:
Table 5-35 Housing Unit Condition -
- Page 115 and 116:
Fayette County Housing Market Analy
- Page 117 and 118:
B. Real Estate Market Conditions i.
- Page 119 and 120:
Table 5-36 Fayette County Value of
- Page 121 and 122:
Table 5-38 Fayette County Change in
- Page 123 and 124:
Table 5-39 Fayette County Gross Ren
- Page 125 and 126:
Fayette County Housing Market Analy
- Page 127 and 128:
Fayette County Housing Market Analy
- Page 129 and 130:
sold average sales price average ma
- Page 131 and 132:
Table 5-44 Fayette County Vacant fo
- Page 133 and 134:
Fayette County Housing Market Analy
- Page 135 and 136:
Fayette County Housing Market Analy
- Page 137 and 138:
Fayette County Housing Market Analy
- Page 139 and 140:
Fayette County Housing Market Analy
- Page 141 and 142:
Fayette County Housing Market Analy
- Page 143 and 144:
Fayette County Housing Market Analy
- Page 145 and 146:
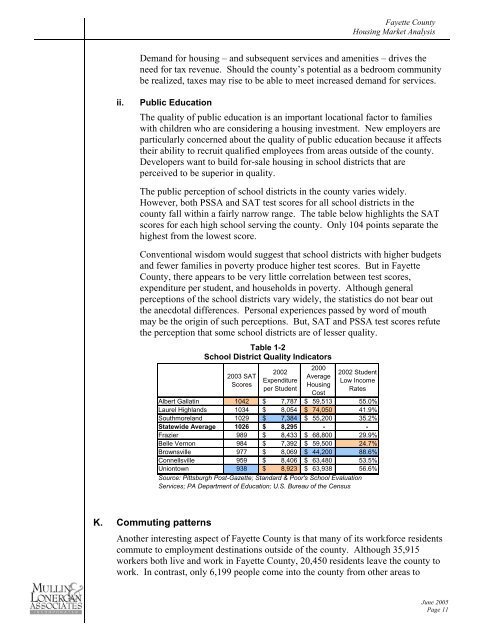
iv. Quality of Schools Fayette Coun
- Page 147 and 148:
Fayette County Housing Market Analy
- Page 149 and 150:
Table 5-51 Fayette County 2004 High
- Page 151 and 152:
District 1 District 2 District 3 Di
- Page 153 and 154:
Table 6-2 Fayette County Projected
- Page 155 and 156:
Fayette County Housing Market Analy
- Page 157 and 158:
Fayette County Housing Market Analy
- Page 159 and 160:
Fayette County Housing Market Analy
- Page 161 and 162:
Fayette County Housing Market Analy
- Page 163 and 164:
Fayette County Housing Market Analy
- Page 165 and 166:
Fayette County Housing Market Analy
- Page 167 and 168:
Fayette County Housing Market Analy
- Page 169 and 170:
Fayette County Housing Market Analy
- Page 171 and 172:
Countywide Connellsville City Conne
- Page 173 and 174:
Fayette County Housing Market Analy
- Page 175 and 176:
7. ASSESSMENT OF AFFORDABLE HOUSING
- Page 177 and 178:
Fayette County Housing Market Analy
- Page 179 and 180:
Fayette County Housing Market Analy
- Page 181 and 182:
Fayette County Housing Market Analy
- Page 183 and 184:
Fayette County Housing Market Analy
- Page 185 and 186:
Development Name Bierer Wood Acres
- Page 187 and 188:
Fayette County Housing Market Analy
- Page 189 and 190:
ii. Available Resources Fayette Cou
- Page 191 and 192:
Fayette County Housing Market Analy
- Page 193 and 194:
• Section 523 Self-Help Housing S
- Page 195 and 196:
Fayette County Housing Market Analy
- Page 197 and 198:
Fayette County Housing Market Analy
- Page 199 and 200:
9. BARRIERS TO NEW HOUSING DEVELOPM
- Page 201 and 202:
Fayette County Housing Market Analy
- Page 203 and 204:
Fayette County Housing Market Analy
- Page 205 and 206:
Fayette County Housing Market Analy
- Page 207 and 208:
Table 11-1 Homeownership Housing Ne
- Page 209 and 210:
Fayette County Housing Market Analy
- Page 211 and 212:
Fayette County Housing Market Analy
- Page 213 and 214:
Fayette County Housing Market Analy
- Page 215 and 216:
Fayette County Housing Market Analy
- Page 217 and 218:
Fayette County Housing Market Analy
- Page 219 and 220:
Fayette County Housing Market Analy
- Page 221 and 222:
Fayette County Housing Market Analy
- Page 223 and 224:
Fayette County Housing Market Analy
- Page 225 and 226:
Fayette County Housing Market Analy
- Page 227 and 228:
Fayette County Housing Market Analy
- Page 229 and 230:
Fayette County Housing Market Analy
- Page 231 and 232:
Table 11-14 Priority Ranking of Pro
- Page 233 and 234:
District 1 District 2 District 3 Di
- Page 235 and 236:
THE CLARITAS DEMOGRAPHIC UPDATE MET
- Page 237 and 238:
In fact, the Claritas Demographic E
- Page 239 and 240:
CONTENT. The Claritas Demographic U
- Page 241 and 242:
Base Counts At the national, state,
- Page 243 and 244:
THE CLARITAS 2002 TRANSITIONAL METH
- Page 245 and 246:
hand. This review also incorporates
- Page 247 and 248:
Census Data for ZIP Codes: Contrary
- Page 249 and 250:
DEMOGRAPHIC CHARACTERISTICS Age, Se
- Page 251 and 252:
the data to the 2000 race definitio
- Page 253 and 254:
special tabulation, while maintaini
- Page 255 and 256:
Census Transition Note: As noted, t
- Page 257 and 258:
distribution of family households.
- Page 259 and 260:
Households by Size Working at the b
- Page 261 and 262:
Seasonal Potential Census Transitio
- Page 263 and 264:
Hispanic households by household in
- Page 265 and 266:
Iterative Proportional Fitting Iter
- Page 267:
C. Appendix 3: Block Group Level Pr
- Page 280 and 281:
Fayette County Housing Market Analy
- Page 282 and 283:
MARKET ASSESSMENT FOR ASSISTED LIVI
- Page 284:
PLANNING AREAS FOR ASSISTED LIVING
- Page 287 and 288:
DEFINITIONS Assisted Living Through
- Page 289 and 290:
There are 24 assisted living facili
- Page 291 and 292:
The results of the bed need analysi
- Page 293 and 294:
Fayette County analysis to reflect
- Page 295 and 296:
• The bed need analysis indicates
- Page 297 and 298:
FAYETTE COUNTY HOUSE AND SERVICE NE
- Page 299 and 300:
Area 1 FAYETTE COUNTY, PENNSYLVANIA
- Page 301 and 302:
Area 3 Brownsville Personal Care Ho
- Page 303 and 304:
Marquis House 660 Cherry Tree Lane
- Page 305 and 306:
Facility Area Licensed/ Operating N
- Page 307 and 308:
Amber House at Harmon House 601 S C
- Page 309 and 310:
AREA 2 - ASSISTED LIVING FACILITIES
- Page 311 and 312:
AREA 4 - ASSISTED LIVING FACILITIES
- Page 323 and 324:
FAYETTE COUNTY Facility No. of Lice
- Page 325 and 326:
MAP OF SKILLED NURSING FACILITIES E
- Page 327 and 328:
FACILITY NO. of BEDS Exhibit 22 FAY
- Page 330 and 331:
Fayette County Housing Market Analy
- Page 332 and 333:
Tax Rates Hypothetical $100,000 pro
- Page 334 and 335:
Levies Hypothetical $100,000 proper
- Page 336 and 337:
Mills Hypothetical $100,000 propert
- Page 338 and 339:
Union 0.0175 0.009 0.088 0.1145 0.1
- Page 340 and 341:
West Leechburg 16.99 19.0000 83.570
- Page 342 and 343:
County Municipality Development Eld
- Page 344 and 345:
Belle Vernon Elderly Units Capture
- Page 346 and 347:
Belle Vernon Elderly Units Capture
- Page 348 and 349:
8059 4 0 0 0 15 0 14 0 14 8 0 0 0 0
- Page 350 and 351:
8059 4 7 7 20 17 10 0 0 0 0 19 0 0
- Page 352 and 353:
8059 4 10 9 0 0 22 0 0 0 8 0 0 0 0
- Page 354 and 355:
8059 4 0 0 0 5 0 4 0 4 2 0 0 0 0 3
- Page 356 and 357:
Brownsville Elderly Units Capture R
- Page 358 and 359:
Brownsville Elderly Units Capture R
- Page 360 and 361:
Brownsville 55-64 Fayette County Wa
- Page 362 and 363:
Brownsville 65-74 Fayette County Wa
- Page 364 and 365:
Municipality Development Elderly Un
- Page 366 and 367:
Fairchance Elderly Units Capture Ra
- Page 368 and 369:
Fairchance Elderly Units Capture Ra
- Page 370 and 371:
Fairchance 65-74 Less than $10,000
- Page 372 and 373:
Fairchance 62-64 Fayette County CT
- Page 374 and 375:
Masontown Elderly Units Capture Rat
- Page 376 and 377:
Masontown Elderly Units Capture Rat
- Page 378 and 379:
Masontown 55-64 Less than $10,000 t
- Page 380 and 381:
Masontown 65-74 Greene County Fayet
- Page 382 and 383:
Municipality Development Elderly Un
- Page 384 and 385:
Smithfield Elderly Units Capture Ra
- Page 386 and 387:
Smithfield 65-74 Fayette County CT
- Page 388 and 389:
Smithfield 62-64 Fayette County CT
- Page 390 and 391:
Stewart Elderly Units Capture Rate
- Page 392 and 393:
Wharton Elderly Units Capture Rate
- Page 394 and 395:
Wharton 55-64 Less than $10,000 to
- Page 396 and 397:
Public and Quasi-Public Entities Pr
- Page 398 and 399:
Fayette County Housing Market Analy
- Page 400 and 401:
Fayette County Housing Market Analy
- Page 402 and 403:
What is the Homebuyer Development P
- Page 420:
K. Appendix 11: Project Sheet for S