Fayette Country, Pennsylvania, Housing Market Analysis - EERE
Fayette Country, Pennsylvania, Housing Market Analysis - EERE
Fayette Country, Pennsylvania, Housing Market Analysis - EERE

Create successful ePaper yourself
Turn your PDF publications into a flip-book with our unique Google optimized e-Paper software.
<strong>Fayette</strong> County<br />
<strong>Housing</strong> <strong>Market</strong> <strong>Analysis</strong><br />
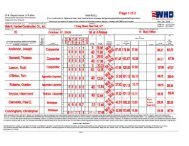
Table 4-23<br />
<strong>Fayette</strong> County Indicators in Comparison to Surrounding Counties and <strong>Pennsylvania</strong><br />
Indicator<br />
<strong>Fayette</strong><br />
County<br />
Greene Somerset Washington Westmoreland<br />
<strong>Pennsylvania</strong><br />
County County County County<br />
Garrett<br />
Demographic Indicators<br />
Total Population<br />
Monongalia Preston<br />
County, MD County, WV County, WV<br />
Total Population - 1990 145,351 39,550 78,218 204,584 370,321 11,881,643 28,138 75,509 29,037<br />
Total Population - 2000 148,644 40,672 80,023 202,897 369,993 12,281,054 29,846 81,866 29,334<br />
% Change 1990 to 2000<br />
2000 Population by Age (%)<br />
2.3% 2.8% 2.3% -0.8% -0.1% 3.4% 6.1% 8.4% 1.0%<br />
Under 15 18.6% 18.0% 18.1% 18.3% 18.0% 19.7% 20.4% 15.1% 18.7%<br />
15 - 24 11.8% 13.7% 11.8% 11.6% 10.8% 13.0% 12.5% 26.5% 12.9%<br />
25 - 34 12.2% 13.8% 12.4% 11.4% 11.4% 12.7% 12.1% 14.3% 12.3%<br />
35 - 44 15.0% 15.2% 15.4% 15.7% 16.1% 15.9% 15.5% 13.4% 15.4%<br />
45 - 54 14.4% 15.0% 14.3% 15.0% 15.1% 13.9% 13.6% 12.5% 15.1%<br />
55 - 64 9.8% 9.0% 10.0% 10.0% 10.3% 9.2% 10.9% 7.5% 10.5%<br />
65 - 74 9.0% 7.5% 8.9% 8.9% 9.3% 7.9% 8.0% 5.6% 8.1%<br />
75 and over<br />
2000 Population by Race (%)<br />
9.1% 7.7% 9.1% 9.1% 9.0% 7.7% 6.9% 5.1% 6.8%<br />
White 95.3% 95.1% 97.4% 95.3% 96.6% 85.4% 98.8% 92.2% 98.8%<br />
Black 3.5% 3.9% 1.6% 3.3% 2.0% 10.0% 0.4% 3.4% 0.3%<br />
Indian/Alaska Native 0.1% 0.1% 0.1% 0.1% 0.1% 0.1% 0.1% 0.2% 0.1%<br />
Asian 0.2% 0.2% 0.2% 0.4% 0.5% 1.8% 0.2% 2.5% 0.1%<br />
Hawaiian/Other Pacific Islander 0.0% 0.0% 0.0% 0.0% 0.0% 0.0% 0.0% 0.0% 0.0%<br />
Some Other Race 0.1% 0.1% 0.3% 0.2% 0.1% 1.5% 0.1% 0.3% 0.0%<br />
Two or More Races 0.7% 0.6% 0.4% 0.8% 0.6% 1.2% 0.4% 1.4% 0.5%<br />
2000 Persons of Hispanic Origin (%)<br />
2000 Households (%)<br />
0.4% 0.9% 0.7% 0.6% 0.5% 3.2% 0.4% 1.0% 0.6%<br />
1-person households 11.3% 9.5% 10.2% 10.8% 10.9% 10.8% 9.0% 12.8% 9.3%<br />
Family households 27.7% 26.0% 27.5% 27.6% 28.3% 26.1% 28.0% 22.6% 28.5%<br />
Married-couple family* 20.9% 20.5% 22.8% 22.1% 23.1% 20.1% 23.4% 17.9% 23.4%<br />
with children under 18** 8.1% 8.4% 9.0% 8.7% 9.0% 8.5% 9.9% 7.5% 9.7%<br />
Female-headed family* 5.0% 4.0% 3.3% 4.1% 3.9% 4.5% 3.2% 3.4% 3.6%<br />
with children under 18** 2.6% 2.1% 1.7% 2.0% 1.9% 2.4% 1.8% 1.8% 1.8%<br />
Nonfamily households 1.3% 1.5% 1.3% 1.6% 1.3% 2.0% 1.4% 5.5% 1.5%<br />
Householder 65 and over<br />
*% of Family Households<br />
** % of married-couple and female-headed families<br />
Annual Household Income<br />
12.0% 10.0% 11.6% 11.6% 11.8% 9.9% 9.3% 7.2% 10.0%<br />
Less than $15,000 27.2% 24.3% 21.1% 17.8% 17.0% 16.7% 21.9% 29.4% 25.9%<br />
$15,000 to $24,999 18.4% 17.4% 18.5% 14.9% 15.9% 13.8% 16.5% 15.3% 19.1%<br />
$25,000 to $34,999 15.0% 14.7% 17.2% 13.6% 14.3% 13.3% 15.8% 13.2% 16.8%<br />
$35,000 to $44,999 10.5% 11.5% 13.5% 12.1% 12.2% 11.9% 12.6% 10.0% 12.4%<br />
$45,000 to $59,999 12.3% 12.1% 14.6% 14.7% 14.1% 14.2% 13.8% 11.3% 12.7%<br />
$60,000 to $74,999 7.0% 9.1% 7.4% 9.7% 10.2% 10.3% 7.7% 6.9% 6.1%<br />
$75,000 to $99,999 5.5% 6.4% 4.5% 8.8% 8.5% 9.6% 6.2% 6.8% 4.0%<br />
$100,000 to $149,999 2.9% 3.4% 2.1% 5.5% 5.3% 6.6% 3.5% 4.6% 2.0%<br />
$150,000 to $199,999 0.5% 0.5% 0.5% 1.3% 1.2% 1.8% 0.9% 1.0% 0.5%<br />
$200,000 or more<br />
Median Household Income ($)<br />
0.7% 0.5% 0.7% 1.5% 1.3% 1.9% 1.0% 1.4% 0.4%<br />
Median Household Income - 1990<br />
Median Household Income - 1990<br />
19,195 19,903 21,674 25,468 25,736 29,069 22,733 22,183 19,940<br />
(adjusted for inflation) 25,241 26,172 28,501 33,490 33,843 38,226 29,894 29,171 26,221<br />
Median Household Income - 2000 27,451 30,352 30,911 37,607 37,106 40,106 32,238 28,625 27,927<br />
% Change 1990 to 2000<br />
Individuals Below Poverty Level<br />
8.8% 16.0% 8.5% 12.3% 9.6% 4.9% 7.8% -1.9% 6.5%<br />
% of Total Population 18.0% 15.9% 11.8% 9.8% 8.6% 11.0% 13.3% 22.8% 18.3%<br />
% of All Population Below 18 5.9% 5.2% 3.7% 3.0% 2.6% 3.6% 4.3% 3.5% 6.0%<br />
% of All Population 18 to 64 9.7% 8.9% 6.3% 5.3% 4.6% 6.0% 7.0% 18.4% 10.2%<br />
% of All Population 65 and Over<br />
Source: US Bureau of the Census<br />
2.4% 1.7% 1.8% 1.5% 1.4% 1.4% 2.0% 0.9% 2.1%<br />
June 2005<br />
Page 41