2010 January 14, 2010 January 14, 2010 - Zawya
2010 January 14, 2010 January 14, 2010 - Zawya
2010 January 14, 2010 January 14, 2010 - Zawya

You also want an ePaper? Increase the reach of your titles
YUMPU automatically turns print PDFs into web optimized ePapers that Google loves.
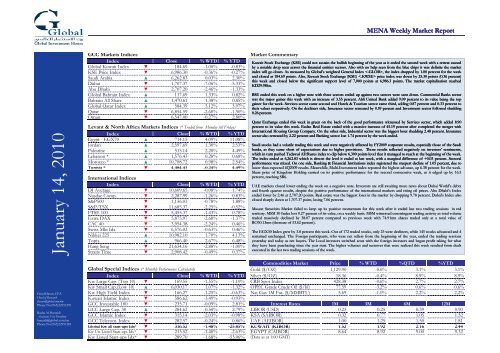
<strong>January</strong> <strong>14</strong>, <strong>2010</strong><br />
Faisal Hasan, CFA<br />
Head of Research<br />
fhasan@global.com.kw<br />
Phone No:(965)22951270<br />
Rasha Al-Huneidi<br />
Assistant Vice President<br />
huneidi@global.com.kw<br />
Phone No:(965)22951285<br />
GCC Markets Indices Market Commentary<br />
Index Close % WTD % YTD<br />
Global Kuwait Index ▼ 184.69 -1.00% -0.83%<br />
KSE Price Index ▼ 6,986.30 -0.36% -0.27%<br />
Saudi Arabia ▲ 6,262.83 0.03% 2.30%<br />
Dubai<br />
Abu Dhabi<br />
▼<br />
▼<br />
1,707.37<br />
2,707.20<br />
-7.06%<br />
-2.46%<br />
-5.33%<br />
-1.33%<br />
KD29.98bn.<br />
Global Bahrain Index ▲ 117.69 1.33% 0.82%<br />
Bahrain All Share ▲ 1,470.61 1.38% 0.85%<br />
Global Qatar Index ▲ 584.39 3.12% 3.97%<br />
Qatar<br />
Oman<br />
▼<br />
▼<br />
6,854.59<br />
6,547.00<br />
-2.60%<br />
-0.27%<br />
-1.50%<br />
2.80%<br />
0.26 percent. percent.<br />
Levant & North Africa Markets Indices (* Traded from Monday till Friday)<br />
Index Close % WTD % YTD<br />
Egypt - EGX70 ▲ 7<strong>14</strong>.15 4.09% 11.08%<br />
Jordan ▲ 2,597.69 1.30% 2.53%<br />
Palestine ▲ 515.<strong>14</strong> 2.20% 4.49%<br />
Lebanon * ▲ 1,576.43 0.28% 0.68%<br />
Morocco * ▲ 10,708.72 0.98% 2.54%<br />
Tunisia * ▼ 44,484.43 484 43 -0.24% 0 24% 44.49% 49%<br />
MENA Weekly Market Report<br />
Kuwait Stock Exchange (KSE) could not sustain the bullish bullish beginning beginning of the year as it ended the second week with a a retreat caused caused<br />
by a notable drop drop seen seen across the financial entities sectors. sectors. Also with no help seen from from the blue chips chips it it was was definite definite the market<br />
index will go down. As As measured measured by by Global’s weighted General General Index , the index dropped by by 1.00 1.00 percent percent for the week week<br />
and closed at 184.69 184.69 points. Also, Kuwait Stock Exchange (KSE) price index was down by by 25.30 points (0.36 (0.36 percent)<br />
this week and and closed below the significant support level of 7,000 points at 6,986.3 points. The market capitalization reached<br />
BSE BSE ended this week on a a higher note with three sectors ended up against two two sectors were seen down. Commercial Commercial Banks sector<br />
was was the major gainer this week with an increase of 3.55 percent. Ahli United Bank added 9.09 percent to its value being being the top<br />
gainer for the week. Services Services sector came second and Hotels & Tourism sector came third, adding 0.87 percent percent and 0.33 percent to to<br />
their values respectively. respectively. On the the decliners decliners side, Insurance sector retreated by 0.59 percent percent and Investment sector followed shedding<br />
Qatar Exchange Exchange ended this week in green on the back of of the the good performance witnessed by Services Services sector, which added 8.90<br />
percent to its value this week. Ezdan Real Estate ended with a massive increase of 45.19 percent after completed the merger with<br />
International Housing Group Group Company. Company. On On the other side, Industrial sector was the biggest loser shedding 2.48 percent. Insurance<br />
sector also retreated retreated by 2.22 2.22 percent and Banking sector lost 1.74 1.74 percent by the week ended.<br />
Saudi Saudi stocks had a volatile trading this week and were negatively affected by FY2009 corporate results, especially those of the Saudi<br />
banks, as they came short short of expectations due to higher provisions. Those results reflected negatively on investors’ sentiments,<br />
which which in turn pushed Tadawul Tadawul All Shares index to dip below 6,300 points level that it managed to reach at the beginning of the week.<br />
The index ended at 6,262.83 which is almost the level it ended at last week, with a marginal difference of +0.03 percent. Sectoral<br />
performance was mixed. On one side, Banking & Financial Institutions index registered registered the steepest decline of 1.05 percent, due to<br />
lower than expected 4Q2009 4Q2009 results. Meanwhile, Multi-Investment index reported the highest advance, up 6.38 percent for the week.<br />
Share price of Kingdom Holding carried on its positive performance for the second consecutive week, as it edged up by 16.5<br />
percent, reaching SR6.<br />
International Indices<br />
Index<br />
DJ Average ▼<br />
Close<br />
10,609.65<br />
% WTD<br />
-0.08%<br />
% YTD<br />
1.74%<br />
UAE markets closed lower ending the week on a negative note. Investors are still awaiting more news about Dubai World's debts<br />
and fourth quarter results, despite the positive performance of the international markets and rising oil prices. Abu Dhabi’s Index<br />
Nasdac Comp.<br />
S&P500<br />
▼<br />
▼<br />
2,287.99<br />
1,136.03<br />
-1.26%<br />
-0.78%<br />
0.83%<br />
1.88%<br />
ended lower by 2.46 at 2,707.20 points. Real estate was the biggest loser in the market by dropping 9.78 percent. Dubai's Index also<br />
closed sharply down at 1,707.37 point, losing 7.06 percent.<br />
S&P/TSX<br />
FTSE 100<br />
▼<br />
▼<br />
11,685.37<br />
5,455.37<br />
-2.25%<br />
-1.43%<br />
-0.52%<br />
0.78%<br />
Muscat Securities Market failed to keep up its positive momentum for this week after it ended last two trading sessions in red<br />
territory. MSM 30 Index lost 0.27 percent of its value, on a weekly basis. MSM witnessed constringent trading activity as total volume<br />
Extra DAX<br />
CAC 40<br />
▼<br />
▼<br />
5,875.97<br />
3,954.38<br />
-2.68%<br />
-2.24%<br />
-1.37%<br />
0.46%<br />
traded massively declined by 38.07 percent compared to previous week with 74.91mn shares traded only at a total value of<br />
RO30.13mn (decrease of 33.62 percent).<br />
Swiss Mkt Idx<br />
Nikkei 225<br />
Topix<br />
▼<br />
▲<br />
▲<br />
6,576.02<br />
10,982.10<br />
966.40<br />
-0.63%<br />
1.70%<br />
2.67%<br />
0.46%<br />
4.13%<br />
6.48%<br />
The EGX30 Index grew by 3.8 percent this week. Out of 172 traded stocks, only 23 were decliners, while <strong>14</strong>5 stocks advanced and 4<br />
remained unchanged. The Foreign participants, who were net sellers from the beginning of the year, ended the trading sessions<br />
yesterday and today as net buyers. The Local investors switched seats with the foreign investors and began profit taking for what<br />
Hang Seng<br />
Straits Time<br />
▼<br />
▼<br />
21,654.16<br />
2,908.42<br />
-2.88%<br />
-0.49%<br />
-1.00%<br />
0.37%<br />
they have been purchasing since the year start. The higher volumes and turnover that were realized this week resulted from deals<br />
executed in the last two trading sessions of the week.<br />
SENSEX ▬ 17,119.03 0.00% -1.98%<br />
Commodities Market Price % WTD %QTD %YTD<br />
Global Special Indices (* Monthly Performance Calculated) Gold ($/OZ) 1,129.90 -0.6% 3.1% 3.1%<br />
Index Close % WTD % YTD Silver ($/OZ) 18.36 -0.4% 8.9% 8.9%<br />
Kw Large Cap. (Top 10) ▼ 169.55 -1.55% -1.10% CRB Spot Index 428.38 -0.6% 2.7% 2.7%<br />
Kw Small Cap.(Low 10) ▲ 6,030.17 1.07% -1.32% OPEC Grade Crude Oil ($/bl) 77.59 -3.2% 0.6% 0.6%<br />
Kw High Yield Index ▼ 166.27 -1.25% -0.63% Nat Gas 1M Fut. ($/MMBTU) 5.69 -1.0% 2.2% 2.2%<br />
Kuwait Islamic Index ▼ 586.62 -3.49% -0.93%<br />
GCC Investable 100 ▼ 235.71 -0.09% 2.81% Interest Rates 1M 3M 6M 12M<br />
GCC Large Cap. 30 ▲ 284.62 0.50% 2.79% LIBOR (USD) 0.23 0.25 0.39 0.90<br />
GCC Islamic Index ▼ 315.<strong>14</strong> -2.03% -0.98% KSA (SAIBOR) 0.32 0.77 1.05 1.32<br />
GCC Telecom. Index ▼ 282.57 -0.24% 0.86% UAE (AEIBOR) 1.00 1.25 1.50 1.81<br />
Global Kw all start-ups Idx* ▼ 316 316.52 52 -1.48% -1 48% -25 -25.85% 85% KUWAIT (KIBOR) 152 1.52 192 1.92 216 2.16 244 2.44<br />
Kw Un-Listed Start-ups Idx* ▼ 213.52 -1.40% -2.63% EGYPT (CAIBOR) 8.64 8.92 9.00 9.32<br />
Kw Listed Start-ups Idx* ▼ 289.70 -1.68% -53.06% (Data as at 1:00 GMT)
<strong>January</strong> <strong>14</strong>, <strong>2010</strong><br />
MENAWeekly Market Report- Kuwait<br />
KSE Indices Market News<br />
Index Close % Change % YTD - Burgan Bank become the majority shareholder in Iraq's Bank of Baghdad Bank after increasing its<br />
Global General Kw ▼ 184.69<br />
-1.00% -0.83% stake in the lender to 50.6%. Burgan Bank acquired an additional 5.3% stake for $10.7 million.<br />
Global Kuwait Only ▼ 191.24<br />
-1.29% -1.09%<br />
KSE Price Index ▼ 6,986.30<br />
-0.36% -0.27% -Kuwaiti investments covering various economic and development sectors in Sudan are estimated at<br />
Shares in Bn<br />
0.80<br />
0.60<br />
0.40<br />
0.20<br />
0.00<br />
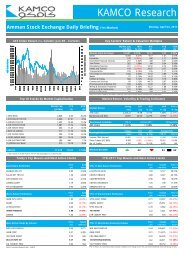
Global KW General Index & Daily volume<br />
193<br />
190<br />
187<br />
184<br />
181<br />
178<br />
175<br />
Market Spread<br />
Advancers<br />
Decliners<br />
Unchanged<br />
Traded<br />
63<br />
69<br />
72<br />
163<br />
USD six billion, a senior Sudanese official said Monday.<br />
-Bank of Kuwait and the Middle East held its ordinary and extraordinary general meetings (OGM &<br />
EGM) on Sunday, 10/1/<strong>2010</strong>. Shareholders approved some amendments in the Contract of<br />
Association as well as the Articles of Incorporation, in addition to converting the lender into a Shariacompliant<br />
one. They also gave the go-ahead for rebranding the bank as Ahli United Bank..<br />
10/01 11/01 12/01 13/01 <strong>14</strong>/01 Total 204<br />
Volume Traded Global Kw General Index<br />
-The price of Kuwaiti crude oil broke the USD 80 per barrel (pb) barrier on Monday for the first time<br />
Volume Traded ▲<br />
Last<br />
2,667,245,000<br />
Previous<br />
1,724,497,500<br />
% Change<br />
54.67%<br />
in months, settling at USD 80.28.<br />
Value Traded (KD)<br />
Transactions<br />
Market Cap. (KD)<br />
▲<br />
▲<br />
▼<br />
290,622,530<br />
32,104<br />
29,984,943,525<br />
210,667,220<br />
24,886<br />
30,288,415,405<br />
37.95%<br />
29.00%<br />
-1.00%<br />
Top Five Gainers<br />
Global Sectoral Indices<br />
Company<br />
Al-Safat TEC Holding Co.<br />
Price (KD)<br />
0.0680<br />
%Change<br />
19.30%<br />
Volume<br />
68,680,000<br />
IIndex d Cl Close %Ch % Change %YTD % YTD DDanah h Al Safat S f Foodstuff F d ff Company C 00.1520 1520 16.92% 16 92% 64 64,460,000 460 000<br />
Banking Index ▼ 256.21<br />
-2.84% -1.51% Kout Food Group 0.3050<br />
12.96% 220,000<br />
Investment Index ▼ 122.82<br />
-2.37% -2.56% Jeezan Holding Company 0.0670<br />
11.67% 269,920,000<br />
Insurance Index ▼ 47.68<br />
-3.80% -3.80% Al-Safat Energy Holding Company 0.0820<br />
10.81% 89,640,000<br />
Real Estate Index ▲ 61.94<br />
0.32% -0.07%<br />
Industrial Index ▼ 193.88<br />
-1.53% -2.16%<br />
Services Index ▲ 865.16<br />
0.68% -0.16%<br />
Top Five Decliners<br />
Food Index ▲ 372.04<br />
0.55% 3.00% Company Price (KD) %Change Volume<br />
Non-Kuwaiti Index ▲ 54.54<br />
1.69% 1.64% The Securities House 0.1260<br />
-19.23% 600,000<br />
Traded Volume by Sector<br />
Safwan Trading & Contracting Company<br />
The International Investor<br />
0.1880<br />
0.0390<br />
-13.76%<br />
-10.34%<br />
80,000<br />
6,720,000<br />
Sector Traded Volume % of total market trades National Company for Consumer Industries 0.0940<br />
-9.62% 100,000<br />
Real Estate 991,685,000<br />
37.2% Hilal Cement Co. 0.2320<br />
-9.02% 20,000<br />
Investment 685,780,000<br />
25.7%<br />
Services 656,070,000<br />
24.6%<br />
Non Kuwaiti 190,250,000<br />
7.1%<br />
Volume Leaders<br />
Food 65,877,500<br />
2.5% Company Price (KD) %Change Volume<br />
Industrial 46,670,000<br />
1.7% International Resorts Company 0.0730<br />
10.61% 300,600,000<br />
Banking 30,402,500<br />
1.1% Jeezan Holding Company 0.0670<br />
11.67% 269,920,000<br />
Insurance 510,000<br />
0.0% Al- Deera Holding Co. 0.1060<br />
-1.85% 204,880,000<br />
Traded Value by Sector<br />
Kuwait Real Estate Company<br />
Al-Safwa Holding Group<br />
0.0740<br />
0.0540<br />
5.71%<br />
-1.82%<br />
200,880,000<br />
192,600,000<br />
Sector Traded Value (KD) % of total market trades<br />
Services 83,4<strong>14</strong>,370<br />
28.70%<br />
Real Estate 72,665,640<br />
25.00%<br />
Value Leaders<br />
Investment 69,198,530<br />
23.81% Company Price (KD) %Change Value (KD)<br />
Banking 24,081,880<br />
8.29% Al-Deera Holding Co. 0.1060<br />
-1.85% 22,989,520<br />
Non Kuwaiti 17,289,080<br />
5.95% International Resorts Company 0.0730<br />
10.61% 22,128,200<br />
IIndustrial d t i l 13 13,623,040 623 040 44.69% 69% JJeezan HHolding ldi CCompany 00.0670 0670 11.67% 11 67% 17,872,720 17 872 720<br />
Food 10,204,190<br />
3.51% Agility 0.6400<br />
4.92% 15,360,650<br />
Insurance <strong>14</strong>5,800<br />
0.05% Kuwait Real Estate Company 0.0740<br />
5.71% 15,133,600
<strong>January</strong> <strong>14</strong>, <strong>2010</strong><br />
MENAWeekly Market Report- Bahrain<br />
BSE Indices Market News<br />
Index Close % Change % YTD<br />
Global Bahraini Idx ▲ 117.69<br />
1.34% 0.83% - Global Banking Corporation and Batelco Group have taken the first step forward in a strategic<br />
BH All Share Index ▲ 1,470.61<br />
1.39% 0.85% partnership for the acquisition by GBCORP of an 11% stake in S-Tel, India - a joint venture telecom<br />
Shares in<br />
mn<br />
Global Bahraini Index & Volume<br />
Market Spread<br />
company, established between the Batelco Group and the Siva Group, India.<br />
5.00<br />
120.0<br />
Advancers<br />
Decliners<br />
8<br />
5<br />
- Kuwait-based real estate developer First Bahrain, a unit of Global Investment House, said it has<br />
completed the first stage of its Majaal warehousing and logistics project.<br />
0.00<br />
115.0 Unchanged 37 - Bahrain's Inovest plans to set up pharmaceutical laboratories in the country's Salman Industrial City<br />
10/01 11/01<br />
Volume Traded<br />
12/01 13/01 <strong>14</strong>/01<br />
Global Bahraini Stocks Index<br />
Traded<br />
Total<br />
23<br />
50<br />
at an estimated cost of US$100mn.<br />
- Esterad Investment Company announced the opening of subscriptions to the first public offering of<br />
Volume Traded ▲<br />
Last<br />
10,786,134<br />
Previous<br />
4,667,068<br />
% Change<br />
131.11%<br />
convertible bonds to be made by a Bahraini company on the Bahrain Stock Exchange.<br />
Value Traded (BD) ▲ 2,004,539<br />
945,570 111.99%<br />
Transactions<br />
Market Cap. (BD)<br />
▲<br />
▲<br />
523<br />
6,341,971,588<br />
213<br />
6,258,279,403<br />
<strong>14</strong>5.54%<br />
1.34%<br />
Global Sectoral Indices<br />
IIndex d Cl Close %Ch % Change %YTD % YTD<br />
TTop Five Fi Gainers G i<br />
Commercial Banks Idx ▲ 185.41<br />
3.55% 2.98% Company Price (BD) %Change Volume<br />
Investment Index ▼ 72.02<br />
-0.26% -0.95% Ahli United Bank $ 0.480<br />
9.09% 180,650<br />
Preferred Shares Index<br />
Closed Co. Index<br />
Insurance Index<br />
Services Index<br />
▬<br />
▬<br />
▼<br />
▲<br />
85.63<br />
137.47<br />
99.98<br />
<strong>14</strong>9.24<br />
0.00%<br />
0.00%<br />
-0.59%<br />
0.87%<br />
0.00%<br />
0.00%<br />
-0.93%<br />
0.58%<br />
Nass Corporation BSC<br />
Al Salam Bank<br />
Bahrain Tourism Co.<br />
Ithmaar Bank $<br />
0.260<br />
0.097<br />
0.326<br />
0.220<br />
5.69%<br />
4.30%<br />
2.52%<br />
2.33%<br />
1,046,582<br />
1,225,066<br />
21,320<br />
5,905,642<br />
Hotels & Tourism Idx<br />
Industrial Index<br />
▲<br />
▬<br />
400.28<br />
182.77<br />
0.33%<br />
0.00%<br />
0.41%<br />
0.00%<br />
Top Five Decliners<br />
Traded Volume by Sector<br />
Company<br />
INOVEST B.S.C. $<br />
Price (BD)<br />
0.580<br />
%Change<br />
-4.92%<br />
Volume<br />
232,300<br />
Sector Traded Volume % of total market trades Bahrain National Holding Co. 0.450<br />
-2.17% 111,000<br />
Commercial Banks 2,226,329<br />
20.64% Al Baraka Banking Group B.S.C. $ 1.6800<br />
-1.18% 43,667<br />
Investment<br />
Preferred Shares<br />
6,613,648<br />
-<br />
61.32%<br />
0.00%<br />
Bahrain Commercial Facilities<br />
National Bank of Bahrain<br />
0.4<strong>14</strong>0<br />
0.5950<br />
-0.96%<br />
-0.83%<br />
41,002<br />
216,667<br />
Closed Co. -<br />
0.00%<br />
Insurance 116,936<br />
1.08%<br />
Volume Leaders<br />
Services 1,804,901<br />
16.73% Company Price (BD) %Change Volume<br />
Hotels & Tourism<br />
Industrial<br />
24,320<br />
-<br />
0.23%<br />
0.00%<br />
Ithmaar Bank $<br />
Al Salam Bank<br />
0.220<br />
0.097<br />
2.33%<br />
4.30%<br />
5,905,642<br />
1,225,066<br />
Traded Value by Sector<br />
Nass Corporation BSC<br />
Khaleeji Commercial Bank<br />
0.260<br />
0.130<br />
5.69%<br />
0.00%<br />
1,046,582<br />
458,300<br />
Sector Traded Value (BD) % of total market trades Bahrain Telecommunications Co. 0.595<br />
0.85% 374,402<br />
Commercial Banks 389,316<br />
19.42%<br />
Investment 952,598<br />
47.52%<br />
Value Leaders<br />
Preferred Shares -<br />
0.00% Company Price (BD) %Change Value (BD)<br />
Closed Co. -<br />
0.00% Ithmaar Bank $ 0.220<br />
2.33% 499,634<br />
Insurance 52,296<br />
2.61% Investcorp Bank $ 1,488.550<br />
0.00% 308,651<br />
SServices i 603 603,206 206 30 30.09% 09% NNass Corporation C i BSC 0.260 0 260 5.69% 5 69% 268 268,8<strong>14</strong> 8<strong>14</strong><br />
Hotels & Tourism 7,123<br />
0.36% Bahrain Telecommunications Co. 0.595<br />
0.85% 222,418<br />
Industrial -<br />
0.00% National Bank of Bahrain 0.595<br />
-0.83% 128,917
<strong>January</strong> <strong>14</strong>, <strong>2010</strong><br />
MENA Weekly Market Report- Qatar<br />
Qatar Exchange Indices Market News<br />
Index Close % Change % YTD<br />
- Qatar National Bank disclosed the financial statements for the year ended December 31, 2009. The<br />
General Qatari Idx ▲ 584.39<br />
3.12% 3.97% financial statements revealed a net profit of QR4.2bn in 2009 compared to QR3.65bn in 2008. The<br />
Global Qatar Islamic ▲ 648.38<br />
1.66% 5.55% bank’s earnings per share (EPS) in 2009 amounted to QR<strong>14</strong> versus QR12.3 in 2008.<br />
DSM 20 Index ▼ 6,854.59<br />
-2.60% -1.50%<br />
- Qatar Petrochemical Company (QAPCO), a subsidiary company of Industries Qatar, announced the<br />
mn shares Global Qatari Index & Daily volume<br />
opening of a new representative office in Jakarta, Indonesia.<br />
15.00<br />
600<br />
Market Spread<br />
- Barwa Real Estate Company and Qatar Real Estate Investment Company announced the initial<br />
10.00<br />
5.00<br />
590<br />
580<br />
570<br />
Advancers<br />
Decliners<br />
Unchanged<br />
Traded<br />
11<br />
32<br />
1<br />
44<br />
terms of their proposed merger. The enlarged Barwa group will be the ninth largest company on the<br />
Qatar Exchange with a market capitalisation of QR11.1bn.<br />
0.00<br />
10/01 11/01 12/01 13/01 <strong>14</strong>/01<br />
560<br />
Total 44<br />
Volume Traded Global Qatari General Index<br />
Top Five Gainers<br />
Last Previous % Change Company Price (QR) %Change Volume<br />
Ezdan Real Estate Company 39.20<br />
45.19% 649,329<br />
VVolume l TTraded d d ▲ 40,373,732 40 373 732 25,108,185 25 108 185 60.80% 60 80% Qatar Q Real R l Estate E Investment I Co. C 31.20 31 20 12.23% 12 23% 5,521,687 5 521 687<br />
Value Traded (QR) ▲ 1,355,168,858 852,447,576<br />
58.97% Qatar Shipping Co. 36.30<br />
10.00% 2,122,841<br />
Transactions<br />
Market Cap. (QR)<br />
▲<br />
▲<br />
26,429<br />
391,003,130,632<br />
17,437<br />
322,336,280,937<br />
51.57%<br />
21.30%<br />
Al Khalij Commercial Bank<br />
Qatar Meat & Livestock Co.<br />
15.00<br />
18.50<br />
4.90%<br />
3.93%<br />
1,530,895<br />
4,526,176<br />
Global Sectoral Indices<br />
Top Five Decliners<br />
Index Close % Change % YTD Company Price (QR) %Change Volume<br />
Barwa Real Estate Company 30.00<br />
-9.09% 4,772,220<br />
Banking & Finance ▼ 758.88<br />
-1.74% -0.16% Qatar Islamic Insurance 31.40<br />
-6.82% 24,849<br />
Insuarnce Index ▼ 487.71<br />
-2.22% -2.51% Gulf Warehousing Co. 19.20<br />
-6.34% 367,455<br />
Industrial Index ▼ 475.82<br />
-2.48% -1.64% Salam International 10.70<br />
-5.31% 744,906<br />
Services Index ▲ 506.79<br />
8.90% 9.13% Commercial Bank 60.20<br />
-4.60% 1,440,213<br />
Traded Volume by Sector<br />
Volume Leaders<br />
Sector Traded Volume % of total market trades Company Price (QR) %Change Volume<br />
Qatar Real Estate Investment Co. 31.20<br />
12.23% 5,521,687<br />
Banking & Finance 9,260,928<br />
22.94% Barwa Real Estate Company 30.00<br />
-9.09% 4,772,220<br />
Insuarnce 319,301<br />
0.79% Qatar Meat & Livestock Co. 18.50<br />
3.93% 4,526,176<br />
Industrial 3,809,285<br />
9.44% Al Rayan Bank 13.30<br />
-2.92% 3,273,062<br />
Services 26,984,218<br />
66.84% Vodafone Qatar 8.30<br />
-1.19% 2,442,224<br />
Traded Value by Sector<br />
Value Leaders<br />
Sector Traded Value (QR) % of total market trades Company Price (QR) %Change Value (QR)<br />
Qatar Real Estate Investment Co. 31.20<br />
12.23% 175,669,092<br />
Banking & Finance 379,755,585<br />
28.02% Barwa Real Estate Company 30.00<br />
-9.09% 154,183,904<br />
IInsuarnce 17 17,050,668 050 668 11.26% 26% Industries d i QQatar 112 112.30 30 -2.52% 2 52% 150 150,548,404 548 404<br />
Industrial 212,574,962<br />
15.69% Qatar National Bank 152.20<br />
-0.13% 102,739,234<br />
Services 745,787,643<br />
55.03% Commercial Bank 60.20<br />
-4.60% 87,798,671
<strong>January</strong> <strong>January</strong> <strong>14</strong>, <strong>2010</strong><br />
MENAWeekly Market Report - Saudi Arabia<br />
Saudi Index Market News<br />
Index<br />
Tadawul All Share ▲<br />
Close<br />
6,262.83<br />
% Change<br />
0.03%<br />
% YTD<br />
2.30%<br />
-BOD of Samba Financial Group proposed the distribution SR0.75 per share cash dividend<br />
for the period ending December 31, 2009 (H2-2009), which awaits the AGM's approval.<br />
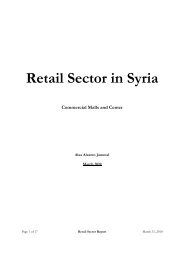
Shares in Bn Saudi Tadawul Index & daily volume<br />
0.40<br />
6,350<br />
6,300<br />
0.20<br />
6,250<br />
0.00<br />
6,200<br />
09/01 10/01 11/01 12/01 13/01<br />
Market Spread<br />
Advancers<br />
Decliners<br />
Unchanged<br />
Traded<br />
Total<br />
82<br />
42<br />
10<br />
134<br />
135<br />
-Arabian Cement Company announced that it expects to operate its US$400mn Al<br />
Qatranah cement plant (Jordan) by mid-<strong>2010</strong>, which has an annual cement production capacity of 2<br />
million tons and a daily manufacturing capacity of 5,000 tons of clinker.<br />
-Saudi Electricity Company signed a SR1.1bn (US$290mn) contract with Arabian Bemco<br />
Contracting Company to expand a power plant in the center of the kingdom. The new project at Qassim,<br />
which has reached a load of 2,000 megawatts, will be completed within three years.<br />
Volume Traded<br />
Volume Traded<br />
Value Traded (SR)<br />
Transactions<br />
Market Cap. (SR)<br />
▲<br />
▲<br />
▲<br />
▲<br />
Saudi Tadawul Index<br />
Last<br />
729,976,949<br />
15,181,539,8<strong>14</strong><br />
376,860<br />
1,232,599,977,309<br />
Previous<br />
456,338,826<br />
11,060,083,188<br />
289,138<br />
1,228,089,091,055<br />
% Change<br />
59.96%<br />
37.26%<br />
30.34%<br />
0.37%<br />
-BOD of Kingdom Holding Company approved its plan to reduce its capital. Kingdom<br />
Holding plans to reduce its capital to SR37.1bn, from SR63bn. The outstanding number of shares will be<br />
subsequently reduced from 6.3bn shares to 3.71bn shares.<br />
-Al Alamiya for Cooperative Insurance Company received the final qualification from the<br />
Council of Cooperative Health Insurance to issue health insurance policies.<br />
Saudi Sectoral Indices<br />
-Nama Chemicals Company will stop the expansion project at the Soda Factory until it<br />
guarantees the necessary raw materials to run the plant after finalizing the expansion.<br />
Index Close % Change % YTD<br />
Banks & Financial Services ▼ 15,767.98<br />
-1.05% 0.60%<br />
PPetrochemical h i l Industries I d i ▼ 55,647.63 647 63 -0.18% 0 18% 4.65% 4 65%<br />
TTop Five Fi Gainers G i<br />
Cement ▼ 3,869.57<br />
-1.04% -1.18% Company Price (SR) %Change Volume<br />
Retail ▲ 4,413.21<br />
0.50% 0.58% Kingdom Holding Co. 6.000<br />
16.50% 122,025,395<br />
Energy & Utilities<br />
Agricul. & Food Indus.<br />
Telecom. & Inform.<br />
Insurance<br />
▼<br />
▲<br />
▲<br />
▲<br />
4,257.24<br />
5,294.60<br />
1,865.21<br />
1,060.16<br />
-0.33%<br />
3.41%<br />
0.29%<br />
0.47%<br />
1.11%<br />
5.67%<br />
4.12%<br />
-1.81%<br />
Alahli Takaful Company<br />
Al Babtain Power & Telecommunications Company<br />
Anaam International Holding Group<br />
Saudi Fisheries<br />
109.000<br />
37.500<br />
61.750<br />
55.250<br />
15.04%<br />
11.94%<br />
10.76%<br />
7.80%<br />
1,728,862<br />
4,667,423<br />
2,444,441<br />
4,622,497<br />
Multi-Investment ▲ 2,653.38<br />
6.38% 8.61%<br />
Industrial Investment ▲ 4,697.12<br />
0.98% -0.22%<br />
Top Five Decliners<br />
Building & Construction ▲ 3,823.46<br />
2.20% 1.95% Company Price (SR) %Change Volume<br />
Real Estate Development ▲ 3,297.39<br />
0.88% 1.06% Saudi British Bank 41.100<br />
-7.43% 1,606,576<br />
Transport ▲ 3,601.50<br />
4.95% 6.00% Saudi Arabian Cooperative Insurance Company 62.500<br />
-6.02% 839,880<br />
Media and Publishing ▲<br />
Hotel & Tourism ▲<br />
Trading Activity of Saudi Market<br />
1,920.51<br />
5,981.72<br />
2.38%<br />
1.45%<br />
1.40%<br />
1.40%<br />
Weqaya Takaful insurance and reinsurance company<br />
Eastern Cement<br />
Bank Al-Jazirah<br />
38.000<br />
47.400<br />
18.100<br />
-5.24%<br />
-5.01%<br />
-4.74%<br />
5,097,072<br />
561,420<br />
4,266,688<br />
Sector Traded Value (SR) Traded Volume<br />
Banks & Financial Services 2,291,103,396<br />
134,939,975<br />
Volume Leaders<br />
Petrochemical Industries<br />
4,581,863,549<br />
164,049,261 Company Price (SR) %Change Volume<br />
Cement<br />
126,<strong>14</strong>9,498<br />
2,827,928 Kingdom Holding Co. 6.000<br />
16.50% 122,025,395<br />
Retail<br />
488,718,289<br />
16,748,294 Alinma Bank 12.850<br />
0.78% 115,<strong>14</strong>5,637<br />
Energy & Utilities<br />
97,589,079<br />
8,210,047 Saudi Kayan Petrochemical Co. 19.050<br />
1.06% 73,225,295<br />
Agricul. & Food Indus.<br />
1,<strong>14</strong>6,551,699<br />
31,437,730 Saudi Arabian Mining Company 17.400<br />
-0.29% 23,486,133<br />
Telecom. & Inform.<br />
738,278,104<br />
34,953,172 Dar Alarkan Real Estate Development Company <strong>14</strong>.200<br />
1.07% 22,960,369<br />
Insurance<br />
1,693,449,405<br />
45,113,348<br />
Multi-Investment 1,134,316,347<br />
150,<strong>14</strong>8,280<br />
Value Leaders<br />
Industrial Investment<br />
783,475,382<br />
34,094,370 Company Price (SR) %Change Value (SR)<br />
Building & Construction<br />
981,450,880<br />
32,807,226 Alinma Bank 12.850<br />
0.78% 1,481,877,228<br />
Real Estate Development<br />
664,217,018<br />
52,348,352 Saudi Kayan Petrochemical Co. 19.050<br />
1.06% 1,398,718,869<br />
Tr Transport n p rt<br />
287 287,330,409 330 409 16,719,435 16 719 435 SSaudi diBBasic i IIndustries d i CCorp 88 88.000 000 11.15% 15% 11,120,886,493 120 886 493<br />
Media and Publishing<br />
47,536,898<br />
1,949,977 Kingdom Holding Co. 6.000<br />
16.50% 668,616,791<br />
Hotel & Tourism<br />
119,509,864<br />
3,629,554 Yanbu National Petrochemical Company (YANSAB) 35.100<br />
-1.40% 472,101,682
<strong>January</strong> <strong>January</strong> <strong>14</strong>, <strong>2010</strong><br />
MENA Weekly Market Report- UAE<br />
UAE Indices Market News<br />
Close Close % Change % YTD - U.A.E. Consumer confidence fell by 4.8% during the last three months of 2009 for the first time<br />
Abu Dhabi General ▼ 2,707.20 -2.46% -1.33% since the first quarter of the year as residents in the country felt the pinch of the financial crisis.<br />
Dubai General Idx ▼ 1,707.37 -7.06% -5.33% - Abu Dhabi Investment Authority is looking at investment opportunities in Germany. Managing<br />
Shares in Bn DFM, ADX Indices Indices Indices & Daily volume<br />
0.50<br />
3,000<br />
0.40<br />
2,500<br />
0.30<br />
2,000<br />
0.20<br />
0.10<br />
1,500<br />
0.00<br />
1,000<br />
10/01 11/01 12/01 13/01 <strong>14</strong>/01<br />
Total Volume of UAE Markets<br />
Market Spread<br />
Advancers<br />
Decliners<br />
Unchanged<br />
Traded<br />
Total<br />
15<br />
53<br />
64<br />
73<br />
133<br />
Director, Sheik Ahmed bin Zayed Al-Nahyan, said Germany is a highly productive and innovative<br />
market with world-class companies in chemicals, machinery and car manufacturing.<br />
- Arabtec and Aabar Investments have agreed for Aabar to acquire 70<br />
percent of the shares in Arabtec by way of a convertible mandatory bond for US$1.7bn.<br />
- Nakheel said it will make a US$10.3mn distribution payment on an Islamic bond, or sukuk, that<br />
matures next year. The payment is scheduled for <strong>January</strong> 19 for the US$750mn trust certificates due<br />
in 2011.<br />
- Union Properties is considering the sale of some of its completed property assets to<br />
generate liquidity and enhance revenues, as the company struggles amidst a real estate downturn.<br />
Last Previous % Change<br />
Volume Traded ▼ 1,580,298,561 1,822,356,863 -13.28%<br />
Value Traded (AED)<br />
Transactions<br />
Market Cap. (AED)<br />
▼<br />
▼<br />
▼<br />
3,182,621,679<br />
34,525<br />
442,498,988,184<br />
4,375,836,430<br />
41,280<br />
458,009,190,677<br />
-27.27%<br />
-16.36%<br />
-3.39%<br />
Top Five Gainers<br />
Abu Dhabi Sectoral Indices<br />
Company<br />
Global Investment House<br />
Price (AED)<br />
1.4400<br />
%Change<br />
29.73%<br />
Volume<br />
92,700<br />
Cl Close Cl Close % %Ch Change %YTD % YTD GlfFi Gulf Finance House H 11.1900 1900 10 10.19% 19% 27 27,022,691 022 691<br />
Banking & Financial ▼ 3,712.<strong>14</strong> -3.46% -3.09% National Cement Company p.s.c. 3.4000 8.97% 11,071<br />
Real Estate Sector<br />
Insurance Sector<br />
▼<br />
▼<br />
518.40<br />
2,926.39<br />
-9.78%<br />
-2.66%<br />
-4.35%<br />
-6.87%<br />
Al Salam Bahrain Bank<br />
United Arab Bank<br />
0.9400<br />
6.8200<br />
6.82%<br />
6.56%<br />
1,700,726<br />
9,238<br />
Consumer Sector ▼ 1,471.48 -2.04% 3.98%<br />
Constructions Sector ▼ 2,496.04 -2.10% -0.26%<br />
Energy Sector ▲ 183.37 0.77% 5.35%<br />
Top Five Decliners<br />
Health Care Sector ▼ 1,117.85 -7.02% -<strong>14</strong>.01% Company Price (AED) %Change Volume<br />
Telecommunications<br />
Industrial Sector<br />
▼<br />
▼<br />
2,271.97<br />
2,261.66<br />
0.00%<br />
-1.88%<br />
0.91%<br />
-4.90%<br />
Arabtec Holding Company<br />
EMAAR Properties<br />
2.4100<br />
3.5200<br />
-16.61%<br />
-13.09%<br />
328,598,657<br />
211,916,617<br />
Dubai Sectoral Indices<br />
Abu Dhabi National Co for B & M<br />
Al Dar Properties<br />
1.8600<br />
4.6300<br />
-11.85%<br />
-10.96%<br />
136,500<br />
49,181,031<br />
Close Close % Change % YTD Union Properties 0.6600 -10.81% 52,508,358<br />
Banking Sector ▼ 930.55 -3.50% -3.94%<br />
Investment Sector ▼ 2,170.22 -7.59% -7.58%<br />
Insurance Sector ▼ 3,402.19 -1.70% -1.87%<br />
Volume Leaders<br />
Real Estate ▼ 3,272.27 -12.50% -8.17% Company Price (AED) %Change Volume<br />
Materials Sector ▬ 128.46 0.00% -9.57% Arabtec Holding Company 2.4100 -16.61% 328,598,657<br />
Utilities Sector ▼ 1,388.22 -6.10% -4.94% EMAAR Properties 3.5200 -13.09% 211,916,617<br />
Telecommunications ▼ 469.26 -3.01% -0.34% Commercial Bank International 1.4400 2.86% <strong>14</strong>5,720,991<br />
Consumer Staples<br />
Transportation<br />
▬<br />
▼<br />
501.00<br />
464.94<br />
0.00%<br />
-3.56%<br />
0.00%<br />
-0.57%<br />
Drake & Scull International<br />
Dubai Financial Market PJSC<br />
0.8400<br />
1.6900<br />
-6.67%<br />
-10.58%<br />
121,930,027<br />
86,822,749<br />
Trading Activity of Dubai & Abu Dhabi Markets combined<br />
Close Traded Value (AED) Traded Volume<br />
Value Leaders<br />
Banking Sector 358,646,067.42 220,134,644 Company Price (AED) %Change Value (AED)<br />
Investment Sector 208,451,754.65 <strong>14</strong>8,028,089 Arabtec Holding Company 2.4100 -16.61% 853,810,612<br />
Insurance Sector 31,<strong>14</strong>6,375.29 27,049,949 EMAAR Properties 3.5200 -13.09% 794,416,307<br />
SServices i SSector - - Al Dar D Properties P i 4.6300 4 6300 -10.96% 10 96% 233 233,908,998 908 998<br />
Hotels -<br />
- Commercial Bank International 1.4400 2.86% 210,610,203<br />
Industrial Sector -<br />
- Dubai Financial Market PJSC 1.6900 -10.58% 152,519,413
<strong>January</strong> <strong>14</strong>, 4, 2009 2009<br />
Oman Index Market News<br />
Index Close % Change % YTD -Oman Investment & Finance Company has has entered into a Memorandum Memorandum of<br />
MSM 30 Index ▼ 6,547.00 -0.27% 2.80% Understanding Understanding (MOU) to acquire acquire majority shares of a company working in the field field of Money<br />
Shares in mn<br />
30.00<br />
MSM MSM 30 Index & Weekly volume<br />
6,650 Market Spread<br />
Exchange business, subject to approval by the concerned authorities, and the the legal legal and financial due due<br />
diligence is being started started to determine the the value to enable enable acquisition of shares of this this company. company.<br />
20.00<br />
10.00<br />
0.00<br />
10/01 11/01 12/01 13/01 <strong>14</strong>/01<br />
Volume Traded MSM 30 Index<br />
6,600<br />
6,550<br />
6,500<br />
Advancers 24<br />
Decliners 34<br />
Unchanged 75<br />
Traded 73<br />
Total 207<br />
MENA Weekly Market Report - Oman<br />
-Oman -Oman National Dairy Products Company announced that it has completed the<br />
sale process of of a parcel of land land at at Al Ghubrah area to Al Meera Investments Company for aa total<br />
value of OR8.7mn OR8.7mn , effective <strong>January</strong> 10, <strong>2010</strong>.<br />
-Bank Muscat has signed a US$200 million term loan facility with Oman<br />
Refineries Refineries and Petrochemicals Company, or ORPC, ORPC, to partly refinance refinance its working capital needs.<br />
The The dual currency facility, facility, with a maturity period of up to 25 months.<br />
Last Previous % Change -National Beverages reached a settlement with Majan Glass Co Ltd (SAOG), for<br />
Volume Traded<br />
Value Traded (RO)<br />
▼<br />
▼<br />
74,919,046<br />
30,013,319<br />
120,972,816<br />
45,216,361<br />
-38.07%<br />
-33.62%<br />
RO232, 500 against their claim of RO315, 339.<br />
Transactions<br />
Market Cap. (RO)<br />
▼<br />
▼<br />
13,771<br />
7,322,981,545<br />
18,430<br />
7,358,283,566<br />
-25.28%<br />
-0.48% Company<br />
Top Five Gainers<br />
Price (RO) %Change Volume<br />
Dhofar Cattle Feed 0.2310<br />
13.24% 854,933<br />
MSM Sectoral Indices<br />
National Mineral Water<br />
Ahli Bank<br />
0.1800<br />
0.2320<br />
7.78%<br />
7.41%<br />
12,620<br />
4,563,457<br />
Index Close % Change g % YTD Oman Chemical Industries 0.1190<br />
7.21% 19,630 ,<br />
Banking & Investment ▼ 9,630.40 -1.96% 2.73% Nat. Aluminium Products 0.5440<br />
6.04% 6,022,324<br />
Industry ▼ 7,678.83 -0.85% 3.12%<br />
Services & Insuarance ▼ 2,741.46 -0.77% 1.46%<br />
Top Five Decliners<br />
Traded Volume by Sector<br />
Company<br />
The Financial Corporation<br />
Price (RO)<br />
2.2<strong>14</strong>0<br />
%Change<br />
-10.00%<br />
Volume<br />
606<br />
Sector Traded Volume % Of total market trades Transgulf Ind. Inv. Holding 0.1180<br />
-8.53% 575,128<br />
Regular Market 74,800,202<br />
99.84% Oman And Emirates Inv. Om 0.2490<br />
-7.43% 1,626,<strong>14</strong>9<br />
Parallel Market 93,171<br />
0.12% Al Sharqia Inv. Holding 0.1200<br />
-6.25% <strong>14</strong>9,810<br />
Third Market 25,673<br />
0.034% Voltamp Energy 0.5970<br />
-5.84% 1,287,324<br />
Bonds Market 163,680<br />
0.22%<br />
Volume Leaders<br />
Traded Value by Sector Company Price (RO) %Change Volume<br />
Sector Price (RO) % Of total market trades Global Financial Investment 0.1080<br />
0.00% 12,204,375<br />
Regular Market 29,896,953<br />
99.61% Al Anwar Holding 0.1180<br />
-5.69% 6,043,561<br />
Parallel Market 108,524<br />
0.36% Nat. Aluminium Products 0.2490<br />
6.04% 6,022,324<br />
Third Market 7,841<br />
0.026% Bank Sohar 0.1200<br />
4.87% 5,357,579<br />
Bonds Market 154,331,282<br />
5<strong>14</strong>.21% Ahli Bank 0.5970<br />
7.41% 4,563,457<br />
Trading by Nationality<br />
Value Leaders<br />
Nationality<br />
Buy %<br />
Volume<br />
Buy % Value<br />
Sell % Volume<br />
Sell % Value<br />
Company<br />
Nat. Aluminium Products<br />
Price (RO)<br />
0.5440<br />
%Change<br />
6.04%<br />
Value (OR)<br />
3,242,071<br />
Oman 85.88% 79.33% 80.02% 80.80% Bank Muscat 0.8610<br />
-4.44% 3,011,933<br />
GCC 7.55% 12.61% 13.22% 10.20% Oman Cables Industry 1.6050<br />
-1.89% 1,753,117<br />
Arabs 2.78% 2.44% 2.42% 2.66% Raysut Cement 1.6030<br />
4.29% 1,695,757<br />
Others 3.79% 5.62% 4.34% 6.35% Al Anwar Holding 0.2650<br />
-5.69% 1,654,059
<strong>January</strong> <strong>14</strong>, , <strong>2010</strong><br />
MENA Weekly Market Report- Egypt<br />
Egypt Indices Market News<br />
Index<br />
EGX30 Index<br />
EGX70 Index<br />
▲<br />
▲<br />
Close<br />
6,681<br />
715<br />
% Change<br />
3.79%<br />
4.24%<br />
% YTD<br />
7.60%<br />
11.23%<br />
- The Emirati Dana Gas announced that it discovered a new pool in Al Baraka4 concession in Southern Egypt,<br />
which is proving to be more productive than the currently producing zones, having tested oil with natural flow<br />
to surface at a rate of 220 barrels per day. The well also tested with artificial lifting at a maximum rate of 1,300<br />
Shares in Mn<br />
<strong>14</strong>0<br />
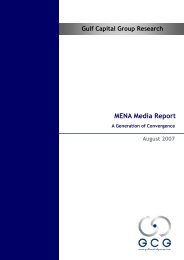
EGX30 Index & Daily Volume<br />
6,800<br />
Market Spread<br />
barrels per day. In addition, the American Apache Corp. announced an oil and gas discovery in the Western<br />
120<br />
100<br />
80<br />
60<br />
40<br />
20<br />
-<br />
10/01 11/01 12/01<br />
Volume Traded<br />
13/01 <strong>14</strong>/01<br />
EGX 30 Index<br />
6,700<br />
6,600<br />
6,500<br />
6,400<br />
6,300<br />
Advancers<br />
Decliners<br />
Unchanged<br />
Traded<br />
Total<br />
<strong>14</strong>5<br />
23<br />
4<br />
289<br />
172<br />
desert of Egypt, which tested 5,085 barrels per day of oil and 130,000 cubic feet of gas per day.<br />
- Al Ezz Steel Rebars (Ezz Steel) signed a contract with Danieli & Co. and Tenova HYL for<br />
the turnkey supply of a 1.9mn tons per year capacity ENERGIRON III Direct Reduction Plant, which will be<br />
located in Suez and is expected to start operating by the third quarter of 2011.<br />
- The Administrative Court ruled in favor of Orascom Telecom Holding (OTH) concerning<br />
Volume Traded ▲<br />
Last<br />
543,276,428<br />
Previous<br />
338,841,937<br />
% Change<br />
60.33%<br />
the Company’s appeal against the Egyptian Financial Supervisory Authority (EFSA) decision, which approved<br />
France Telecom offer to fully acquire the Egyptian Company for Mobile Services (Mobinil) <br />
Value Traded (LE) ▲ 5,362,284,6<strong>14</strong> 2,797,563,925 91.68% at a price of LE245/share.<br />
Transactions<br />
Market Cap. (LE)<br />
▲<br />
▲<br />
268,244<br />
409,795,000,000<br />
168,678<br />
398,713,000,000<br />
59.03%<br />
2.78%<br />
- EFG - Hermes Holding announced that it is negotiating selling the Group’s and its<br />
subsidiaries’ total stake in Audi Bank. The price of the deal was set at US$91/share, at a total worth of<br />
The Egyptian Exchange (EGX) Sectoral Indices<br />
US$913.4mn, taking into consideration that the total shares to be sold amounts to 10.0mn shares, 7.6mn of<br />
Index Close % Change % YTD which are ordinary shares, while the remaining are Global Depositary Receipts (GDRs). However, the Group<br />
Banking ▲ 1,327<br />
4.40% 6.23% stated that it would make further disclosures once the deal comes into effect.<br />
Basic Resources ▲ 812<br />
0.28% 6.40%<br />
Chemicals ▲ 852<br />
2.60% 11.81%<br />
Construction & Materials ▲ 1,573<br />
6.46% 6.22%<br />
Financial Services (Ex. (Ex Banks) ▲ 821<br />
55.90% 90% 13 13.37% 37%<br />
Top Five Gainers<br />
Food & Beverage ▲ 1,133<br />
6.00% 16.36% Company Price (LE) %Change Volume<br />
Health Care & Pharma. ▲ 1,324<br />
2.18% 3.99% National Real Estate Bank for Development 36.2<br />
44.01% 3,476,829<br />
Industrial Goods, Serv. & Auto. ▲ 1,852<br />
4.41% 12.17% El Wadi for Exporting Agricultural Products 35.0<br />
33.33% 21,446<br />
Personal & Household ▲ 597<br />
1.50% 11.93% Gulf Canadian Real Estate Investment Co. 36.8<br />
26.68% 474,795<br />
Real Estate<br />
Telecommunications<br />
▲<br />
▲<br />
1,208<br />
530<br />
3.24%<br />
0.96%<br />
7.99%<br />
5.62%<br />
Egyptian Media Production City<br />
Giza General Contracting<br />
6.9<br />
54.6<br />
23.49%<br />
22.46%<br />
<strong>14</strong>,583,429<br />
566,521<br />
Travel & Leisure ▲ 655<br />
3.55% 11.95%<br />
Trading Activity by Sector<br />
Top Five Decliners<br />
Sector Traded Value (LE) Traded Volume Company Price (LE) %Change Volume<br />
Banking 194,109,995<br />
7,331,539 Societe Arabe Internationale De Banque (SAIB) (US$) <strong>14</strong>.5 -19.93% 171<br />
Basic Resources 267,877,770<br />
13,966,387 Alexandria National Company for Financial Investment 40.7 -19.44% 72,451<br />
Chemicals 73,465,710<br />
4,172,308 El Watany Bank of Egypt 41.6 -16.55% 19,671<br />
Construction & Materials 876,447,742<br />
78,616,859 Egyptian Company for Mobile Services (MobiNil) 227.7<br />
-5.56% 813,558<br />
Financial Services (Ex. Banks) 792,052,016<br />
67,841,803 Cairo Educational Services 31.6<br />
-4.51% 44,311<br />
Food & Beverage<br />
458,203,736<br />
35,492,584<br />
Health Care & Pharma. 16,677,650<br />
407,566<br />
Volume Leaders<br />
Industrial Goods, Serv. & Auto. 328,956,153<br />
80,707,420 Company Price (LE) %Change Volume<br />
Oil and Gas <strong>14</strong>,648,850<br />
1,073,180 Upper Egypt General Contracting 1.8<br />
5.32% 58,472,836<br />
Personal & Household 332,325,416<br />
90,183,364 Egyptian Electrical Cables 1.3<br />
5.65% 53,937,529<br />
Real Estate 775,980,095<br />
67,473,267 El Nasr Clothes & Textiles (Kabo) 1.7<br />
1.18% 37,047,366<br />
Retail 48,676,580<br />
5,570,400 Egyptian Resorts Company (ERC) 1.9<br />
3.83% 35,065,574<br />
Media<br />
99,940,569<br />
<strong>14</strong>,583,429 TMG Holding 7.1<br />
-0.70% 24,932,883<br />
Technology<br />
31,756,681<br />
4,663,640<br />
Telecommunications 950,216,429<br />
31,5<strong>14</strong>,419<br />
Value Leaders<br />
Travel & Leisure 96,731,463<br />
39,623,087 Company Price (LE) %Change Value (LE)<br />
Utilities<br />
4,217,761<br />
55,176 Orascom Telecom Holding (OTH) 28.5<br />
4.25% 553,206,243<br />
Investors By Type weekly trading percent Orascom Construction Industries (OCI) 262.8<br />
6.52% 471,697,528<br />
Investors % Precentage Investors % Precentage EFG - Hermes Holding 30 30.77<br />
11 11.29% 29% 334 334,092,239 092 239<br />
Local 79.72% Retail 47.67% Telecom Egypt 18.8<br />
1.84% 205,018,465<br />
Foreign & Arab 9.27%/11.01% Institution 52.33% El Ezz Steel Rebars 18.5<br />
-0.22% 199,022,124
Global Investment House<br />
Global Tower<br />
Sharq, Al-Shuhada Str.<br />
P.O. Box: 28807 Safat, 13<strong>14</strong>9 Kuwait<br />
Website: www.globalinv.net<br />
Tel. : +(965) 2 295 1000<br />
Fax. : +(965) 2 295 1005<br />
Research<br />
Faisal Hasan, CFA<br />
(965) 2295-1270<br />
fhasan@global.com.kw<br />
Wealth Management - Kuwait<br />
Rasha Al-Qenaei<br />
(965) 2295-1380<br />
alqenaei@global.com.kw<br />
Disclaimer<br />
Global Kuwait<br />
Tel: (965) 2 295 1000<br />
Fax: (965) 2 295 1005<br />
P.O.Box 28807 Safat, 13<strong>14</strong>9 Kuwait<br />
Global Abu Dhabi<br />
Tel: (971) 2 6744446<br />
Fax: (971) 2 6725263/4<br />
P.O.Box 127373 Abu Dhabi, UAE<br />
Global Egypt<br />
Tel: 20 (2) 7609526<br />
Fax: 20 (2) 7609506<br />
P.O.Box 7 Abdel Hadi Saleh St., El-Nasr<br />
Tower, Giza<br />
Index<br />
Rasha Al-Huneidi<br />
(965) 2295-1285<br />
huneidi@global.com.kw<br />
Brokerage<br />
Khaled Abd Elrahman Khaled<br />
(965) 2295-1700<br />
kkhalid@global.com.kw<br />
Global Bahrain<br />
Tel: (973) 17 210011<br />
Fax: (973) 17 210222<br />
P.O.Box 855 Manama, Bahrain<br />
Global Saudi Arabia<br />
Tel: (966) 1 2199966<br />
Fax: (966) 1 2178481<br />
P.O. Box 66930 Riyadh 11586, Kingdom<br />
of Saudi Arabia<br />
Global Jordan<br />
Tel: (962) 6 5005060<br />
Fax: (962) 6 5005066<br />
P.O.Box 3268 Amman 11180, Jordan<br />
Global Dubai<br />
Tel: (971) 4 257977<br />
Fax: (971) 4 257960/1/2<br />
P.O.Box 121227 Dubai, UAE<br />
Global Qatar<br />
Tel: (974) 4967305<br />
Fax: (974) 4967307<br />
P.O.Box 18126 Doha, Qatar<br />
Wealth Management –International<br />
Fahad Al-Ibrahim<br />
(965) 2295-<strong>14</strong>00<br />
fahad@global.com.kw<br />
This document and its contents are prepared for your personal use for information purposes only and is not an offer, or the solicitation of an offer, to buy or sell a security or enter into any other<br />
agreement. Projections of potential risk or return are illustrative, and should not be taken as limitations of the maximum possible loss or gain. The information and any views expressed are given as at<br />
the date of writing and subject to change. While the information has been obtained from sources believed to be reliable we do not represent that it is accurate or complete and it should not be relied on as<br />
such. Global Investment House, its affiliates and subsidiaries can accept no liability for any direct or consequential loss arising from use of this document or its contents. At any time, Global<br />
Investment House or its employees may have a position, subject to change, in any securities or instruments referred to, or provide services to the issuer of those securities or instruments