KSE Daily Report_KMEFIC_BlueChips.xlsm - Zawya
KSE Daily Report_KMEFIC_BlueChips.xlsm - Zawya
KSE Daily Report_KMEFIC_BlueChips.xlsm - Zawya

You also want an ePaper? Increase the reach of your titles
YUMPU automatically turns print PDFs into web optimized ePapers that Google loves.
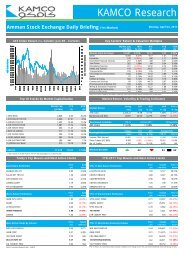
KUWAIT STOCK EXCHANGE Market <strong>Daily</strong> <strong>Report</strong> as on Jun 23, 2011<br />
<strong>KSE</strong> Price Index 6,263.9<br />
<strong>KSE</strong> Weighted Index 436.28<br />
Kuwait & Middle East Financial Investment Co.<br />
<strong>KMEFIC</strong><br />
TODAY MTD YTD<br />
▼ (14.8)<br />
▼ (114.3)<br />
▼ (691.6)<br />
-0.24% -1.79% -9.94%<br />
▼ (0.59)<br />
▼ (7.41)<br />
▼ (47.89)<br />
-0.14% -1.67% -9.89%<br />
2011 Data Box<br />
Average<br />
Volume<br />
Index<br />
<strong>KSE</strong> Price Index<br />
High<br />
6,999.4<br />
Low<br />
6,134.6<br />
6,500.3<br />
160<br />
140<br />
120<br />
147.62<br />
111.18<br />
6,320<br />
6,310<br />
6,300<br />
6,290<br />
<strong>KSE</strong> Weighted Index<br />
Volume (mil shares)<br />
Value (KWD mil)<br />
494.40<br />
481.98<br />
71.28<br />
420.82<br />
55.08<br />
8.11<br />
455.79<br />
181.06<br />
30.60<br />
100<br />
80<br />
60<br />
55.08<br />
66.77<br />
93.68<br />
6,280<br />
6,270<br />
6,260<br />
6,250<br />
BlueChip<br />
Rank to<br />
Market<br />
Rank to<br />
Sector<br />
Closing<br />
Fils<br />
<strong>BlueChips</strong> Today<br />
Change% YTD%<br />
40<br />
20<br />
0<br />
19-Jun 20-Jun 21-Jun<br />
Volume (mil. Shares)<br />
22-Jun 23-Jun<br />
Price Index<br />
6,240<br />
6,230<br />
6,220<br />
6,210<br />
101 NBK<br />
605 ZAIN<br />
108 KFIN<br />
102 GBK<br />
103 CBK<br />
109 BOUBYAN<br />
1<br />
2<br />
3<br />
4<br />
5<br />
6<br />
1<br />
1<br />
2<br />
3<br />
4<br />
5<br />
1,160<br />
1,040<br />
1,020<br />
540<br />
870<br />
600<br />
0.00%<br />
0.00%<br />
0.00%<br />
0.00%<br />
2.35%<br />
00.00% 00%<br />
-9.38%<br />
-21.21%<br />
-3.77%<br />
-5.26%<br />
-4.40%<br />
-4.76% 4 76%<br />
Market Activity 818 AUB<br />
7 1 200 -0.99% 3.09%<br />
Today DoD % YTD % 613 NMTC<br />
8 2 1,960 0.00% 5.38%<br />
Market Cap (KWD bn) 30.65 -0.13% -7.95% 104 ABK<br />
9 6 650 0.00% -4.41%<br />
Volume (mil shares) 111.18 -24.68% 105 ALMUTAHED<br />
10 7 780 0.00% 27.87%<br />
Value (KWD mil) 17.50<br />
-47.67% Market Sectors<br />
Banks 11,838.7<br />
Market Breadth Map Investment 4,016.8<br />
Active Gainers Losers Unch. Insurance 2,596.9<br />
Count 97 17 44 36 Real Estate 2,167.3<br />
Volume (mil shares) 28.41 59.44 23.34 111.18 Industry 4,456.8<br />
% to Market 25.55% 53.46% 20.99% 1.00 Services 14,180.4<br />
Value (KWD mil) 5.22 4.24 8.04 17.50 Food 4,335.1<br />
% to Market 29.82% 24.25% 45.93% 1.00<br />
SECTOR Volume<br />
Banks 8.27<br />
Investment 12.41<br />
Insurance -<br />
Real Estate 36.12<br />
Industry 5.84<br />
Services 21.91<br />
Food 0.49<br />
Non Kuwaiti 26.15<br />
111.18<br />
% to<br />
market<br />
Value<br />
7.44% 5.45<br />
11.16% 1.04<br />
0.00% -<br />
32.48% 2.50<br />
5.25% 2.00<br />
19.71% 4.16<br />
0.44% 0.47<br />
23.52% 1.88<br />
1.00 17.50<br />
% to<br />
market<br />
Non Kuwaiti 6,463.5<br />
No. of<br />
issues<br />
Sector<br />
Cap (KWD<br />
million)<br />
31.16% 9 13,369.75<br />
5.95% 51 2,454.12<br />
0.00% 7 300.66<br />
14.27% 39 1,776.74<br />
11.42% 29 2,390.93<br />
23.80% 61 7,648.68<br />
2.68% 6 743.96<br />
Index DoD % YTD %<br />
-0.02% ▼ -0.46% ▼<br />
-0.32% ▼ -17.35% ▼<br />
0.00% ▬ -3.72% ▼<br />
-0.20% ▼ -8.00% ▼<br />
-0.30% ▼ -16.22% ▼<br />
0.02% ▲ -7.42% ▼<br />
-1.94% ▼ -6.53% ▼<br />
-0.53% ▼ -11.19% ▼<br />
Market Capitalization & Valuation Multiples<br />
Today's Activity Market Capitalization Valuation Metrics*<br />
% to<br />
market<br />
Rank to<br />
Market<br />
43.63% 1 20.54<br />
8.01% 3 13.79<br />
0.98% 8 14.48<br />
5.80% 6 17.58<br />
7.80% 4 14.37<br />
24.96% 2 14.63<br />
2.43% 7 15.40<br />
PE P/B ROE<br />
2.43<br />
1.55<br />
0.89<br />
1.77<br />
1.84<br />
1.24<br />
1.34<br />
8.77%<br />
6.13%<br />
7.62%<br />
4.95%<br />
9.25%<br />
10.63%<br />
13.40%<br />
10.72% 13 1,960.74 6.40% 5 13.65 0.81 9.89%<br />
1.00<br />
*<strong>KSE</strong> Valuation Metrics are calculated by simple averages excluding P/E > 40 & negative ROE.<br />
Kuwait & Middle East Financial Investment Company (K.S.C.C.) <strong>KMEFIC</strong>- P.O.Box 819 Safat 13009 Kuwait<br />
Tel.:(+965) 2225 5000 Fax:(+965) 2225 2563 www.kmefic.com.kw Research@kmefic.com.kw<br />
(Kindly refer to the Disclaimer on the following page)<br />
Page 1
KUWAIT STOCK EXCHANGE Market <strong>Daily</strong> <strong>Report</strong> as on Jun 23, 2011<br />
Kuwait & Middle East Financial Investment Co.<br />
<strong>KMEFIC</strong><br />
Market Movers & Most Active Stocks<br />
▲ Top Gainers Most Active By Volume<br />
Close DoD Volume Volume % to Close DoD<br />
(fils) Change % ('000 shares) ('000 shares) market (fils) Change %<br />
PEARL 22.5 12.50% 2,880 GFH 24,920 22.41% 68.0 -2.86%<br />
AINV 13.0<br />
ALTIJARIA 78.0<br />
CLEANING 148.0<br />
ALRAI 85.0<br />
4.00% 1,840<br />
4.00% 11,720<br />
2.78% 280<br />
2.41% 200<br />
ALTIJARIA 11,720<br />
ABYAAR 5,200<br />
MANAZEL 5,120<br />
KRE 5,040<br />
10.54% 78.0<br />
4.68% 29.5<br />
4.61% 21.0<br />
4.53% 50.0<br />
4.00%<br />
-1.67%<br />
0.00%<br />
-1.96%<br />
▼ Top Losers Most Active By Turnover<br />
Close DoD Volume Value % to Close DoD<br />
(fils) Change % ('000 shares) ('000 KWD) market (fils) Change %<br />
ARKAN 60.0 -7.69% 200 NBK 3,170 18.11% 1,160.0 0.00%<br />
SALBOOKH 62.0<br />
KPPC 52.0<br />
ALOLA 99.0<br />
MARAKEZ 71.0<br />
Volatility<br />
Price Weighted<br />
30 Days 2.32% 3.44%<br />
60 Days 2.97% 4.70%<br />
90 Days 6.55% 10.22%<br />
52-weeks 9.05% 14.18%<br />
-7.46% 840<br />
-5.45% 80<br />
-4.81% 560<br />
-4.05% 160<br />
7,200<br />
7,000<br />
6,800<br />
6,600<br />
6,400<br />
6,200<br />
6,000<br />
495<br />
475<br />
455<br />
435<br />
415<br />
395<br />
375<br />
GFH 1,778<br />
KIB 1,261<br />
BPCC 1,232<br />
ALAFCO 1,195<br />
Kuwait & Middle East Financial Investment Company (K.S.C.C.) <strong>KMEFIC</strong>- P.O.Box 819 Safat 13009 Kuwait<br />
Tel.:(+965) 2225 5000 Fax:(+965) 2225 2563 www.kmefic.com.kw Research@kmefic.com.kw<br />
10.16% 68.0<br />
7.21% 325.0<br />
7.04% 580.0<br />
6.83% 340.0<br />
1 year <strong>KSE</strong> Price Index<br />
Price Index 10 EMA 30 EMA<br />
J-10 J-10 A-10 S-10 O-10 N-10 D-10 J-11 F-11 M-11 A-11 M-11 J-11<br />
1 year <strong>KSE</strong> Weighted Index<br />
Weighted Index 10 EMA 30 EMA<br />
J-10 J-10 A-10 S-10 O-10 N-10 D-10 J-11 F-11 M-11 A-11 M-11 J-11<br />
Legal DISCLAIMER: This report is being provided for informational purposes only and on the condition that it will not form a primary basis for any investment decision. This report is not an offer to buy or sell any of the securities that may be referred to<br />
herein. In no event will <strong>KMEFIC</strong> be liable for any loss occurring from investment decisions made based on the recommendation here-enclosed. Past performance is not necessarily a guide to future performance. Investors should make their own decision on<br />
whether or not to buy or sell the securities covered herein based upon their specific investment goals and in consultation with their financial advisor. <strong>KMEFIC</strong> has no obligation to update, modify or amend this report or to otherwise make any notification or<br />
announcement thereof in the event that any matter stated herein, or any opinion, projection, forecast or estimate set forth herein, changes or subsequently becomes inaccurate. The inclusion of any opinions/estimates does not necessarily imply a recommendation<br />
or endorse the views expressed within them. Many areas of the report contain opinions and/or analysis that represent the involved analysts' views; neither the analysts nor <strong>KMEFIC</strong> shall be in any way liable for their opinions expressed in the report. This<br />
report has been prepared and issued by the Research Department @ Kuwait & Middle East Financial Investment Co. K.S.C.C. (<strong>KMEFIC</strong>), a licensed Kuwaiti investment company regulated by the Central Bank of Kuwait. <strong>KMEFIC</strong> prepared this report using<br />
publicly available information, internal data, and other sources considered reliable; however, <strong>KMEFIC</strong> makes no representations or warranties of any kind, express or implied, about the completeness, accuracy, reliability, suitability with respect to the report or<br />
the information, analysis, opinions, or related graphics contained on the report for any purpose. While great care has been taken to ensure that the facts stated are accurate, neither <strong>KMEFIC</strong> nor any of its employees shall be in any way responsible for the<br />
contents. Neither this document nor any of its contents may be distributed in any jurisdiction where its distribution is restricted by law. Neither this document nor its content may be copied, transmitted or distributed without the prior written consent of <strong>KMEFIC</strong>.<br />
Additional information on the contents of this report is available on request.<br />
-2.86%<br />
0.00%<br />
1.75%<br />
1.49%<br />
Page 2