8 Modeling Survival Data with Categorical ... - NCSU Statistics
8 Modeling Survival Data with Categorical ... - NCSU Statistics
8 Modeling Survival Data with Categorical ... - NCSU Statistics

Create successful ePaper yourself
Turn your PDF publications into a flip-book with our unique Google optimized e-Paper software.
CHAPTER 8 ST 745, Daowen Zhang<br />
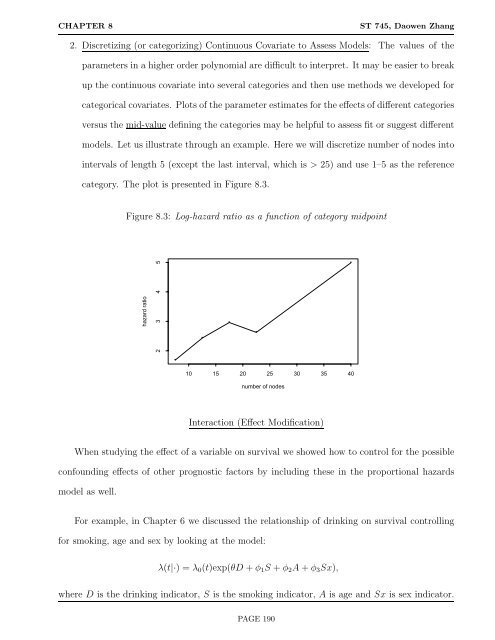
2. Discretizing (or categorizing) Continuous Covariate to Assess Models: The values of the<br />
parameters in a higher order polynomial are difficult to interpret. It may be easier to break<br />
up the continuous covariate into several categories and then use methods we developed for<br />
categorical covariates. Plots of the parameter estimates for the effects of different categories<br />
versus the mid-value defining the categories may be helpful to assess fit or suggest different<br />
models. Let us illustrate through an example. Here we will discretize number of nodes into<br />
intervals of length 5 (except the last interval, which is > 25) and use 1–5 as the reference<br />
category. The plot is presented in Figure 8.3.<br />
Figure 8.3: Log-hazard ratio as a function of category midpoint<br />
hazard ratio<br />
2 3 4 5<br />
•<br />
•<br />
•<br />
•<br />
10 15 20 25 30 35 40<br />
number of nodes<br />
Interaction (Effect Modification)<br />
When studying the effect of a variable on survival we showed how to control for the possible<br />
confounding effects of other prognostic factors by including these in the proportional hazards<br />
model as well.<br />
For example, in Chapter 6 we discussed the relationship of drinking on survival controlling<br />
for smoking, age and sex by looking at the model:<br />
λ(t|·) =λ0(t)exp(θD + φ1S + φ2A + φ3Sx),<br />
where D is the drinking indicator, S is the smoking indicator, A is age and Sx is sex indicator.<br />
PAGE 190<br />
•