8 Modeling Survival Data with Categorical ... - NCSU Statistics
8 Modeling Survival Data with Categorical ... - NCSU Statistics
8 Modeling Survival Data with Categorical ... - NCSU Statistics

You also want an ePaper? Increase the reach of your titles
YUMPU automatically turns print PDFs into web optimized ePapers that Google loves.
CHAPTER 8 ST 745, Daowen Zhang<br />
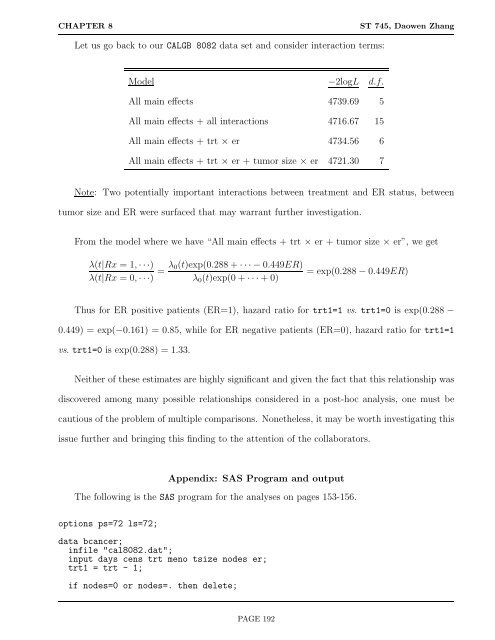
LetusgobacktoourCALGB 8082 data set and consider interaction terms:<br />
Model −2logL d.f.<br />
All main effects 4739.69 5<br />
All main effects + all interactions 4716.67 15<br />
All main effects + trt × er 4734.56 6<br />
All main effects + trt × er + tumor size × er 4721.30 7<br />
Note: Two potentially important interactions between treatment and ER status, between<br />
tumor size and ER were surfaced that may warrant further investigation.<br />
From the model where we have “All main effects + trt × er + tumor size × er”, we get<br />
λ(t|Rx =1, ···)<br />
λ(t|Rx =0, ···) = λ0(t)exp(0.288 + ···−0.449ER)<br />
λ0(t)exp(0 + ···+0)<br />
=exp(0.288 − 0.449ER)<br />
Thus for ER positive patients (ER=1), hazard ratio for trt1=1 vs. trt1=0 is exp(0.288 −<br />
0.449) = exp(−0.161) = 0.85, while for ER negative patients (ER=0), hazard ratio for trt1=1<br />
vs. trt1=0 is exp(0.288) = 1.33.<br />
Neither of these estimates are highly significant and given the fact that this relationship was<br />
discovered among many possible relationships considered in a post-hoc analysis, one must be<br />
cautious of the problem of multiple comparisons. Nonetheless, it may be worth investigating this<br />
issue further and bringing this finding to the attention of the collaborators.<br />
Appendix: SAS Program and output<br />
The following is the SAS program for the analyses on pages 153-156.<br />
options ps=72 ls=72;<br />
data bcancer;<br />
infile "cal8082.dat";<br />
input days cens trt meno tsize nodes er;<br />
trt1 = trt - 1;<br />
if nodes=0 or nodes=. then delete;<br />
PAGE 192