South-East Asia Regional Conference on Epidemiology
South-East Asia Regional Conference on Epidemiology
South-East Asia Regional Conference on Epidemiology

You also want an ePaper? Increase the reach of your titles
YUMPU automatically turns print PDFs into web optimized ePapers that Google loves.
<str<strong>on</strong>g>South</str<strong>on</strong>g>-<str<strong>on</strong>g>East</str<strong>on</strong>g> <str<strong>on</strong>g>Asia</str<strong>on</strong>g> <str<strong>on</strong>g>Regi<strong>on</strong>al</str<strong>on</strong>g> <str<strong>on</strong>g>C<strong>on</strong>ference</str<strong>on</strong>g> <strong>on</strong> <strong>Epidemiology</strong> | 205<br />
<strong>on</strong>e can assess the nature of the food that is available and the nature of the food that is affordable.<br />
The social envir<strong>on</strong>mental is relevant in terms of culture and norms regarding in-home or out-of-home<br />
c<strong>on</strong>sumpti<strong>on</strong> patterns, types and quality of foods c<strong>on</strong>sumed, serving quantities, preferred locati<strong>on</strong>s for<br />
obtaining food, and percepti<strong>on</strong>s of food availability and pricing which may differ from the directly<br />
measured reality. Social factors like these and culture, more generally, are spatially distributed as<br />
are built envir<strong>on</strong>mental factors relating to food. Such geographical data are not generally captured<br />
by government data sets but can be prepared using spatially organized inventories of services or<br />
resources, residents percepti<strong>on</strong>s and direct observati<strong>on</strong>s by researchers.<br />
Spatial data can be characterized in different ways; for example, by using predefined administrative<br />
boundaries (e.g. census tracts) or using buffers of defined radii to scale spatial representati<strong>on</strong>s for<br />
each survey participant according to where they live, work or travel between residence and work,<br />
or all three (18). It is often feasible and straightforward to perform multilevel modelling that<br />
c<strong>on</strong>siders food outlets and people as nested within census tracts or similar administrative units. But<br />
this approach has been criticized, in that administrative boundaries are artificial and typically lack<br />
a theoretical justificati<strong>on</strong> for use in representing meaningful social spaces. Buffer z<strong>on</strong>es suffer this<br />
same limitati<strong>on</strong> in the arbitrary specificati<strong>on</strong> of radii; however, buffer size can be allowed to vary<br />
according to some relevant envir<strong>on</strong>mental factor (e.g. populati<strong>on</strong> density) and buffers have the benefit<br />
of being centred <strong>on</strong> the locati<strong>on</strong> of individual residents. Given the data, GIS can be used to represent<br />
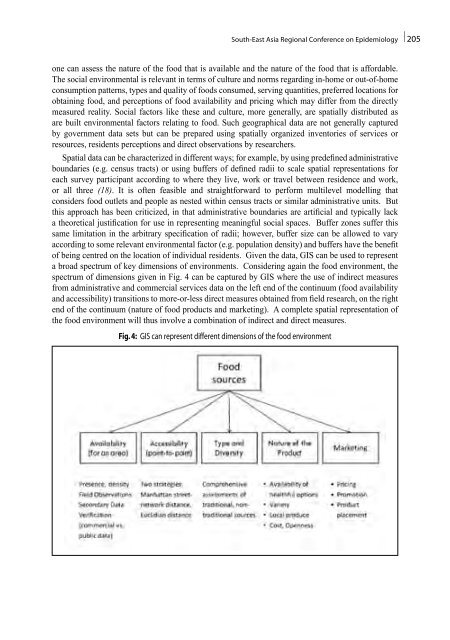
a broad spectrum of key dimensi<strong>on</strong>s of envir<strong>on</strong>ments. C<strong>on</strong>sidering again the food envir<strong>on</strong>ment, the<br />
spectrum of dimensi<strong>on</strong>s given in Fig. 4 can be captured by GIS where the use of indirect measures<br />
from administrative and commercial services data <strong>on</strong> the left end of the c<strong>on</strong>tinuum (food availability<br />
and accessibility) transiti<strong>on</strong>s to more-or-less direct measures obtained from field research, <strong>on</strong> the right<br />
end of the c<strong>on</strong>tinuum (nature of food products and marketing). A complete spatial representati<strong>on</strong> of<br />
the food envir<strong>on</strong>ment will thus involve a combinati<strong>on</strong> of indirect and direct measures.<br />
Fig. 4: GIS can represent different dimensi<strong>on</strong>s of the food envir<strong>on</strong>ment