Soil Erosion and Flood Risk Management
Soil Erosion and Flood Risk Management
Soil Erosion and Flood Risk Management

You also want an ePaper? Increase the reach of your titles
YUMPU automatically turns print PDFs into web optimized ePapers that Google loves.
For the field work it is recommended to use ground truth sheets, which can be seen in table 1. The main<br />
streets were digitalised from the WorldView2 satellite image using ArcGIS 9.3 for mapping the l<strong>and</strong> use in<br />
the investigation area (Map 1). It is important to note that the field work took place January, 7th <strong>and</strong> 8th<br />
2013 <strong>and</strong> the satellite image was taken January, 23 rd 2012. Differences between the vegetation cover may<br />
occur.<br />
Furthermore a subset of the investigation area was created from the satellite image. This is useful to mark<br />
ground truth information like GPS points. For more details, information photos were taken during the field<br />
work from the areas around the GPS points <strong>and</strong> other regions.<br />
The collected ground truth data are digitalised using the software ArcGIS 9.3.<br />
4.1.4 Results<br />
The results represent the calculated <strong>and</strong> collected data from Hotspot 2. First, the unsupervised <strong>and</strong> supervised<br />
classification is analysed. Subsequently, the ground truth data are digitalised to create a l<strong>and</strong> use map.<br />
Unsupervised classification derived from satellite data<br />
The first result created is the unsupervised classification which can be seen in Map 2. The ISODATA-<br />
algorithm calculated the maximum likelihood attached to all pixels. Two different classes of built up areas<br />
are possible to derive. Two classes of shadow were calculated as well. Furthermore, four different classes of<br />
vegetation <strong>and</strong> three types of different soils were derived.<br />
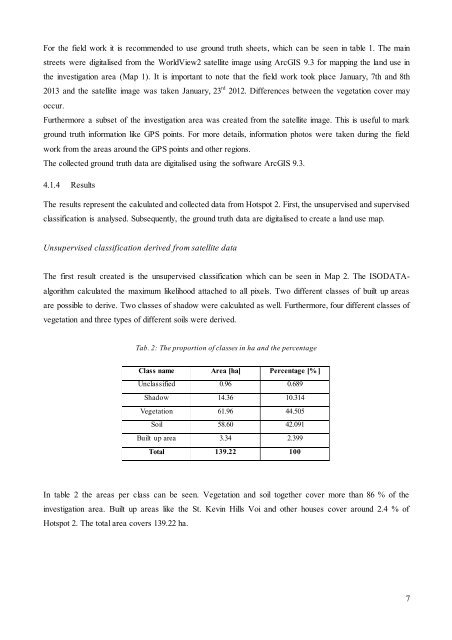
Tab. 2: The proportion of classes in ha <strong>and</strong> the percentage<br />
Class name Area [ha] Percentage [% ]<br />
Unclassified 0.96 0.689<br />
Shadow 14.36 10.314<br />
Vegetation 61.96 44.505<br />
<strong>Soil</strong> 58.60 42.091<br />
Built up area 3.34 2.399<br />
Total 139.22 100<br />
In table 2 the areas per class can be seen. Vegetation <strong>and</strong> soil together cover more than 86 % of the<br />
investigation area. Built up areas like the St. Kevin Hills Voi <strong>and</strong> other houses cover around 2.4 % of<br />
Hotspot 2. The total area covers 139.22 ha.<br />
7