Soil Erosion and Flood Risk Management
Soil Erosion and Flood Risk Management
Soil Erosion and Flood Risk Management
Create successful ePaper yourself
Turn your PDF publications into a flip-book with our unique Google optimized e-Paper software.
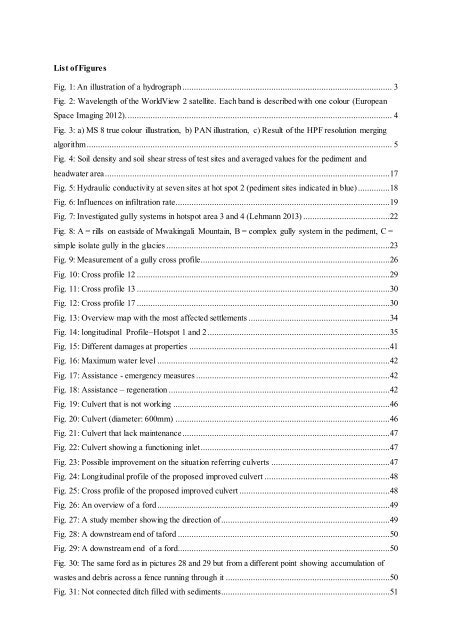
List of Figures<br />
Fig. 1: An illustration of a hydrograph ............................................................................................ 3<br />
Fig. 2: Wavelength of the WorldView 2 satellite. Each b<strong>and</strong> is described with one colour (European<br />
Space Imaging 2012). .................................................................................................................... 4<br />
Fig. 3: a) MS 8 true colour illustration, b) PAN illustration, c) Result of the HPF resolution merging<br />
algorithm ...................................................................................................................................... 5<br />
Fig. 4: <strong>Soil</strong> density <strong>and</strong> soil shear stress of test sites <strong>and</strong> averaged values for the pediment <strong>and</strong><br />
headwater area .............................................................................................................................17<br />
Fig. 5: Hydraulic conductivity at seven sites at hot spot 2 (pediment sites indicated in blue) ..............18<br />
Fig. 6: Influences on infiltration rate..............................................................................................19<br />
Fig. 7: Investigated gully systems in hotspot area 3 <strong>and</strong> 4 (Lehmann 2013) ......................................22<br />
Fig. 8: A = rills on eastside of Mwakingali Mountain, B = complex gully system in the pediment, C =<br />
simple isolate gully in the glacies ..................................................................................................23<br />
Fig. 9: Measurement of a gully cross profile...................................................................................26<br />
Fig. 10: Cross profile 12 ...............................................................................................................29<br />
Fig. 11: Cross profile 13 ...............................................................................................................30<br />
Fig. 12: Cross profile 17 ...............................................................................................................30<br />
Fig. 13: Overview map with the most affected settlements ..............................................................34<br />
Fig. 14: longitudinal Profile–Hotspot 1 <strong>and</strong> 2 ................................................................................35<br />
Fig. 15: Different damages at properties ........................................................................................41<br />
Fig. 16: Maximum water level ......................................................................................................42<br />
Fig. 17: Assistance - emergency measures .....................................................................................42<br />
Fig. 18: Assistance – regeneration .................................................................................................42<br />
Fig. 19: Culvert that is not working ...............................................................................................46<br />
Fig. 20: Culvert (diameter: 600mm) ..............................................................................................46<br />
Fig. 21: Culvert that lack maintenance ...........................................................................................47<br />
Fig. 22: Culvert showing a functioning inlet...................................................................................47<br />
Fig. 23: Possible improvement on the situation referring culverts ....................................................47<br />
Fig. 24: Longitudinal profile of the proposed improved culvert .......................................................48<br />
Fig. 25: Cross profile of the proposed improved culvert ..................................................................48<br />
Fig. 26: An overview of a ford ......................................................................................................49<br />
Fig. 27: A study member showing the direction of..........................................................................49<br />
Fig. 28: A downstream end of taford .............................................................................................50<br />
Fig. 29: A downstream end of a ford.............................................................................................50<br />
Fig. 30: The same ford as in pictures 28 <strong>and</strong> 29 but from a different point showing accumulation of<br />
wastes <strong>and</strong> debris across a fence running through it ........................................................................50<br />
Fig. 31: Not connected ditch filled with sediments..........................................................................51


