Soil Erosion and Flood Risk Management
Soil Erosion and Flood Risk Management
Soil Erosion and Flood Risk Management

You also want an ePaper? Increase the reach of your titles
YUMPU automatically turns print PDFs into web optimized ePapers that Google loves.
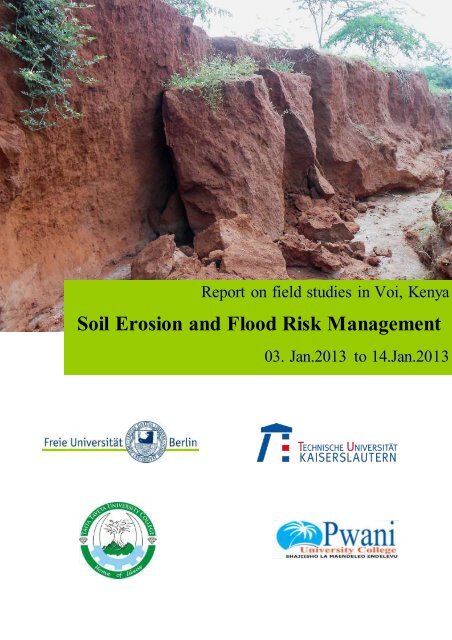
Report on field studies in Voi, Kenya<br />
<strong>Soil</strong> <strong>Erosion</strong> <strong>and</strong> <strong>Flood</strong> <strong>Risk</strong> <strong>Management</strong><br />
03. Jan.2013 to 14.Jan.2013
„Integrated soil erosion <strong>and</strong> flood risk management in Voi, Kenya“<br />
a short term student project in January 2013<br />
Undertaken by teams from the Freie Universitaet Berlin (Germany), University of Kaiserslautern<br />
(Germany), Taita Taveta University College (Voi, Kenya) <strong>and</strong> Pwani University College (Kilifi,<br />
Kenya)<br />
Research Instructors <strong>and</strong> Assistants<br />
Freie Universitaet Berlin<br />
Prof. Dr. Achim Schulte, Dipl.-Geogr. Jens Boelscher, Robert Arendt,<br />
Institute of Geographical Sciences, Applied Geography – Environmental Hydrology <strong>and</strong><br />
Resource <strong>Management</strong><br />
Malteserstrasse 74-100, 12249 Berlin, Germany, achim.schulte@fu-berlin.de<br />
University of Kaiserslautern<br />
Prof. Dr. Robert Juepner, Dr. Dorothea Gintz<br />
Civil Engineering, Hydraulic Engineering <strong>and</strong> Water <strong>Management</strong><br />
Paul-Ehrlich-Strasse 14, 67663 Kaiserslautern, Germany, robert.juepner@bauing.uni-kl.de<br />
Taita Taveta University College<br />
Prof. Hamadi Iddi Boga, Dr. Kiptanui J.A. Too, Mr. Habib Mruttu, Mr. Joel Wanina Daniel Ochieng,<br />
Dr. Bernard Kipsang Rop<br />
P.O Box 635-80300 Voi, Kenya, principal@ttuc.ac.ke<br />
Pwani University Collage<br />
Dr. Okeyo Benards, P.O Box 195-80108 Kilifi, Kenya, okeyob@yahoo.com<br />
Participants<br />
Freie Universitaet Berlin<br />
Aline Girard<br />
Christoph Raab<br />
Kevin Sieger<br />
Steffen Lehmann<br />
Taita Taveta University College<br />
Ann Nyabuto<br />
Hiram Maina W.<br />
Ian Krop<br />
Joyce Konga<br />
Justus Kimeu<br />
University of Kaiserslautern<br />
Anne Spies<br />
Ayhan Çelebi<br />
Florian Sedlmeier<br />
Michael Eiden<br />
Sergej Friedel<br />
Timo Dilly<br />
Timo Rauch<br />
Pwani University College<br />
Angela Wairimu<br />
Sheila W. Mumbi<br />
Description of the cover<br />
Photo: Gully erosion in the periphery of Voi, Kenya / Source: ARENDT 2013
Acknowledgement<br />
The student field work was originated by an initiative by Prof. Dr. Robert Juepner (University of<br />
Kaiserslautern) <strong>and</strong> Prof. Dr. Achim Schulte (Freie Universitaet Berlin) <strong>and</strong> has his roots in the<br />
DAAD-Alumini-conference titled “Capacity Development for the County Governments in the New<br />
Constitutional Dispensation in Kenya” in November 2011.<br />
Just one year later our common dream becomes reality: two German <strong>and</strong> two Kenyan Universities are<br />
undertaking a common student research project to contribute to the challenges the municipality<br />
council of Voi is faced with – soil erosion <strong>and</strong> flood risk management.<br />
After some month of intensive preparation in Germany, the field work took place in January 2013<br />
undertaken by eight joint German-Kenyan student research teams. This report contents the results of<br />
our efforts.<br />
We are all very grateful for this opportunity <strong>and</strong> have learned a lot during the days we spent in Voi.<br />
Our acknowledgements are especially dedicated to<br />
- Freie Universitaet Berlin – funding via PROMOS<br />
- University of Kaiserslautern – funding via PROMOS<br />
- Alumni-Association – Department of Civil Engineering at University of Kaiserslautern<br />
- Department of Earth Sciences, Freie Universitaet Berlin<br />
- Institute for Hydraulic Engineering <strong>and</strong> Water <strong>Management</strong> at University of Kaiserslautern<br />
- Municipality Council of Voi, His Worship the Mayor, Chancellor Thomas K. Mwatela<br />
- Taita County<br />
- Taita Taveta University College<br />
- Pwani University<br />
- Meteorological Service Voi<br />
- Kenya Wildlife Service<br />
- DAAD – German Academic Exchange Service (regional office Nairobi – Christoph Hansert)
Table of Contents<br />
List of Figures<br />
List of Tables<br />
List of Maps<br />
1 Introduction ....................................................................................................................... 1<br />
2 Framework......................................................................................................................... 2<br />
3 Objectives ........................................................................................................................... 2<br />
4 Research topics .................................................................................................................. 4<br />
4.1 L<strong>and</strong> use ....................................................................................................................... 4<br />
4.1.1 Introduction ............................................................................................................ 4<br />
4.1.2 Research questions .................................................................................................. 4<br />
4.1.3 Methodology .......................................................................................................... 4<br />
4.1.4 Results ................................................................................................................... 7<br />
4.1.5 Discussion .............................................................................................................14<br />
4.2 Physical <strong>Soil</strong> Characteristics....................................................................................... 15<br />
4.2.1 Introduction ...........................................................................................................15<br />
4.2.2 Research questions .................................................................................................15<br />
4.2.3 Methodology .........................................................................................................15<br />
4.2.4 Results ..................................................................................................................16<br />
4.2.5 Discussion .............................................................................................................18<br />
4.3 Local Gully System ..................................................................................................... 20<br />
4.3.1 Introduction ...........................................................................................................20<br />
4.3.2 Research Questions ................................................................................................20<br />
4.3.3 Methods ................................................................................................................20<br />
4.3.4 Results ..................................................................................................................22<br />
4.3.5 Discussion .............................................................................................................23<br />
4.4 Gully Investigation ..................................................................................................... 26<br />
4.4.1 Research questions .................................................................................................26<br />
4.4.2 Methodology .........................................................................................................26<br />
4.4.3 Results ..................................................................................................................27<br />
4.4.4 Discussion .............................................................................................................30<br />
4.5 <strong>Flood</strong> Water <strong>Risk</strong> & <strong>Management</strong> .............................................................................. 32<br />
4.5.1 Research Questions ................................................................................................32<br />
4.5.2 Methodology .........................................................................................................32<br />
4.5.3 Results ..................................................................................................................32
4.5.4 Discussion .............................................................................................................42<br />
4.6 Roads <strong>and</strong> buildings ................................................................................................... 44<br />
4.6.1 Research questions .................................................................................................44<br />
4.6.2 Methodology .........................................................................................................44<br />
4.6.3 Results ..................................................................................................................45<br />
4.6.4 Discussion of the results .........................................................................................59<br />
4.6.5 Recommendations ..................................................................................................59<br />
4.7 <strong>Flood</strong>water Harvesting ............................................................................................... 60<br />
4.7.1 Research questions .................................................................................................60<br />
4.7.2 Methodology .........................................................................................................60<br />
4.7.3 Results ..................................................................................................................61<br />
4.7.4 Discussion .............................................................................................................66<br />
5 Discussion of the Results................................................................................................. 67<br />
6 Recommendations ........................................................................................................... 67<br />
7 Outlook ............................................................................................................................. 68<br />
Appendix ................................................................................................................................. 69
List of Figures<br />
Fig. 1: An illustration of a hydrograph ............................................................................................ 3<br />
Fig. 2: Wavelength of the WorldView 2 satellite. Each b<strong>and</strong> is described with one colour (European<br />
Space Imaging 2012). .................................................................................................................... 4<br />
Fig. 3: a) MS 8 true colour illustration, b) PAN illustration, c) Result of the HPF resolution merging<br />
algorithm ...................................................................................................................................... 5<br />
Fig. 4: <strong>Soil</strong> density <strong>and</strong> soil shear stress of test sites <strong>and</strong> averaged values for the pediment <strong>and</strong><br />
headwater area .............................................................................................................................17<br />
Fig. 5: Hydraulic conductivity at seven sites at hot spot 2 (pediment sites indicated in blue) ..............18<br />
Fig. 6: Influences on infiltration rate..............................................................................................19<br />
Fig. 7: Investigated gully systems in hotspot area 3 <strong>and</strong> 4 (Lehmann 2013) ......................................22<br />
Fig. 8: A = rills on eastside of Mwakingali Mountain, B = complex gully system in the pediment, C =<br />
simple isolate gully in the glacies ..................................................................................................23<br />
Fig. 9: Measurement of a gully cross profile...................................................................................26<br />
Fig. 10: Cross profile 12 ...............................................................................................................29<br />
Fig. 11: Cross profile 13 ...............................................................................................................30<br />
Fig. 12: Cross profile 17 ...............................................................................................................30<br />
Fig. 13: Overview map with the most affected settlements ..............................................................34<br />
Fig. 14: longitudinal Profile–Hotspot 1 <strong>and</strong> 2 ................................................................................35<br />
Fig. 15: Different damages at properties ........................................................................................41<br />
Fig. 16: Maximum water level ......................................................................................................42<br />
Fig. 17: Assistance - emergency measures .....................................................................................42<br />
Fig. 18: Assistance – regeneration .................................................................................................42<br />
Fig. 19: Culvert that is not working ...............................................................................................46<br />
Fig. 20: Culvert (diameter: 600mm) ..............................................................................................46<br />
Fig. 21: Culvert that lack maintenance ...........................................................................................47<br />
Fig. 22: Culvert showing a functioning inlet...................................................................................47<br />
Fig. 23: Possible improvement on the situation referring culverts ....................................................47<br />
Fig. 24: Longitudinal profile of the proposed improved culvert .......................................................48<br />
Fig. 25: Cross profile of the proposed improved culvert ..................................................................48<br />
Fig. 26: An overview of a ford ......................................................................................................49<br />
Fig. 27: A study member showing the direction of..........................................................................49<br />
Fig. 28: A downstream end of taford .............................................................................................50<br />
Fig. 29: A downstream end of a ford.............................................................................................50<br />
Fig. 30: The same ford as in pictures 28 <strong>and</strong> 29 but from a different point showing accumulation of<br />
wastes <strong>and</strong> debris across a fence running through it ........................................................................50<br />
Fig. 31: Not connected ditch filled with sediments..........................................................................51
Fig. 32: Ditch filled up with debris ................................................................................................51<br />
Fig. 33: A functional ditch ............................................................................................................52<br />
Fig. 34: Dyke made of s<strong>and</strong>bags....................................................................................................52<br />
Fig. 35: Dyke made of s<strong>and</strong>bags....................................................................................................53<br />
Fig. 36: Backside of a fence ..........................................................................................................53<br />
Fig. 37: Fence made of sticks ........................................................................................................54<br />
Fig. 38: Wall at the St. Kevin Hill Primary School .........................................................................54<br />
Fig. 39: Closure out of bricks in front of a door ..............................................................................55<br />
Fig. 40: Closure made of different materials...................................................................................56<br />
Fig. 41: Single store building out of bricks .....................................................................................57<br />
Fig. 42: Muddy house...................................................................................................................58<br />
Fig. 43: Multi-storey building .......................................................................................................58<br />
Fig. 44: Petrol station (Source: ARENDT 2013).............................................................................59<br />
Fig. 45: Study area 1 (www.earth.google.com, edited) ....................................................................61<br />
Fig. 46: Proposed area 2 ...............................................................................................................62<br />
Fig. 47: Proposed area ..................................................................................................................62<br />
Fig. 48: Study area 2 (www.earth.google.com, edited) ....................................................................63<br />
Fig. 49: Tranches .........................................................................................................................64<br />
Fig. 50: Proposed terracing, 2013 ..................................................................................................64<br />
Fig. 51: Study area 3 (www.earth.google.com, edited) ....................................................................65<br />
Fig. 52: Rainwater harvesting........................................................................................................66<br />
Fig. 53: Dams for irrigation ..........................................................................................................66
List of Tables<br />
Tab. 1: Ground truth sheet S.5<br />
Tab. 2: The proportion of classes in ha <strong>and</strong> the percentage S.7<br />
Tab. 3: The proportion of classes in ha <strong>and</strong> the percentage S.11<br />
Tab. 4: Class description <strong>and</strong> photos S.12<br />
Tab. 5: Overview of the taken soil samples from the headwater area <strong>and</strong> pediment S.16<br />
Tab. 6: Local prices for water tanks in Voi 2013 S.62
List of Maps<br />
Map 1: Digitalised streets in the investigation area Hotspot 2 S.6<br />
Map 2: Screenshot from the result of the Unsupervised Classification with 12 classes,<br />
a maximum of 60 ISODATA-algorithm iterations <strong>and</strong> a convergence threshold of 0.9 S.8<br />
Map 3: Supervised classification of Hotspot area 2 S.10<br />
Map 4 : L<strong>and</strong> use forms in the Hotspot area 2 S.13<br />
Map 5: showing samples taken in hot spot area 2 S.16<br />
Map 6: Data Collection during field work (Hotspot 3 <strong>and</strong> 4) S.24<br />
Map 7: Digital Elevation Model (Hotspot 3 <strong>and</strong> 4) S.25<br />
Map 8: GPS points along the gully marking the structure <strong>and</strong> points of cross profiles S.28<br />
Map 9: Flow direction Hot spot 1 S.36<br />
Map 10: Flow direction Hotspot 2 S.37<br />
Map 11: Research Points - Hotspot 2 S.39<br />
Map 12: Research points – Hotspot 1 S.40<br />
Map 13: Hotspots of Voi S.70
1 Introduction<br />
The Consolidated Plan of Action for Africa´s Science <strong>and</strong> Technology (CPA), (NEPAD, 2006) <strong>and</strong> also the<br />
Kenyan national water resources management strategy (NWRMS) (Ministry of Water <strong>and</strong> Irrigation, 2011)<br />
point out that the supply <strong>and</strong> availability of water is one bottleneck for the economic <strong>and</strong> social development<br />
not only for Kenya but for all sub-Saharan countries. "Kenya´s economy being mainly natural resource-<br />
based is highly vulnerable to climate change <strong>and</strong> variability. The economy has recently suffered from climate<br />
chan e related disasters hich include drou hts 2000 2001 200 floods <strong>and</strong> mudslides 1 200<br />
2010 . ... he costs of the 1 <strong>and</strong> 2000 l Ni o-related floods <strong>and</strong> La Ni a related drought respectively<br />
cost the country about 15% of GDP (USD 867 per capita 2010) for three consecutive years (Ministry of<br />
Water <strong>and</strong> Irrigation, 2011)." Both the surplus on water during rainy seasons <strong>and</strong> the lack of water during the<br />
dry periods include also the problems of soil erosion, desertification, migration <strong>and</strong> water related diseases<br />
(CPA) (NEPAD, 2006). All these problems are well-known but remain unresolved <strong>and</strong> continue to increase<br />
the vulnerability of the whole society. The water related problems in Kenya must be solved at different<br />
political levels <strong>and</strong> by a common <strong>and</strong> practical approach of different disciplines to develop a long-term<br />
perspective for the local communities <strong>and</strong> their economy.<br />
Voi city in the upper Voi river catchment in southern Kenya is regarded as a typical example facing several<br />
of the mentioned problems. The hydrological scenario of this area is characterized by a semi-arid climate<br />
with pronounced rainy <strong>and</strong> dry seasons during the year but mostly during the heavy rains of March – July,<br />
when precipitation is of highest intensity. The area is also characterized by soils of low water infiltration<br />
resulting into surface runoff, storm water floods <strong>and</strong> different types of soil erosion (<strong>and</strong> accumulation in<br />
places).<br />
In the short rainy season of november <strong>and</strong> december 2011 the area experienced intensive rainfall events with<br />
disastrous flooding <strong>and</strong> serious erosion problems in different spatial scales (sheet <strong>and</strong> rill erosion up to<br />
severe gully erosion). Further, severe communication <strong>and</strong> transport infrastructure damage was experienced<br />
including the washing way of several infrastructures such as schools like St. Kevin School <strong>and</strong> a number of<br />
residential houses.<br />
Voi Municipality area is also affected by the incision of the Voi River channel <strong>and</strong> its several tributaries<br />
passing through the town <strong>and</strong> draining it in form of gullies. The efforts of the Voi Municipality to reduce the<br />
damages are limited by the unclear hydrological <strong>and</strong> morphological processes as well as lack of adequate<br />
flood risk management strategies.<br />
In order to improve the situation, this study proposed three key objectives: 1. to describe <strong>and</strong> localize the<br />
hydrological <strong>and</strong> morphological processes, 2. to underst<strong>and</strong> strategies employed by the local communities in<br />
1
coping with the flood risk menace <strong>and</strong> 3. to suggest appropriate additional engineering measures easily<br />
adoptable to the local scenario.<br />
2 Framework<br />
Water related problems are usually based on complex natural processes. Moreover, the climatic conditions in<br />
Kenya cannot be changed although there exists a possibility to create risk awareness <strong>and</strong> lower the<br />
vulnerability in terms of risk management both at the regional <strong>and</strong> local level. The precondition for such a<br />
successful <strong>and</strong> sustainable approach is at least a holistic underst<strong>and</strong>ing of the man-environmental-system<br />
under Kenyan boundary-conditions. This interdisciplinary investigation proposed a two throng approach; on<br />
one h<strong>and</strong> the need to describe the hydrology <strong>and</strong> geomorphology of the area in order to underst<strong>and</strong> the<br />
aspects of sediment <strong>and</strong> water transport <strong>and</strong> other conditions that influence the hydrograph. On the other<br />
h<strong>and</strong>, it is necessary to design or rather recommend appropriate engineering measures that could be<br />
employed to cope with the situation. These engineering solutions had to be tailored to withst<strong>and</strong> the unique<br />
situations of the river Voi upper catchment, manageable by the stakeholders especially the Voi Municipal<br />
Council <strong>and</strong> able to deliver adequate services to the users. From several discussions <strong>and</strong> from engineering<br />
hindsight, the solutions need to be two-fold:<br />
1) those that could be employed to retain the amount of water which contributes to a flood hydrograph or<br />
flood wave (water harvesting, enhanced ground water retention <strong>and</strong> infiltration) <strong>and</strong> control soil erosion <strong>and</strong><br />
sediment transport<br />
2) those that could ensure non-hazardous transport of sediment <strong>and</strong> water from the origin (headwater areas)<br />
to the Voi river.<br />
But it is very necessary to emphasis that the Voi municipality lacks of a holistic plan for community<br />
development especially focusing on urban drainage <strong>and</strong> flood risk management (Master plan). The short term<br />
student project in January 2013 is not able to fill this gap but wants to contribute to the overall approach<br />
undertaken by the Mayor of Voi related to the recent flood <strong>and</strong> erosion problems.<br />
3 Objectives<br />
From the perspective of a soil-, sediment- <strong>and</strong> flood management; two main questions emerge:<br />
1) What influences the conditions in the catchment hydro raph?”<br />
2) What interventions can be undertaken to cope ith the situation?”<br />
These questions could best be answered through an interdisciplinary work of the disciplines of<br />
geomorphology, hydrology, ecology, civil engineering <strong>and</strong> social science.<br />
To describe the problem from the hydrological point of view see fig.1.<br />
2
Discharge in<br />
cm3 Discharge [m³/s]<br />
/sec<br />
Q max<br />
Q t<br />
The Problem<br />
The Problem illustrated in Figure 1 is based on the fact, that most of the existing drainage channels <strong>and</strong><br />
gullies are able to transport more than a certain discharge Qt without inundating the surrounding area. If the<br />
discharge overtops this threshold <strong>and</strong> reaches a peak discharge Q max, all resulting discharge (Qmax – Qt) is<br />
exceeding the drainage capacity of the transport channel <strong>and</strong> leads to flood water which cause inundation<br />
within the city.<br />
Fig. 1: An illustration of a hydrograph<br />
In order to adequately study the erosion <strong>and</strong> flood water processes <strong>and</strong> find appropriate solutions to the<br />
above research questions, the study team of 26 persons was subdivided into different groups. Each group had<br />
a specific research objective <strong>and</strong> members worked as a team both in the field as well as in generating a group<br />
report. Besides, each group gave a short presentation of their work after every two days. Below, is the<br />
summary of each group listed in chapter four.<br />
Time<br />
3
4 Research topics<br />
4.1 L<strong>and</strong> use<br />
Author: Christoph Raab<br />
4.1.1 Introduction<br />
The main topic of this research concerns the estimation of l<strong>and</strong> use types derived from remote sensing <strong>and</strong><br />
field data. For this topic, high resolution satellite images were used to derive the necessary information. The<br />
ground truth data are collected to validate the derived l<strong>and</strong> use classes like different types of vegetation or<br />
settlements. These data are produced for a subset area (Hotspot 2, location on map in the appendix). This<br />
data will be used to analyse the current status of l<strong>and</strong> use in the Voi community with special regard to soil<br />
erosion <strong>and</strong> flood risk management.<br />
4.1.2 Research questions<br />
he main topic of the research is ‘L<strong>and</strong> use in the upper catchment of the Voi River, Kenya from Remote<br />
Sensin <strong>and</strong> field data’. From these following questions arise:<br />
- Which types of l<strong>and</strong> use can be classified using high resolution satellite data?<br />
- Which types of l<strong>and</strong> use can be derived during the field work to validate the remote sensing data?<br />
4.1.3 Methodology<br />
To answer the mentioned questions, it is necessary to get appropriate satellite data. For this reason, high<br />
resolution satellite data were acquired in December 2012 with the following characteristics (figure2):<br />
WorldView2 satellite image – 01.23.2012<br />
- Multispectral 8 b<strong>and</strong>s (MS 8) with a resolution of 2 m per pixel of each b<strong>and</strong><br />
- Panchromatic b<strong>and</strong> (PAN) with a resolution of 0.5 m per pixel<br />
Fig. 2: Wavelength of the WorldView 2 satellite. Each b<strong>and</strong> is described with one colour (European Space Imaging<br />
2012).<br />
The area for investigation was calculated by Steffen Lehmann <strong>and</strong> has a spatial extension of approximately<br />
40 km². The delivered data are radiometric pre-processed but not orthorectified. This makes a rectification<br />
necessary <strong>and</strong> an atmospheric correction obsolete. All pre-processing steps were calculated with the software<br />
ERDAS IMAGINE 9.1.<br />
For better visual image interpretation, some image enhancement tools from ERDAS IMAGIN 9.1 can be<br />
used. For example, the resolution merging of the MS 8 <strong>and</strong> PAN image is an appropriate tool to use the<br />
benefits of both scenes for better visual image interpretation. Figure 3 shows the raw data <strong>and</strong> the result of<br />
4
the resolution merging using the HPF Resolution Merging algorithm implemented in ERDAS IMAGINE 9.1<br />
for a subset (Hotspot 2) area.<br />
Fig. 3: a) MS 8 true colour illustration, b) PAN illustration, c) Result of the HPF resolution merging algorithm<br />
Additionally, there are a lot of different methods for image enhancement. These include principal component<br />
analyses <strong>and</strong> spatial feature manipulation or contrast manipulations which are not described here.<br />
The next steps of digital satellite image processing are the rationing <strong>and</strong> classification methods. To get a first<br />
impression of the mathematical separability of the spectral information, the ISODATA-algorithm is used for<br />
an unsupervised classification. The ISODATA-algorithm uses the spectral information of each b<strong>and</strong> for<br />
clustering by applying the minimum distance method. After n-iterations - given by the processer - <strong>and</strong> a<br />
predefined convergence threshold, an unsupervised classification is calculated.<br />
Using the knowledge of the results given by the unsupervised classification, the supervised classification can<br />
be processed. A predefined spectrum of classes must be characterised by an appropriate count of AOIs (Area<br />
Of Interest). The AOIs are created by the operator <strong>and</strong> as possible the spatial distribution must be consistent.<br />
The characteristic spectral informations for each class - extracted from the satellite image by the AOIs - are<br />
subsequently used for the supervised classification.<br />
Tab. 1: Ground truth sheet<br />
Project Height<br />
Date, Time Waypoint #<br />
Name of point L<strong>and</strong> use<br />
Photo # L<strong>and</strong> cover<br />
Coordinate<br />
system<br />
Ground cover<br />
Coordinates Remarks<br />
5
Map 1: Digitalised streets in the investigation area Hotspot 2<br />
6
For the field work it is recommended to use ground truth sheets, which can be seen in table 1. The main<br />
streets were digitalised from the WorldView2 satellite image using ArcGIS 9.3 for mapping the l<strong>and</strong> use in<br />
the investigation area (Map 1). It is important to note that the field work took place January, 7th <strong>and</strong> 8th<br />
2013 <strong>and</strong> the satellite image was taken January, 23 rd 2012. Differences between the vegetation cover may<br />
occur.<br />
Furthermore a subset of the investigation area was created from the satellite image. This is useful to mark<br />
ground truth information like GPS points. For more details, information photos were taken during the field<br />
work from the areas around the GPS points <strong>and</strong> other regions.<br />
The collected ground truth data are digitalised using the software ArcGIS 9.3.<br />
4.1.4 Results<br />
The results represent the calculated <strong>and</strong> collected data from Hotspot 2. First, the unsupervised <strong>and</strong> supervised<br />
classification is analysed. Subsequently, the ground truth data are digitalised to create a l<strong>and</strong> use map.<br />
Unsupervised classification derived from satellite data<br />
The first result created is the unsupervised classification which can be seen in Map 2. The ISODATA-<br />
algorithm calculated the maximum likelihood attached to all pixels. Two different classes of built up areas<br />
are possible to derive. Two classes of shadow were calculated as well. Furthermore, four different classes of<br />
vegetation <strong>and</strong> three types of different soils were derived.<br />
Tab. 2: The proportion of classes in ha <strong>and</strong> the percentage<br />
Class name Area [ha] Percentage [% ]<br />
Unclassified 0.96 0.689<br />
Shadow 14.36 10.314<br />
Vegetation 61.96 44.505<br />
<strong>Soil</strong> 58.60 42.091<br />
Built up area 3.34 2.399<br />
Total 139.22 100<br />
In table 2 the areas per class can be seen. Vegetation <strong>and</strong> soil together cover more than 86 % of the<br />
investigation area. Built up areas like the St. Kevin Hills Voi <strong>and</strong> other houses cover around 2.4 % of<br />
Hotspot 2. The total area covers 139.22 ha.<br />
7
Map 2: Screenshot from the result of the Unsupervised Classification with 12 classes, a maximum of 60 ISODATA-algorithm iterations <strong>and</strong> a convergence threshold of 0.9.<br />
8
Supervised classification derived from satellite data<br />
The supervised classification was processed for the whole investigation area around Voi. The Map 3 presents<br />
the results for the hotspot area 2 with 18 different classes. In general built up area 4 is good to separate with a<br />
minimum amount of mixtures with other classes. In comparison to build up area 2 a lot of other structures<br />
were classified as built up areas when they aren´t vegetation, especially trees are good to separate <strong>and</strong> the<br />
distribution seems natural. The sisal class covers a lot of the investigation area. Also the river class occurs on<br />
the hill. A lot of areas are classified as agriculture barren. Barren l<strong>and</strong> occurs in the North East <strong>and</strong> in parts of<br />
the built up areas<br />
9
Map 3: Supervised classification of Hotspot area 2<br />
10
In Table 3 the areas of the different classes can be seen. For the built up area class an area of 17.1 ha is<br />
calculated. The river class occurs with 7.5 ha <strong>and</strong> a shadow class with 5.6 ha. Barren l<strong>and</strong> only covers 0.03<br />
ha <strong>and</strong> agriculture barren class covers 38 ha. Sisal class is classified for an area of 21 ha <strong>and</strong> a percentage of<br />
around 15 %. The total area of interest covers 139.22 ha.<br />
Tab.3: The proportion of classes in ha <strong>and</strong> the percentage<br />
Class name Area [Ha] Percentage [% ]<br />
Forest 12.8 9.194<br />
Grass l<strong>and</strong> 10 7.182<br />
Barren l<strong>and</strong> 0.03 0.021<br />
Rock 3.1 2.226<br />
Built up area 17.1 12.282<br />
S<strong>and</strong> road 2.7 1.939<br />
Earth road 9.4 6.751<br />
Agriculture vegetated 11.6 8.332<br />
Agriculture barren 38 28.294<br />
Shadow 5.6 4.022<br />
River 7.5 5.387<br />
Tarmac road 0.3 0.215<br />
Sisal 21 15.084<br />
Total 139.22 100<br />
L<strong>and</strong> use map derived from ground truth<br />
The Hotspot area 2 can be classified into three main classes as per the already collected ground truth data.<br />
Tab. 4 summarises the class with photos <strong>and</strong> a short description.<br />
he class ‘built up area’ describes public buildin s <strong>and</strong> areas like St. Kevin Hills Voi ithout a riculture.<br />
he class ‘meado ith sin le trees <strong>and</strong> bushes’ dominates the hill ithin some scattered parts of the class<br />
‘small scale farmin ith lo buildin density’. Also in the ast a lar e area of ‘meado ith sin le trees<br />
<strong>and</strong> bushes’ takes place. In both areas pastoral usage was observed. The agricultural activities in the class<br />
‘small scale farmin ith lo buildin density’ is dominated by maize <strong>and</strong> beans. In general a big part of<br />
this class is covered by grassl<strong>and</strong> <strong>and</strong> single trees. Also barren l<strong>and</strong> was observed in many areas. The first<br />
results are summarised in Map 4.<br />
11
Tab. 4: Class description <strong>and</strong> photos<br />
Photos from classes Classes <strong>and</strong> description<br />
built up area<br />
Man made structures, public buildings,<br />
soccer fields, among others.<br />
No agricultural activities.<br />
Left: St. Kevin Hills, Voi<br />
Right: Tsavo Lodge<br />
small scale farming with low building<br />
density<br />
Small scale farming, dominated by<br />
maize <strong>and</strong> beans.<br />
Low building density<br />
Pastoral usage observed<br />
Single trees like Acacias<br />
Bushes<br />
Grassl<strong>and</strong><br />
meadow with single trees <strong>and</strong> bushes<br />
Meadow<br />
Single trees like Acacias<br />
Thicket<br />
Bushes<br />
Pastoral usage observed<br />
Some small scattered holders<br />
Rock<br />
12
Map 4 : L<strong>and</strong> use forms in the Hotspot area 2<br />
13
4.1.5 Discussion<br />
The results given by the unsupervised classification describe the area as a soil (~42 %) <strong>and</strong> vegetation (~44<br />
%) dominated area. In comparison to the satellite image <strong>and</strong> the supervised classification the built up areas<br />
(2.4 %) seems to be under-estimated.<br />
More critical the supervised classification has to be discussed. The ground truth data does not support the 15<br />
% of sisal class, because minimal sisal was found in this area. S<strong>and</strong> roads <strong>and</strong> deposition zones show similar<br />
characteristics, so that deposition zones are classified as s<strong>and</strong> roads. The river class is estimated to have a<br />
proportion of about 5 %. This value cannot be correct since no structures like a river with water were found<br />
during the ground truthing. It seems that the river class has similar characteristics to shadow class. This<br />
explains the reason for its high over-estimation. An equal problem can be noticed between the classes<br />
‘a riculture barren’ <strong>and</strong> ‘barren l<strong>and</strong>’. It might be better to put these classes together in one class or separate<br />
it more precise against the AOIs. It seems that on one h<strong>and</strong> classes like tarmac road, forest <strong>and</strong> rock are<br />
appropriate <strong>and</strong> on the other h<strong>and</strong> classes like agriculture barren, barren l<strong>and</strong>, shadow <strong>and</strong> river must be<br />
changed.<br />
The ground truth information delivers an appropriate result to check the classifications. The created l<strong>and</strong> use<br />
map gives an overview over the main l<strong>and</strong> use <strong>and</strong> l<strong>and</strong> cover manifestations.<br />
A solution to estimate the right proportion of sisal class can be the masking of the Voi Sisal plantations. This<br />
would be possible because of the clear structures. It is recommended to reclassify the supervised<br />
classification with changed classes <strong>and</strong> give an accuracy assessment. Furthermore, for every l<strong>and</strong> use class<br />
an example should be described with a higher spatial resolution.<br />
Sources<br />
European Space Imaging (2012): World View 2. http://www.euspaceimaging.com/products/67/ (05.12.2012)<br />
14
4.2 Physical <strong>Soil</strong> Characteristics<br />
Authors: Kevin Sieger Angela, Wairimu<br />
4.2.1 Introduction<br />
<strong>Soil</strong> erosion, the formation of gullies <strong>and</strong> the related sediment transport <strong>and</strong> floods can cause serious<br />
damages to infrastructure, buildings <strong>and</strong> risks for the daily lives of the people who live nearby or downhill.<br />
Causes for formation of the gullies <strong>and</strong> the soil erosion in this region are partly known <strong>and</strong> almost no<br />
research at the Voi municipality was undertaken up till now. Therefore the mitigation of gully formation <strong>and</strong><br />
soil erosion needs a better knowledge of local soil physical properties (shear stress, soil density, hydraulic<br />
conductivity, soil texture). The headwater areas of the catchments are of main interest. The surroundings of<br />
the Mwakingali hills (Hotspot zone 2) were selected for the first survey with help of satellite images <strong>and</strong><br />
maps provided by Lehmann <strong>and</strong> Raab 2013 from Freie Universitaet Berlin.<br />
4.2.2 Research questions<br />
Three questions are formulated before field investigation:<br />
1. Which hydraulic conductivity can be expected in the selected headwater area?<br />
2. What are the maximum shear stress <strong>and</strong> density of the soil?<br />
3. How much do hydraulic conductivity depend on the given soil characteristics?<br />
4.2.3 Methodology<br />
At hotspot 2 different locations with varying soil textures <strong>and</strong> geomorphology were identified to carry out<br />
measurements. Grain sizes <strong>and</strong> soil humidity were described by finger probes. Minidisc Infiltrometer (MDI)<br />
developed by Decagon Ltd. was used to measure hydraulic conductivity. Its use of less water, quick<br />
measurement, precision <strong>and</strong> portability makes it highly efficient.<br />
<strong>Soil</strong> density of different soils at different locations in the study area was determined by exerting pressure on<br />
the soil surface using a penetrometer (penetrometer test). All locations were recorded with the GPS device<br />
<strong>and</strong> identified in the maps.<br />
<strong>Soil</strong> samples from each site were collected, put in clear polythene bags <strong>and</strong> labeled for laboratory test (grain<br />
size analysis, organic matter). Lab values will give additional information about the soil water<br />
characteristics.<br />
15
Map 5: showing samples taken in hot spot area 2<br />
4.2.4 Results<br />
Seven different locations were observed <strong>and</strong> tested. Location 002, 006, 007 <strong>and</strong> 008 were situated on the<br />
pediment layer, with sample 003-005 being located at the headwater area. The pediment <strong>and</strong> headwater area<br />
showed different behaviors in their soil characteristics <strong>and</strong> geomorphology. <strong>Soil</strong>s with loamy s<strong>and</strong>y grain<br />
size originated from the Headwater area, overlaid with some gravel.<br />
h<br />
sample number location grain size (field data) soil humidity<br />
002 Pediment loamy s<strong>and</strong> slightly humid<br />
003 Headwater<br />
Area<br />
loamy s<strong>and</strong> with some gravels slightly humid<br />
004 Headwater slightly loamy middle s<strong>and</strong> with some slightly humid<br />
Area gravel<br />
005 Headwater mainly fine s<strong>and</strong>, middle loam, with some slightly humid<br />
Area gravel<br />
006 Pediment mainly loam, some fine s<strong>and</strong> (us) dry<br />
b007 Pediment loamy s<strong>and</strong> dry<br />
008 Pediment s<strong>and</strong>, loamy s<strong>and</strong> dry<br />
16
It was noticed that the pediment layer differed from the headwater area because of the slope which decreased<br />
from the later to the former. Measured grain sizes at the pediment were much loamier <strong>and</strong> the gravel content<br />
was lacking. Most moisture measurements were taken in the morning when soils were humid in the upper<br />
soil layer while those taken in the afternoon had less humidity.<br />
Fig. 4: <strong>Soil</strong> density <strong>and</strong> soil shear stress of test sites <strong>and</strong> averaged values for the pediment <strong>and</strong> headwater area<br />
<strong>Soil</strong> density in the pediment area was measured with minimum <strong>and</strong> maximum recordings being taken at<br />
location 002 <strong>and</strong> 007 respectively. The highest shear stress was also measured at the study site 005 <strong>and</strong><br />
minimum record taken at location 002. Mean soil density <strong>and</strong> soil shear stress in the pediment was lower<br />
than that in the headwater area.<br />
17
Fig. 5: Hydraulic conductivity at seven sites at hot spot 2 (pediment sites indicated in blue)<br />
Measurements of hydraulic conductivity were taken for each study site. The lowest observed measurements<br />
were taken at study site 002 with an infiltration rate of 55,44 mm/h while the highest was at location 008.<br />
Infiltration value of location 008 was 2100 mm/h. The mean of infiltration from the pediment area was 630<br />
mm/h while that from headwater area was 67,2 mm/h.<br />
4.2.5 Discussion<br />
The area of investigation is affected by different kinds of soil erosion like gully formation, rill erosion <strong>and</strong><br />
probably sheet erosion which has a certain impact on the range of measured values. The observed soil shear<br />
stress in the headwater area was higher than expected due to high heterogeneity of the grain sizes. With the<br />
h<strong>and</strong>y shear stress aperature, only small samples could be explained. Gravel <strong>and</strong> stones in the headwater area<br />
could not be described, because of their size <strong>and</strong> therefore only the s<strong>and</strong>y materials were tested. <strong>Soil</strong> density<br />
trend for pediment <strong>and</strong> headwater area could not be observed. The pediment was overlaid by a thin layer of<br />
s<strong>and</strong>, which influenced the measurements <strong>and</strong> contributed the conclusion that some areas are affected by<br />
sheet floods as indicated in soil sample 007-008. The MDI is a very small unit, which shows an overview of<br />
infiltration rate.<br />
Figure 6 shows three very important parameters that influenced measurement. First, in areas with high soil<br />
humidity, the infiltration went low with a vertical component while very dry samples had large horizontal<br />
infiltration components. Second, grain size was a factor that influenced infiltration measurements. In areas<br />
with dry s<strong>and</strong>y grain sizes the infiltration rate was seen to increase excessively. Last but not least was the<br />
18
suction factor, which most measurements were taken with a rate of -2 cm as, recommended by the producer.<br />
It’s ho ever important to note that takin measurements of infiltration rate for s<strong>and</strong>y soil ith these suction<br />
rate is impossible.<br />
soil<br />
humidity<br />
suction rate<br />
infiltration<br />
rate<br />
Fig. 6: Influences on infiltration rate<br />
grain size<br />
The above three factors influenced the infiltration measurement of location 008. To give evidence to the<br />
suction rate more measurements should be taken. Precipitation data is needed to describe the possible highest<br />
infiltration <strong>and</strong> more data collected from other study sites to verify ones measurements.<br />
The influence of pastoralism <strong>and</strong> farming on the observed soil properties should be clarified. So it seems to<br />
be necessary to get more detailed information about the relationship between l<strong>and</strong> use types <strong>and</strong> soil<br />
properties. The field survey is still in progress thus the additional data of the forthcoming days will give a<br />
more detailed picture of the situation in the surroundings of the Voi community.<br />
19
4.3 Local Gully System<br />
Authors: Steffen Lehmann, Hiram Maina<br />
4.3.1 Introduction<br />
Gully <strong>Erosion</strong> is a serious problem for semi-arid areas in Africa, especially for l<strong>and</strong>scape in Kenya. This<br />
Research took place in the surrounding area of the settlement of Voi, which is situated along the Nairobi-<br />
Mombasa Highway. The applied methods are used in a subarea in the northeast of the settlement of Voi,<br />
where extensive gully formation has taken place at different scales <strong>and</strong> locations.<br />
4.3.2 Research Questions<br />
The issues existing of gully erosion can be described by an exact detection of the positions of the gully<br />
systems. It is necessary to know the correct location of the gullies for further analysis <strong>and</strong> research. There are<br />
different types of gullies as a result of different parameters. Many authors classified gullies systems into rills,<br />
ephemeral <strong>and</strong> bank gullies, simple isolated gullies, simple continuous <strong>and</strong> complex discontinuous gully<br />
structures <strong>and</strong> others. This classification is a result of different controlling factors.<br />
The existence of gullies depends on the topographic position, which is the most important factor contributing<br />
to the gully formation. Other controlling parameters are precipitation intensity, slope, vegetation, soil<br />
structure, l<strong>and</strong> use etc.<br />
Resulting from these aspects this research answers the following questions:<br />
1. Where are the latest gully systems located?<br />
2. What types of gullies are situated in the investigation area?<br />
3. What are the main boundary conditions, which enforce the development of gully systems?<br />
4.3.3 Methods<br />
The applied methods in this research consist of the analysis <strong>and</strong> interpretation of topographic maps, satellite<br />
images <strong>and</strong> field mapping in the investigation area by the Geographic Information System (GIS).<br />
The methods are supported by GPS-Measurement (Global Position System).<br />
Analysis <strong>and</strong> interpretation of topographic maps <strong>and</strong> satellite images:<br />
The first step for collecting data during the field work includes the analysis <strong>and</strong> interpretation of topographic<br />
maps <strong>and</strong> satellite images. The information derived from the maps <strong>and</strong> satellite images give an overview of<br />
the hotspot areas of gully erosion. High spatial resolution satellite images like World View 2 or Google Earth<br />
enable an extraction of gully structures before starting the field work. The creation of maps resulting by the<br />
analysis of topographic maps <strong>and</strong> satellite images in the GIS-Software supports the orientation during field<br />
work <strong>and</strong> shows the location of the largest gullies.<br />
20
Steps for creation of maps used for field work:<br />
1. Collection of data into the GIS<br />
2. Georeferencing of the topographic <strong>and</strong> thematic maps<br />
3. Detection <strong>and</strong> digitalization of gully systems using satellite images<br />
4. Creation of maps (topographic subarea maps including satellite data, gully structures, vegetation,<br />
soil structures etc.)<br />
The topographic maps <strong>and</strong> the GPS data provide additional information about the difference between the<br />
highest <strong>and</strong> lowest areas in the investigation area. These informations are necessary for the development of<br />
the Digital Elevation Model (DEM), which leads to a detailed statement of the slope <strong>and</strong> the watershed in the<br />
investigation area.<br />
Steps for creation of Digital Elevation Model:<br />
1. Extraction of the height information in the GIS-Software (elevation points, contours)<br />
2. Input of GPS data into GIS-Software<br />
3. Interpolation of all height resources for the model creation<br />
Field Mapping <strong>and</strong> GPS-Measurements<br />
Field mapping is a common method for collecting information with spatial reference into maps. The<br />
equipment for field mapping consists of maps <strong>and</strong> writing sets. The writing set is used for drawing the gully<br />
structures into the maps. Afterwards the data must be digitalized in the GIS-Software for the completion of<br />
data collection.<br />
Steps for Field Mapping:<br />
1. Observation of gully structures in the investigation area<br />
2. Mapping of observed gully structures<br />
3. Integration of collected data in the GIS-Software<br />
The GPS measurement supports the accuracy of the mapping <strong>and</strong> gives additional information about the<br />
geographic position <strong>and</strong> the height, which are also used for getting a higher density of elevation points. The<br />
GPS measurements relay on satellite signals. The minimum number of available satellites must be at least 3<br />
to get a GPS-Point, which can be saved on the GPS-Measurement as waypoint. After field work the<br />
elevation points must be integrated into the Digital Elevation Model.<br />
21
Steps for the use of the GPS measurements:<br />
4.3.4 Results<br />
1. Control of availability of the satellite signal (accuracy)<br />
2. Saving waypoints in the GPS measurement<br />
3. Integration of GPS points into the GIS software<br />
Location of gullies <strong>and</strong> other predominant types of erosion<br />
Most of the actual gully systems could be extracted from the satellite images before moving into the field.<br />
Only a few gullies are mapped during the field work. The GPS points show the exact position of the mapped<br />
gullies in the investigated subarea (Map 6 <strong>and</strong> 7).<br />
The majority of the gullies are situated in the Pediment where the slope is less than on the Inselbergs. Streets<br />
represent often the starting point of a gully system. All areas above the starting points are called gully heads<br />
which are usually situated at the Inselbergs. The dominating process in the gully heads is sheet <strong>and</strong> rill<br />
erosion resulting from the high level of slope <strong>and</strong> the position of bedrock close to the surface.<br />
Fig. 7: Investigated gully systems in hotspot area 3 <strong>and</strong> 4 (Lehmann 2013)<br />
22
Gullies are also located <strong>and</strong> mapped on the pediment <strong>and</strong> in the glacis, the latter marked as an area with a<br />
high accumulation of sediments (alluvial fans, Fig. 7 <strong>and</strong> Map 6).<br />
Classification of gully systems<br />
The upper areas belong to the Inselbergs <strong>and</strong> are characterized by several rills. Rills are small drainage<br />
channels which have a very parallel course in the steeper parts of the mountain. This kind of erosion is<br />
similar to a shallow gully system. There are rills in the pediment <strong>and</strong> glacis areas too. That means this type of<br />
erosion is not limited by strict slope <strong>and</strong> specific soil structures, vegetation <strong>and</strong> l<strong>and</strong> use types (Fig. 8A).<br />
The most gully systems in the investigated area correspond to complex gully systems in the pediment (Fig.<br />
8B). These gully types are characterized by a lot of smaller gullies <strong>and</strong> rills flowing into the main gully.<br />
Wide spread catchments also characterise complex gully systems (Fig 7 <strong>and</strong> 8). The area of the glacis<br />
represent often gully systems which are characterized as simple, isolated, linear structures. In general these<br />
types of gullies are very wide <strong>and</strong> deep (Fig. 8C)<br />
Fig. 8: A = rills on eastside of Mwakingali Mountain, B = complex gully system in the pediment, C = simple isolate<br />
gully in the glacies<br />
4.3.5 Discussion<br />
The combination of field mapping <strong>and</strong> interpretation of topographic maps <strong>and</strong> satellite images produce good<br />
results during the research in the northeast subarea. The accuracy of gully location depends on the skills <strong>and</strong><br />
experiences of the mapper.<br />
The GPS measurements support the exact localization of the gullies with an accuracy of 3 m which is<br />
sufficient for integrating this information into the Digital Elevation Model. For example the elevation of<br />
Mwakingali Mountain from the topographic map approximates 818 metres. The GPS measures the same<br />
elevation of 818 metres on the top of the mountain.<br />
The majority of the gullies are situated in the pediment where the slope is less <strong>and</strong> correspond to complex<br />
gully systems (Fig. 8B). These gully types are characterized by a lot of smaller gullies <strong>and</strong> rills flowing into<br />
the main gully. Streets represent often the starting point of a gully system. The dominating process in the<br />
gully heads is sheet <strong>and</strong> rill erosion resulting from the high level of slope <strong>and</strong> the position of bedrock close to<br />
the surface. The area of the glacis represent often gully systems which are characterized as simple, isolated,<br />
linear structures. In general these types of gullies are very wide <strong>and</strong> deep.<br />
23
Map 6: Data Collection during field work (Hotspot 3 <strong>and</strong> 4)<br />
24
Map 7: Digital Elevation Model (Hotspot 3 <strong>and</strong> 4)<br />
25
4.4 Gully Investigation<br />
Authors: Aline Girard, Alex<strong>and</strong>er Kasyoki, Robert Arendt<br />
4.4.1 Research questions<br />
It is very important to underst<strong>and</strong> the genesis of gullies in the upper regions of Voi, because the gully<br />
systems causing a huge amount of damages in the city. To know what kind of processes are leading to<br />
those damages, it is necessary to analyse the highly dynamic system itself. Therefore different<br />
questions have to be answered. These would be:<br />
1. Where does the gully genesis begin?<br />
2. When does the gully change its direction <strong>and</strong> his course of flow?<br />
3. Does the slope affect the depth of the gully?<br />
4. Can the measurements obtained be used to describe the gully geneses?<br />
5. What are the effects of the structures constructed across the gully on the gully system?<br />
6. Is it important to consider the gully parameters constructing selected structures across the<br />
gully?<br />
4.4.2 Methodology<br />
One gully-system in the upper Voi catchment area was selected to measure cross profiles with a laser<br />
distance measurement gadget (Leica Disto D8), including slope measurements. Furthermore a<br />
Garmin GPS-gadget was used. At every measured point, photos <strong>and</strong> a GPS point was taken. The<br />
GPS points were used for calculating the distance between the initial rills of the gully system <strong>and</strong> the<br />
cross profiles. The tracking points could be found on the satellite image (Map 8).<br />
At the beginning of the fieldwork it is necessary to identify the initial point of the investigated gully<br />
Fig. 9: Measurement of a gully cross profile<br />
26
system. It was found out that four rills create the gully head. Three rills enter directly into the gully<br />
head. The other one enters a few meters later of the head cut of the gully. At this particular gully the<br />
slope <strong>and</strong> the distance from the road between the starting point of the first rill erosion to the last rill<br />
starting point were determined. At each rill the feature, the GPS point, the slope, the height <strong>and</strong> the<br />
length were measured.<br />
In total 20 cross profiles were investigated. The first cross profile was taken at the point were the first<br />
two big rills entering the main gully head. Subsequent cross profiles were taken when a change in the<br />
slope, the width, the direction, <strong>and</strong> the depth ore special features in the gully was identified.<br />
The parameters of each cross profile were measured by using the distometer <strong>and</strong> the GPS.<br />
The field data were analysed to create a map with the taken GPS points locating the starting points of<br />
the rills <strong>and</strong> the measured cross profiles. The results of the cross profile measurements were presented<br />
in form of sketches. The map was used as the basic information to calculate the area were the gully<br />
system went into a sheet flow.<br />
4.4.3 Results<br />
It was found out that the gully genesis begins with surface runoff at the top of the hill. The map shows<br />
the GPS points which were taken at the rills <strong>and</strong> the cross profiles. The density of the GPS points on<br />
the hill causes by the occurrence of the four rills, which were measured out (Map 8). This particular<br />
small drainage area pass the water downhill crossing the street into the rills (GPS points) or it is<br />
concentrated in the culvert <strong>and</strong> drained into the main gully system.<br />
27
Map 8: GPS points along the gully marking the structure <strong>and</strong> points of cross profiles<br />
Cross profile<br />
12<br />
Cross profile<br />
13<br />
Cross profile<br />
17<br />
28
Three main gully types were selected to describe the variety of the morphological features of the 20<br />
investigated gully profiles. It was found out, that one of the main factors, which can change the gully<br />
genesis, is the variation of slope inclination.<br />
At the slope area with a high amount of bedrock occurrence the starting point of the rills <strong>and</strong> the gully<br />
heads were located. In this area the slope inclination is very high. This could be the reason why the<br />
investigated gully is in this part deep <strong>and</strong> side erosion take place. After a few meters downhill the<br />
gully began to me<strong>and</strong>er <strong>and</strong> deposition of sediments starts to decrease the depth of the gully.<br />
The first cross profile was taken a few meters after the two rills enter in the gully head. The slope in<br />
this area is very steep with bedrock. The gully walls are high (ca. 4.0 m) <strong>and</strong> the average width at the<br />
bottom of the gully is small (ca.3,50 m).<br />
The cross profile 12 was measured after a road crossed the gully. The slope was 5° <strong>and</strong> in the case of<br />
storm water, the street on the left side was flooded (notice that the picture <strong>and</strong> the cross profile were<br />
taken in the direction to the hill). It is visible that the water formed some new rills on the street (Fig.<br />
10 <strong>and</strong> 11).<br />
Fig. 10: Cross profile 12<br />
The profile 13 (figure 11) describes a part of the gully, where the slope is gentle <strong>and</strong> the gully change<br />
into the sheet flow type. Another gully entered in this gully system near the St.Kelvin academy. The<br />
pathway of the storm water entered in this place in a large sheet flow area (Map 8) <strong>and</strong> crosses the<br />
street afterwards.<br />
The cross profile 17 (figure 12 describes the gully formation a few meters after a culvert which was<br />
constructed one year ago. The vertical erosion was more pronounced than the horizontal erosion. That<br />
can take place when the water discharge is very high. The water came from the area with the sheet<br />
flow pattern <strong>and</strong> was concentrated in front of the construction.<br />
29
Fig. 11: Cross profile 13<br />
Fig. 12: Cross profile 17<br />
Thus a high discharge passed through the canal <strong>and</strong> flew with a very high intensity in the gully.<br />
Another gully located at the meteorological station side joined this gully before the last cross profile<br />
near the CIT (Coast Institute of Technology) gate. However the depth was not very high because of<br />
relatively flat surface.<br />
4.4.4 Discussion<br />
The gully genesis can be visualized by the selected methods but it is useful to know that the collected<br />
data are taken objective. It is not possible to measure all the necessary points in the investigation time<br />
because this can lead to loss of important information at a special point.<br />
One of the results of the investigation is that the longitudinal slope is a main factor to trigger the<br />
changes in the gully formation. This could be observed in the field as well as in the cross profiles with<br />
the measured slope describing this phenomena very well.<br />
By analysing the results of this investigation it is possible to characterize this gully with specific<br />
details. These results are not common; this means that the data cannot be reflected on the other gully<br />
systems implying that if it is necessary to know more about the other gully systems it would be<br />
inevitable to make the same fieldwork in every single gully.<br />
30
Another aspect is the infiltration rate of the soil, which is very low at the starting point due to the steep<br />
slope <strong>and</strong> the bedrocks on the gully bottom. The water cannot infiltrate <strong>and</strong> it flew on the bottom of<br />
the gully hence intensive side erosion.<br />
In the next days more cross profiles will be measured <strong>and</strong> the collected data will be used for the<br />
hydraulic visualisation. The hydraulic modelling will be used to underst<strong>and</strong> better the gully genesis.<br />
31
4.5 <strong>Flood</strong> Water <strong>Risk</strong> & <strong>Management</strong><br />
Authors: Timo Dilly; Ian Krop; Sergej Friedel, Florian Sedelmeier, Sheila W. Mumbi<br />
4.5.1 Research Questions<br />
This part of the study focus on flood risk vs. use <strong>and</strong> the development of a basic strategy to deal with<br />
the flood risks in Voi (flood risk management). Therefore the following questions have to be picked :<br />
1) What are the flood risks <strong>and</strong> why do they exist in the Voi area?<br />
2) Where are the most vulnerable flood prone areas in Voi <strong>and</strong> what are the local conditions?<br />
To develop a basic flood risk management strategy it is important to know what is the existing<br />
strategy for dealing with flood risks in Voi.<br />
4.5.2 Methodology<br />
In this case study several methods were used:.<br />
- data collection from satellite images<br />
- interviews of the responsible officer of Voi municipality during the field work<br />
- mapping relevant information in the field<br />
- Interviewing affected residents in their residential homes.<br />
The satellite images <strong>and</strong> the mapped hotspot areas were used to get basic information to analyses<br />
the flood water pathways. For more detailed information a member of the municipal staff, Mr.<br />
Mwajewe was interviewed on January 8, 2013. Mr. Mwajewe is very familiar with the special flood<br />
risk situation in Voi <strong>and</strong> gave a guided tour through Voi <strong>and</strong> to the hot spot areas in the city.<br />
Throughout the tour, observation, photographs, interviews <strong>and</strong> note-taking were used to select two<br />
special areas to investigate in more detail (Hotspot 1 <strong>and</strong> Hotspot 2). They are considered as<br />
representative hot spots within Voi.<br />
The actually existing gullies in these hotspots could be very precise identified with the help of<br />
satellite images. The longitudinal profile of the gullies could be divided into three main categories,<br />
the upper part, middle part <strong>and</strong> the lower part (Map 11 <strong>and</strong> 12). These gullies additionally leading to<br />
a flood risk in the lower parts of the investigated area. The analyzing of the longitudinal gully profiles<br />
leads to underst<strong>and</strong> the flood flow paths <strong>and</strong> its associated risks. More than twenty local residents<br />
were interviewed about the flood risk to their private properties. A h<strong>and</strong>held GPS was used for<br />
mapping the interview points <strong>and</strong> other investigated information.<br />
4.5.3 Results<br />
<strong>Flood</strong> risk is the product of flood hazard <strong>and</strong> possible consequences (vulnerability). There exists a<br />
wide range between the two extremes, no <strong>and</strong> very high flood risk. If there is a high amount of<br />
consequences in the flood prone area, a high flood risk is assumed. If there is no flood hazard <strong>and</strong> only<br />
32
”potential vulnerability” there is no flood risk to expect. In Voi there are settlements in flood prone<br />
areas hence flood risk <strong>and</strong> therefore a need to act. (PASCHKE, 2000)<br />
The Voi area was surrounded by mountains (almost Inselbergs) in the North, East <strong>and</strong> South east. Due<br />
to this particular situation of the city, Voi is located as well on the lower part of the slopes (Pediment),<br />
within the basin (Glacis) <strong>and</strong> on the floodplain of the Voi River, the pathway of the storm flow<br />
affecteing the residential <strong>and</strong> economic zones.<br />
Most of the population is concentrated in the town center which is the business center. The residential<br />
zones spread all around with concentrations on some regions e.g. the Sophia or Bondeni locations.<br />
<strong>Flood</strong> risk is a serious problem in Voi, this can be seen in terms of houses affected by the storm water,<br />
the cutting of roads making them impassable <strong>and</strong> breaking of water pipes, among others.<br />
Interview with Mr. Mwajewe (Municipality of Voi) on January, 8:<br />
Rain periods dictate the seasons in Voi, Kenya. Long period of rainfall with low intensity is<br />
experienced between March <strong>and</strong> May. The region receives dry spell season from June till September<br />
<strong>and</strong> this affects the vegetation. The trees lose their leaves during the dry season <strong>and</strong> nearly all the<br />
grass is desiccated by the end of the dry season. Short <strong>and</strong> heavy rainfalls occur from October till<br />
December, <strong>and</strong> whereby most problems related with storm water are experienced in December.<br />
Forecast about intense rains are not precise enough <strong>and</strong> are often wrong. Nevertheless the residents are<br />
informed by radio, television <strong>and</strong> newspaper about the oncoming weather <strong>and</strong> weather warnings. But<br />
these warnings are sometimes ignored, because the majority of the people focus on information on<br />
seasonal rainfall intensity for planning of agricultural projects. Local people predict the weather <strong>and</strong><br />
rainfall conditions through observation of special plants, the movement of birds <strong>and</strong> even the<br />
moonrise.<br />
Precaution measures that the municipality of Voi include giving s<strong>and</strong>bags to the residents of areas<br />
affected by flood water. These s<strong>and</strong>bags have to be filled <strong>and</strong> built up by the residents themselves.<br />
During the rain <strong>and</strong> resulting storm water the residents build up temporary measures <strong>and</strong> raises<br />
different types of fences to protect their buildings. But often these measures are too weak to resist the<br />
strength of the current of water <strong>and</strong> sediments. Other precaution <strong>and</strong> mitigation measures are not<br />
available.<br />
Regeneration is taking place only on roads. The roads in Voi are subdivided in different classes. The<br />
main road which goes through Voi is part of the national highway from Nairobi to Mombasa <strong>and</strong> it is<br />
administered by the Kenya National Highways Authority [KeNHA]. Most of the other roads in Voi<br />
are urban roads <strong>and</strong> are liable to the Kenya Urban Road Authority [KURA]. These institutions define<br />
the financial framework for all works at the road network in Voi, including regeneration after flood<br />
damages. When there is flood damage on the roads, the engineering department of Voi gets this<br />
information mostly by the residents. This information is received very fast by KURA because an<br />
assistant of KURA works closely with the Municipality department of Voi. KURA sends an engineer<br />
33
to record the damage <strong>and</strong> to generate a solution. This process needs time <strong>and</strong> in most cases a person<br />
designs short time solutions just for a certain spot <strong>and</strong> period. here isn’t any mana ement strate y for<br />
regeneration of the affected settlements.<br />
The settlements of Voi which are most affected are Tanzania, Bondeni <strong>and</strong> Sophia (figure 13).<br />
Fig. 13: Overview map with the most affected settlements<br />
Flow Direction in the Hot Spot 1 <strong>and</strong> 2 areas (see map 9, 10 <strong>and</strong> figure 14)<br />
The storm water runs typically from the top of the hill through the dynamic gully system developed at<br />
the hill slope. Most of the storm water drains into a big gully system which crosses the area near the<br />
St. Kelvin’s school. A wall built at the St. Kelvin’s school to the road nearby divides the discharge in<br />
two pathways. A few meters after this point a junction with flood water from an adjacent gully system<br />
occurred with the consequence of increasing the discharge. At the location of the Coast Institute of<br />
Technology, a ford <strong>and</strong> gully system directs this flood water directly into the lower part of the city i.e.<br />
Sophia. All the gullies generated in the upper <strong>and</strong> middle parts drains into the very lower part of this<br />
particular area of the city toward the Voi River resulting into adverse effects like damaged houses <strong>and</strong><br />
roads.<br />
34
Fig. 14: longitudinal Profile–Hotspot 1 <strong>and</strong> 2<br />
Border between<br />
Hotspot 1 <strong>and</strong> 2<br />
35
Map 9: Flow direction Hot spot 1<br />
36
Map 10: Flow direction Hotspot 2<br />
37
Hotspot 1 & 2 can be separated into 3 flood prone areas. In terms of population density, vegetation<br />
density <strong>and</strong> slope inclination they are called a upper, middle <strong>and</strong> lower part (map 11 <strong>and</strong> 12).<br />
Upper Part<br />
In the upper part of the investigated area the population density is low. The l<strong>and</strong> use is dominated by<br />
grazing of livestock <strong>and</strong> some agricultural activities. At the time of the field work a dense vegetation<br />
cover was found. The slope inclination is high, rill erosion <strong>and</strong> gully heads occurred.<br />
Middle Part<br />
In this part the population density is still low only scattered houses were found. Several schools <strong>and</strong><br />
Institutes were located in this part includin St.Kelvin’s <strong>and</strong> St.Agnes school <strong>and</strong> the Coast Institute of<br />
Technology. L<strong>and</strong> use is characterized by small scale farming mainly subsistence. The slope of the<br />
gullies decrease while their width increase<br />
Lower Part<br />
High population density is found on the lower parts. The l<strong>and</strong> use is residential area with low<br />
agricultural activities in between. The slope inclination is very low, the gully depth decrease, sediment<br />
accumulation occurred. Accumulation of sediments mostly occurred on the roads enhancing further<br />
damages due to storm water. A small gully network developed especially in the interior roads.<br />
38
Map 11: Research Points - Hotspot 2<br />
39
Map 12: Research points – Hotspot 1<br />
40
Evaluation of the resident interviews<br />
The evaluation of the resident interviews gives an overview over the flood risks take place in Voi.<br />
Beside this it is evident to know which kind of emergency measures are used in the settlements <strong>and</strong><br />
how the regeneration is implemented. The frequency of storm water events was expressed to in<br />
average 3,5 times a year.<br />
To analyze the results the flood damages of buildings <strong>and</strong> properties are subdivided in 5 different<br />
damage categories: a) properties without damage; b) properties which are affected just in the<br />
surrounding of the building; c) properties with flooded houses; d) properties with damaged houses <strong>and</strong><br />
e) properties with destroyed houses.<br />
One of the results of the interviews <strong>and</strong> overview indicates that the damages in the lower part are<br />
always more serious <strong>and</strong> at higher level than in the middle part (figure 15).<br />
37,5%<br />
Damages of houses <strong>and</strong> properties<br />
in the Middle Part<br />
12,5%<br />
0,0%<br />
12,5%<br />
37,5%<br />
Fig. 15: Different damages at properties<br />
no damage<br />
in surrounding<br />
house flooded<br />
house damaged<br />
house destroyed<br />
This information goes ahead with the statements of the residents referring maximum water level. The<br />
maximum water level occur mostly in the middle <strong>and</strong> lower part (figure 16).The information derived<br />
from the interviews about the maximum water level in the upper part shows, that the bank full<br />
discharge is never reached. Therefore in this region the hazard is clearly asses as not that high as in the<br />
upper <strong>and</strong> middle part of the investigated area.<br />
Damages of houses <strong>and</strong> properties<br />
in the Lower Part<br />
0,0% 0,0%<br />
27,3%<br />
18,2%<br />
54,5%<br />
no damage<br />
in surrounding<br />
house flooded<br />
house damaged<br />
house destroyed<br />
41
[cm] Maximum Water Level<br />
250<br />
200<br />
150<br />
100<br />
50<br />
0<br />
Fig. 16: Maximum water level<br />
The precaution <strong>and</strong> emergency measures are usually used are building s<strong>and</strong> walls, cutting trees to get<br />
material to build fences <strong>and</strong> constructing barriers with s<strong>and</strong> bags. Also some houses are protected with<br />
rocks but these measures are not efficient.<br />
The time to build up emergency measures is really short. Depending on the rainfall intensity the storm<br />
water hit the houses within a period from 12 up to 60 min after the start of the rainfall event. The<br />
majority of the residents don’t et any help to setup their measures (figure 17). There isn´t any alarm<br />
or action plan for the affected settlements. For regeneration there is mostly help from <strong>and</strong> within the<br />
community (figure 18). There isn´t any financial support to repair damages.<br />
Fig. 17: Assistance - emergency measures<br />
4.5.4 Discussion<br />
LOWER<br />
PART<br />
MIDDLE<br />
PART<br />
UPPER<br />
PART<br />
(in the<br />
gully)<br />
AVERAGE<br />
Fig. 18: Assistance – regeneration<br />
In response to flood risks enerally it’s necessary to create a basic strategy to deal with flood risks.<br />
MIN<br />
MAX<br />
This may involve three main procedures of flood or storm water management:<br />
42
a. The precaution measures, which could be done before a storm water event occur<br />
b. The emergency measures, which could be done during the flood<br />
c. Regeneration measures, to repair damages.<br />
For precaution a detailed master plan is required. The whole city needs a systematical planned<br />
extensive drainage concept. The gully system should be included in this concept. The planning must<br />
ensure a safe discharge of the storm water to the Voi River or, if this is not possible, a detention<br />
storage. In addition to that, there should identified open l<strong>and</strong>scape where the water could be stored or<br />
redirected to avoid damages. For example the water which comes from street N4 to Sophia could be<br />
redirected directly to the Voi river building a channel near the cost institute. Also the water of the<br />
gully which flow through St. Kelvin´s School should not be discharged to habited areas. The natural<br />
retention of water at the gully heads is hard to improve, because of the dry season between June <strong>and</strong><br />
September.<br />
Furthermore the created maps can be used as basic information to develop flood risk maps <strong>and</strong> an<br />
emergency plan for Voi city. Information events in the communities are useful to explain the right way<br />
to build up fences <strong>and</strong> to protect properties.<br />
The city district Tanzania, which is close to the Voi River, is often affected with flood problems. This<br />
flood originates from the upper Voi River catchment. The establishment of a People-Oriented Inter-<br />
District Operational <strong>Flood</strong> Warning System for the upper Voi River is recommended. This means on<br />
one h<strong>and</strong> a continuous monitoring of the precipitation <strong>and</strong> on the other h<strong>and</strong> the observation of<br />
relevant water level at the Voi River. Critical water levels could be identified <strong>and</strong> warnings <strong>and</strong><br />
recommendations could be issued clearly.<br />
43
4.6 Roads <strong>and</strong> buildings<br />
Authors: Anne Spies, Timo Rauch, Anne Nyabuti, Justus Kimeru<br />
4.6.1 Research questions<br />
Roads in regard to flood risks<br />
There is always the need that a creek or a water channel has to cross a road. In general, several<br />
possibilities of creatin a “junction” are kno n f.e. brid es culverts fords. As a result of the field<br />
work, three different engineering structures are selected for further investigation:<br />
Culverts<br />
Closed conduit for the free passage of surface drainage water under a highway, railroad, canal<br />
or other structures. 1<br />
Fords<br />
A shallow place where a river or creek may be crossed by traffic or by wading. 1<br />
Ditches<br />
Man-made, small, open channel constructed through earth or rock for the purpose of<br />
conveying water. 1<br />
Question 1: In what condition are the structures found as representative structures during field work?<br />
Question 2: If there is a problem - how can the problem be described <strong>and</strong> solved?<br />
Buildings in regard to flood risks<br />
There are different flood protection measures for buildings, f.e. walls, dykes, closures <strong>and</strong> fences.<br />
Research questions:<br />
Which flood protection measures are already used in Voi?<br />
Are they working properly?<br />
Which problems occur with these measures?<br />
How is it possible to improve these measures?<br />
Are the measures aapropriate to different kinds of buildings?<br />
4.6.2 Methodology<br />
1 st step: To get an overview<br />
First there was a need to get an overview of Voi to identify hotspots, storm-water protection measures<br />
for roads <strong>and</strong> different types of buildings.<br />
During the field work in January 2013 study points were marked using a GPS-tool. Photographs of<br />
these objects were recorded while taking the relevant notes. Field work surveys were carried out which<br />
included observations <strong>and</strong> interviews of the effected people (referring buildings).<br />
1 Wasserbau Dictionary<br />
44
2 nd step: Categorisation<br />
The above mentioned culverts, fords <strong>and</strong> ditches were analysed during field work. Representative<br />
examples were selected to get relevant information about the function of the engineering structures.<br />
Three different types were differentiated::<br />
A) Culverts<br />
a. Those that are working<br />
b. Those that lack maintenance<br />
c. Those that are not working<br />
B) Fords<br />
a. Those that are working<br />
b. Those that are not working<br />
C) Ditches<br />
a. Those that are working<br />
b. Those that lack of maintenance<br />
c. Those that are not working<br />
Protection measures for buildings:<br />
<strong>Flood</strong> protection measures were identified <strong>and</strong> studied using various categories:<br />
A) dyke<br />
B) fences<br />
a. out of corrugated sheet<br />
b. out of sticks<br />
C) walls<br />
D) closures for doors <strong>and</strong> windows<br />
a. out of bricks<br />
b. out of boards<br />
c. Combination<br />
3 rd Step: Assessment<br />
The evaluation of the measurements was made with the help of the engineering knowledge, literature<br />
<strong>and</strong> relevant documents. Furthermore, general approaches to improve the current situation were<br />
derived.<br />
4.6.3 Results<br />
A) Culverts<br />
a. Those that are not working<br />
45
Example 1<br />
Fig. 19: Culvert that is not working<br />
Example 2<br />
Fig. 20: Culvert (diameter: 600mm)<br />
b. Those that lack maintenance<br />
The intake part of the culvert seen in figure 19 is in a<br />
good condition, but the damage occurred at the outlet<br />
because the erosion protection needed for high flow<br />
velocities <strong>and</strong> shear stresses forces is missing.<br />
The culvert itself (diameter: 600mm, surface area:<br />
282.743mm²) is too small for the high amount of<br />
water therefore the flood formed another gully aside.<br />
The erosion protection was built in the<br />
rainy season when the s<strong>and</strong> under the<br />
protection measure downstream was<br />
soaked with water. In the following<br />
dry season, the water evaporated thus<br />
changing properties of the s<strong>and</strong>.<br />
Consequently changing the volume of<br />
the soil, hence destabilising the<br />
protection structure lead into the<br />
collapse of the structure as shown in<br />
the figure 20. The materials used for<br />
the erosion protection structure are<br />
too weak to h<strong>and</strong>le the shear stresses<br />
during flood events. Rips appeared;<br />
the storm water increased the rips <strong>and</strong><br />
washed parts of the structure away.<br />
Scours were formed at the damaged<br />
parts <strong>and</strong> the structure become<br />
ineffective.<br />
46
Fig. 21: Culvert that lack maintenance<br />
c. Those that are working<br />
Fig. 22: Culvert showing a functioning inlet<br />
Fig. 23: Possible improvement on the situation referring culverts<br />
Figure 21 is showing a typical example of<br />
culverts partly filled with sediment. During a<br />
storm water event, the discharge capacity is<br />
reduced <strong>and</strong> the calculated amount of water<br />
cannot be discharged. Runoff water floods the<br />
road <strong>and</strong> makes the road impassable. The storm<br />
water also damaged the structure.<br />
diameters: 2*600mm surface area: 565486mm²<br />
Figure 22 shows the front part of the<br />
inlet where the storm water enters the<br />
structure. The inlet part is in a good<br />
condition, as compared to the outlet<br />
part (figure 23)The downstream end<br />
requires maintenance <strong>and</strong> need to be<br />
repaired, otherwise the structure can be<br />
collapse during the next heavy flood<br />
event. Figure 25 shows the problem:<br />
Intensive erosion was the source of the<br />
collapse of the erosion protection<br />
measure.<br />
Dimensions of the culvert: height:<br />
2,38m, width: 5,06m<br />
The following drawings 1 <strong>and</strong> 2 give an illustration of a possible improvement of the culvert structures<br />
that could be adopted.<br />
47
Fig. 24: Longitudinal profile of the proposed improved culvert<br />
Fig. 25: Cross profile of the proposed improved culvert<br />
Figure 24 <strong>and</strong><br />
Figure 25 shows a<br />
possible solution<br />
for the erosion<br />
problems in the<br />
outlet area of the<br />
culvert<br />
(downstream<br />
end).<br />
A ramp should be<br />
built with<br />
concrete <strong>and</strong><br />
rocks to ensure<br />
discharge the<br />
runoff.<br />
A stable <strong>and</strong> deep<br />
substructure<br />
should also be put<br />
in place to make<br />
the culvert<br />
resistant against<br />
erosion.<br />
48
B) Fords<br />
The few fords we located during field work were not properly working (figures 26 <strong>and</strong> 27)<br />
Fig. 26: An overview of a ford<br />
High erosion is also taking place at the upstream end of the fords <strong>and</strong> lead to instability of the whole<br />
structure.<br />
Fig. 27: A study member showing the direction of<br />
49
d. Those that are working<br />
Fig. 28: A downstream end of taford<br />
Fig. 30: The same ford as in pictures 28 <strong>and</strong> 29 but<br />
from a different point showing accumulation of wastes<br />
<strong>and</strong> debris across a fence running through it<br />
Fig. 29: A downstream end of a ford<br />
Figure 28 <strong>and</strong> 29 show ford which is working<br />
properly. Nevertheless the erosion protection of<br />
the downstream end of the ford could be<br />
improved.<br />
The fence as indicated in figure 30 should be<br />
removed in the downstream end of the ford to<br />
reduce accumulation of silt, sediments <strong>and</strong><br />
surface runoff waste.<br />
50
B) Ditches<br />
a. Those that are not working<br />
Fig. 31: Not connected ditch filled with sediments<br />
b. Those ditches that lack of maintenance<br />
Fig. 32: Ditch filled up with debris<br />
Figure 31: Illustrates a ditch that is not<br />
connected with another ditch to discharge water<br />
from the gully system further downstream.<br />
Consequently it will contribute to the flooding<br />
of the road making it impassable. In this<br />
particular example the ditch was filled with<br />
sediments.<br />
Figure 32 shows a ditch filled with construction<br />
debris which may block the passage of storm-<br />
water. It needs to be removed.<br />
51
Fig. 33: A functional ditch<br />
Buildings:<br />
c. Those that are working<br />
Protection measures for the buildings:<br />
A) S<strong>and</strong>bag-dyke<br />
Fig. 34: Dyke made of s<strong>and</strong>bags<br />
A dyke made out of s<strong>and</strong>bags that are<br />
fixed by soil. If there is high intensity<br />
of the storm water, the soil will be<br />
washed away <strong>and</strong> the s<strong>and</strong>bags might<br />
lose their positions.<br />
High s<strong>and</strong>bag-dykes prevent the<br />
floodwater from entering houses or<br />
properties.<br />
Low s<strong>and</strong>bag-dykes with one or two<br />
layers can be used to reduce the power<br />
of the flood.<br />
52
Fig. 35: Dyke made of s<strong>and</strong>bags<br />
B) Fences<br />
a. Those made out of corrugated sheets<br />
Fig. 36: Backside of a fence<br />
This picture shows an example of a<br />
correctly built s<strong>and</strong> sack wall within a<br />
German city.<br />
Additional suggestions:<br />
Fill the bags only to two- thirds, to<br />
ensure closure of the bag all the<br />
time.<br />
Keep a distance of 2 – 3m between<br />
buildings <strong>and</strong> dyke<br />
The lowest layer in direction of the<br />
water side has to be parallel to the<br />
current<br />
The s<strong>and</strong>bags have to be layered<br />
overlapping each other.<br />
It is a good idea to use a combination of<br />
stakes, corrugated sheets <strong>and</strong> accumulation<br />
of soil. A proper illustration is shown in<br />
figure 36. It is important to ensure that the<br />
construction is resistant to floodwater, <strong>and</strong><br />
this is achieved by fixing the stakes in the<br />
soil while using struts for the enhancement<br />
of the framework. The struts should be<br />
built on the non-water side of the wall <strong>and</strong><br />
positioned between 30- 45°. The<br />
corrugated sheets should be buried more<br />
than 10 cm into the ground <strong>and</strong> soil is<br />
recommended to be used on the flood water<br />
side to stabilize the construction.<br />
53
. Fences made out of sticks<br />
Fig. 37: Fence made of sticks<br />
C) Walls<br />
Fig. 38: Wall at the St. Kevin Hill Primary School<br />
A fence like this does not protect water from<br />
getting into the property. It can just reduce the<br />
power of the current. To reduce the velocity of<br />
the flood water it is necessary that the fence<br />
itself is stable. Therefore, sticks should reach<br />
more than 20 cm into the ground <strong>and</strong> they also<br />
need struts on the non-water side.<br />
A wall can be a good protection against<br />
flood water. It is necessary that the wall<br />
surrounds the building completely. In<br />
this example (fig. 38) the water can pass<br />
the school from the non-water side.<br />
Therefore they built a dyke out of soil. If<br />
the water is higher than the dyke it can<br />
get into the school compound. So we<br />
would recommend an extension of the<br />
wall to surround the entire school<br />
compound.<br />
Furthermore, there are good experiences<br />
with elevating walls with natural stones,<br />
because natural stones are more resistant<br />
against water than bricks.<br />
54
D) Closures for doors <strong>and</strong> windows<br />
a. Out of bricks<br />
Fig. 39: Closure out of bricks in<br />
front of a door<br />
b. Out of wooden boards<br />
To have a closure in front of doors can be useful.<br />
To prevent a building from flood water, the<br />
closure has to be high enough. Otherwise, it just<br />
protects the house from sediments. High closure<br />
does not make sense in front of a door. It is<br />
recommended to raise the closure with woods<br />
before the flood is arriving.<br />
Closures made of wooden boards have the<br />
advantage in that their volume increases when<br />
they are put into water. Thus the boards fill little<br />
gaps between themselves <strong>and</strong> the wall by itself<br />
straight away when flood is coming.<br />
55
c. Combinations of different materials<br />
Fig. 40: Closure made of different materials<br />
In figure 40 a combination of corrugated sheets<br />
<strong>and</strong> accumulation of soil is to be seen. If you<br />
work with corrugated sheets as a closure, you<br />
need to fill the gaps between sheet <strong>and</strong> wall with<br />
soil. We also recommend fixing the sheet with<br />
s<strong>and</strong> bags. They are heavy <strong>and</strong> cannot be<br />
displaced with that ease.<br />
There are different kinds of buildings which use different kinds of protection measures.<br />
A) Residential house<br />
d. Single-storey building<br />
i. Out of bricks<br />
56
Fig. 41: Single store building out of bricks<br />
Single-storey buildings out of bricks can use<br />
all kinds of the described flood protection<br />
measures. It is important to protect the walls<br />
from soaking. If they are st<strong>and</strong>ing in water<br />
for a long time they are prone to collapse. It<br />
is also a good idea to elevate the house by<br />
using natural stones, because they are<br />
resistant to water.<br />
57
Fig. 42: Muddy house<br />
ii. Out of mud<br />
e. Multi-storey building<br />
Fig. 43: Multi-storey building<br />
Buildings out of mud are not resistant to floods.<br />
They will take quite a short time st<strong>and</strong>ing in<br />
water <strong>and</strong> then collapse. The described protection<br />
measures cannot totally prevent such buildings<br />
from water. If the storm water is only passing by<br />
the house <strong>and</strong> is not that high, the building can be<br />
elevated with stones, bricks or boards.<br />
Muddy houses should not be built in a valley<br />
with stagnant water or in a flood-prone area.<br />
In a building like the one shown in fig. 43, it is<br />
important to protect the ground floor from<br />
damages by flood water. If the ground floor<br />
gets damaged, the entire building will bent<br />
towards one side <strong>and</strong> eventually collapse. In<br />
addition, the buildings constructed next to it<br />
will likewise get damaged.<br />
58
B) Petrol station<br />
Fig. 44: Petrol station (Source: ARENDT 2013)<br />
4.6.4 Discussion of the results<br />
There is one important safety aspect for<br />
petrol stations relating to flood: the gas<br />
tanks. If gas tanks float, they can be<br />
damaged <strong>and</strong> the petrol can pollute the<br />
environment. So it is very important to<br />
make sure that the tanks are not able to<br />
float. There are good experiences with<br />
cementing the tanks under the ground so<br />
that they cannot move <strong>and</strong> float.<br />
During our field work we found that different storm water protections already exist in Voi town. The<br />
problem is that the amount of measures is too low. The estimated dimensions are too small <strong>and</strong><br />
there are different problems in the way how to build the storm water protection measures.<br />
4.6.5 Recommendations<br />
To build storm water protection measures in the right way it is necessary to use the common codes, to<br />
stick on the right preparing of the material. Also it is necessary to inform the inhabitants how to use<br />
the available s<strong>and</strong>bags in the right way.<br />
59
4.7 <strong>Flood</strong>water Harvesting<br />
Authors: Ayhan Celebi Michael iden An ela Wairimu Kimaru Joyce J. Kon ‘a<br />
4.7.1 Research questions<br />
Concerning <strong>Flood</strong> Water Harvesting some questions emerged – answers to these questions are<br />
answered in later parts of this report. First it is important to know what <strong>Flood</strong> Water Harvesting means<br />
to get an underst<strong>and</strong>ing of the topic. According to the Food <strong>and</strong> Agricultural Organization of the<br />
United Nations <strong>Flood</strong> Water harvesting is the development of water resources in case of flood water.<br />
The main research questions which were picked for the field work are:<br />
1) Is there already an existing strategy for <strong>Flood</strong> Water Harvesting in Voi?<br />
2) What appropriate strategies should be used in Voi?<br />
3) What measures can be implemented for water storage <strong>and</strong> for flood protection?<br />
To answer these questions, some auxiliary questions were developed. In the specific area, the water<br />
pathways <strong>and</strong> the origin of the water need to be figured out. Another aspect that has to be investigated<br />
is the state of art, so what has already been implemented <strong>and</strong> what measures are not yet available.<br />
Related to this, it is important to identify what the water will be used for <strong>and</strong> where it can be stored. In<br />
order to make suggestions for further measures, it must be found out which possibilities are there in<br />
the study area <strong>and</strong> a good starting point for the implementation of such measures. The contact with<br />
local inhabitants is very important in order to access information about the general social acceptance,<br />
motivation <strong>and</strong> response of <strong>Flood</strong> Water Harvesting <strong>and</strong> to ensure that they all work together for the<br />
success of the measures.<br />
4.7.2 Methodology<br />
For the investigation area in Voi we found no documentation of <strong>Flood</strong> Water Harvesting measures<br />
available even where basic harvesting methods exist.<br />
The satellite images <strong>and</strong> the maps created by Christopher Raab <strong>and</strong> Steffen Lehmann from the Free<br />
University of Berlin are useful to get a general overview (maps 9 <strong>and</strong> 10). Three study areas with<br />
different conditions are chosen <strong>and</strong> the following maps are used (look up in the appendix):<br />
- sub area south west<br />
- sub area hot spot1<br />
- sub area hot spot 2<br />
- sub area hot spot 4<br />
Preliminary visit to the selected areas were conducted first, observations <strong>and</strong> follow ups done to verify<br />
sources of water <strong>and</strong> flow paths <strong>and</strong> also search for measurements that are already implemented. For<br />
documenting the investigation in the field, photographs were taken.<br />
60
For detailed investigations, some measurements using the Leica DISTO TM D8 were taken at various<br />
study points to get information about the widths, depths <strong>and</strong> height of flood water flow.<br />
The local residents were interviewed to get responses for the questions <strong>and</strong> to find out if they were<br />
open for new measures. Also the interviews assisted to document any steps are taken.<br />
4.7.3 Results<br />
Study area 1<br />
In this area two possible flood water harvesting points are identified based on the amout of water that<br />
was flowing through these points. They are categorised as sub area 1 <strong>and</strong> sub area 2 <strong>and</strong> details of each<br />
were discussed on the basis of suitability for possible implementation of construction of flood water<br />
collection tanks. Details of these areas are to be seen in figure 45:<br />
Fig. 45: Study area 1 (www.earth.google.com, edited)<br />
Sub area 1:<br />
This is one of the initial places where we found it reasonable to build a water storage facility. It is<br />
located right above the Voi stadium. There was already huge amounts of water concentrated within it .<br />
The presence of huge sediment deposits around it suggests of a high amount of water passing through<br />
it.With this information, this area is considered as an ideal place for flood water storage in order to<br />
control the amount of flood water that flows through it <strong>and</strong> which consequently ends up eroding at the<br />
edges of the stadium <strong>and</strong> damaging the road next to it.<br />
Legend<br />
Water pathway<br />
Implemented Measures<br />
Proposed Measures<br />
61
Sub area 2: This area is an open l<strong>and</strong> closer to the hilltop with no ongoing agricultural activities nor<br />
nearby constructions or buildings. This seems to be a more convenient area for water harvesting<br />
because of the convergence of water from different directions. The culverts at this point are too small<br />
to h<strong>and</strong>le the large volumes of water flowing in it due to the sediment that is covering the culverts<br />
halfway. Most water comes from gullies in this sub area, converging at one point which becomes of<br />
interest if some kind of harvesting would be done to act as a flood control <strong>and</strong> at the same time serve<br />
the community’s domestic usa e.<br />
It is however imperative to mention the great challenge posed by sediments that are carried along with<br />
the flood water. Sediment barriers should be put into consideration when decision for construction is<br />
underway.<br />
Fig. 47: Proposed area<br />
Tab. 6: Local prices for water tanks in Voi 2013<br />
Local prices for water tanks<br />
Volume in liters Price in KES<br />
1,500 15,000<br />
2,000 20,000<br />
2,300 21,000<br />
2,500 23,000<br />
3,000 25,000<br />
3,500 31,000<br />
4,000 38,000<br />
Fig. 46: Proposed area 2<br />
62
Study area 2<br />
Fig. 48: Study area 2 (www.earth.google.com, edited)<br />
Study area 2 is one of the critical areas considered in the study. There are some deep <strong>and</strong> wide gullies<br />
running from the hill. It consists of settlements <strong>and</strong> other social amenities e.g. hotels, schools located<br />
on the slope of the hills in the area. The people carry out small scale farming. The area experiences<br />
intense rainfall during some selected months of the year. The rain water collects in the hills <strong>and</strong> flows<br />
down its slopes with a high velocity due to the high slopes of the hilly terrain. This water flows as<br />
storm water into the settlements <strong>and</strong> the schools <strong>and</strong> also creates the deep <strong>and</strong> wide gullies in the area.<br />
Some of the residents living in these settlements have tried to build some terraces to control the flow<br />
of the flood water <strong>and</strong> use some of the water to irrigate crops on their l<strong>and</strong>s. They also dug deep<br />
trenches to collect the water that flows downstream when it rains but the rate of infiltration is very<br />
high due to the high hydraulic conductivity of the soil thus the water cannot be stored for long. To<br />
channel the water from the gully to the field, a depression in the side wall of the gully is dug so that a<br />
part of the water above a certain water level flows to the field.<br />
Legend<br />
Water pathway<br />
Implemented Measures<br />
Proposed Measures<br />
63
Therefore storage needs to be constructed in the area to collect the flood water to be used for<br />
agriculture <strong>and</strong> by the schools around. An underground storage tank can be built in the North-West of<br />
St Agnes primary school, where there is already a little embankment to concentrate the water <strong>and</strong><br />
redirect it so that the water does not flow directly into the buildings. The school could use that water in<br />
the nearby kitchen to cook or wash. Because of the huge amount of sediments, a sediment barrier<br />
should be constructed before the tanks, otherwise sediments would be deposited in to the tanks which<br />
would decrease the storage capacity after every rainfall event. Another storage tank can be built as a<br />
large water storage pan in the area around the gully shown on the map. The storm water would be<br />
channeled to this water pan. This water from the pan can be used for agriculture in the area <strong>and</strong> can<br />
also be treated <strong>and</strong> used by the nearby school St Kevin. In the settlements, where some terraces are<br />
already built, every resident could build terraces so that the flood water may be slowed down <strong>and</strong> the<br />
water used to irrigate the nearby farms. Therefore it is really important that all the residents work<br />
together, because one single terrace would not achieve the desired effect.<br />
Fig. 50: Proposed terracing, 2013<br />
Study area 3<br />
The third investigated location was the area around the Scripture Mission of Voi. This location is of<br />
great importance because of the gully on the west end of the property, which is discharging huge<br />
amounts of water <strong>and</strong> causing huge damage on the settlements <strong>and</strong> infrastructure next to the Coast<br />
Institute of Technology. In the Scripture Mission of Voi, there are already several measures of Rain<br />
Water Harvesting put into practice. Little earthen embankments lead the water to fruit trees, roof<br />
catchment <strong>and</strong> buckets with small holes filled with water buried in the earth which irrigates the plants<br />
slowly. The collected water from the roofs is diverted into 3 fish tanks. Generally, the use of l<strong>and</strong> is<br />
already much more efficient than the surrounding area of Voi <strong>and</strong> therefore this is a good example for<br />
possible duplication by the Voi people.<br />
Fig. 49: Tranches<br />
64
Fig. 51: Study area 3 (www.earth.google.com, edited)<br />
To gain more intense agriculture on the 32 ha l<strong>and</strong> of the Mission, more water is needed which can be<br />
gathered by <strong>Flood</strong> Water Harvesting. In contrast to the other investigated areas in Voi, the discharge of<br />
flood water which is flowing in southern direction towards the Voi River does not move in centered<br />
gullies but constantly on the whole range of surface. Therefore it would make sense to lead the flood<br />
water by earthen embankments or water spreading bunds to a centered place where it can be stored as<br />
illustrated in figure 52 <strong>and</strong> 53. The consequent reduction of the stream velocity will increase the<br />
infiltration rate, which will regenerate the ground water level <strong>and</strong> further enhance the capacity of the<br />
already existing well. Due to the semi-arid climate <strong>and</strong> the high evaporation rates it’s necessary to<br />
collect the water in an underground storage, so that the water can be used even in the dry season to<br />
ensure a certain constant amount of water for agriculture. Another way of collecting water for<br />
agriculture in this area would be to divert some water from the flanking gully to the ground of the Voi<br />
Mission, which would also reduce the damage of flood water discharges in the settlements near to the<br />
Coast Institute of Technology.<br />
Legend<br />
Water pathways<br />
Implemented Measures<br />
Proposed Measures<br />
65
Fig. 52: Rainwater harvesting<br />
4.7.4 Discussion:<br />
To realize <strong>Flood</strong> Water Harvesting methods in Voi, it is suggested to start with the first measures on<br />
the ground of the Scripture Mission Voi. Not only do the topographic aspects favor such interventions<br />
but also the fact that the Scripture of Mission of Voi is an interesting place from a social point of view.<br />
<strong>Flood</strong> Water Harvesting methods which will be realized on the ground of the Mission can be used<br />
together with the already realized Rain Water Harvesting methods to develop a pilot project of Water<br />
Harvesting methods for the city of Voi. Other residents could learn from the pilot project either<br />
through workshops to implement the techniques for their own or common use. It is more reasonable to<br />
face the problem by starting with small measures like Rain Water Harvesting methods <strong>and</strong> afterwards<br />
implement <strong>Flood</strong> Water Harvesting methods in a step by step process. Due to the high evaporation<br />
rate, the best solution for storage in semi-arid areas like Voi is an underground tank although this<br />
could be prohibitive due to the costs involved especially in putting a tank. It is imperative for one to<br />
consider the purposes for which the water is used. For irrigation, a pan would be fit to construct than<br />
an underground tank because of the cost element. Measures like the construction of terracing systems<br />
would only be reasonable if they are realized in the whole area. It is for this reason that it is important<br />
to have a remarkable pilot project like the Scripture Mission of Voi to convince the people of the<br />
importance <strong>and</strong> benefits which will result from their investment, so that <strong>Flood</strong> Water Harvesting can<br />
be an option for Voi residents in the future.<br />
Fig. 53: Dams for irrigation<br />
66
5 Discussion of the Results<br />
After one week of joint German Kenyan student field work in Voi we are glad to summarize that the<br />
approach of the students project was very successful to work together <strong>and</strong> interdisciplinary. The<br />
students gained methodological competence <strong>and</strong> sociocultural experience during field work. During<br />
this week they stayed together on the campus of Taita Taveta University college, worked together to<br />
create the field study report <strong>and</strong> took the opportunity for sociocultural exchange in a more private<br />
atmosphere.<br />
The student field work results are analyzed <strong>and</strong> summarized in a project report. The report yield a<br />
contribution to the underst<strong>and</strong>ing of the geo scientific processes (interpretation of satellite data, flood<br />
risk mapping of flow paths <strong>and</strong> gullies, gully investigation <strong>and</strong> soil characteristics), <strong>and</strong> describes<br />
basic engineering approaches (flood risk versus use, flood risk management strategies, roads <strong>and</strong><br />
buildings <strong>and</strong> flood water harvesting). The specific results are summarized in each subchapter of the<br />
report. The investigations are considered as a basis for a comprehensive monitoring that should be<br />
preferably implemented by Taita Taveta University College.<br />
6 Recommendations<br />
The student research was carried out during a few days in January 2013. The investigations on the<br />
ground could give a broad overview <strong>and</strong> in some cases detailed information were received. But this<br />
does not substitute a comprehensive research approach considering all relevant aspects in the<br />
investigation area. Neither can it substitute the necessary efforts for a Master plan of city development<br />
which need to have a drainage concept included.<br />
Although, some recommendations as a result of the field work can be derived:<br />
1. <strong>Flood</strong> seems to be the most dangerous natural hazard for Municipal Council of Voi. It is<br />
continuously damaging individual houses <strong>and</strong> public infrastructure during the rainy seasons.<br />
Therefore there is an urgent need for a comprehensive <strong>and</strong> holistic approach to underst<strong>and</strong> the<br />
natural processes of the problems as well as predicting the negative effects.<br />
2. The soil erosion protection <strong>and</strong> flood risk management strategy need to be incorporated in a<br />
Master plan for the development of the city.<br />
3. There is no existing drainage system within the Municipal Council of Voi which is able to<br />
carry storm water in a non-hazardous way to the Voi river. The gully system as well as the<br />
natural creeks we found during our field work are not stable <strong>and</strong> change with the flow<br />
conditions. Without an efficient drainage system, storm water will continue to inundate<br />
vulnerable parts of the city <strong>and</strong> cause damage during flood events.<br />
4. Generation of surface water runoff combined with soil erosion occur frequently in the<br />
headwater areas uphill. This is the most important source area for the flood <strong>and</strong> erosion related<br />
67
processes in Voi. Effective erosion protection measures need to focus on those regions. Water<br />
retention in the headwater areas will be most efficient.<br />
5. We see a lot of possibilities for water retention including infiltration. Because water is a<br />
valuable resource in semiarid regions, storage of water can be used for different usages. <strong>Flood</strong><br />
water harvesting measures should be strongly supported <strong>and</strong> put into practice on different<br />
places <strong>and</strong> at different scales.<br />
6. Storm water cause damages on roads in the investigation areas mostly by soil erosion which<br />
affects the engineering structures (culverts, fords, ditches). The necessary engineering<br />
knowledge to avoid these problems is available <strong>and</strong> need to be applied properly. Therefore it<br />
is necessary to monitor the damages after rainfall events <strong>and</strong> react properly.<br />
7. There is a variety of possibilities to protect individual <strong>and</strong> public buildings against storm<br />
water. Individual protection measures have to follow the regulations of the Master plan (see 2)<br />
otherwise it can create bigger storm water problems downstream. We found some examples of<br />
building precaution measures which can be used as positive examples.<br />
8. It seems to be necessary to raise the awareness of storm water <strong>and</strong> soil erosion problems<br />
within the whole community because many citizen might be affected <strong>and</strong> everybody is able to<br />
contribute to solutions. Workshops <strong>and</strong> other capacity building measures are appropriate tools.<br />
They should also include best practice examples which we have seen within the city for<br />
example rain <strong>and</strong> flood water harvesting measures.<br />
9. The Municipal Council of Voi should make benefit of their scientific institution. The Taita<br />
7 Outlook<br />
Taveta University College can contribute with knowledge <strong>and</strong> engagement <strong>and</strong> for example<br />
install <strong>and</strong> operate a monitoring system.<br />
The joint German – Kenyan student project ends with the workshop in Voi on January 14th 2013. The<br />
students of the Freie Universitaet Berlin will continue their field work until the end of January 2013.<br />
Their master thesis will be available in autumn 2013. After intensive preparation in spring 2012 the<br />
VOIRICA proposal referring further scientific investigations was submitted to the Federal Ministry of<br />
Education <strong>and</strong> research (Germany) in June 2012. The assessment about the success of the application<br />
is to be expected at the end of January 2013. We are looking forward to be financially supported to be<br />
able to return to Voi <strong>and</strong> continue our investigations.<br />
68
Appendix<br />
69
Map 13: Hotspots of Voi<br />
70