Morning Brief
Morning Brief
Morning Brief

Create successful ePaper yourself
Turn your PDF publications into a flip-book with our unique Google optimized e-Paper software.
Desk Notes Published<br />
Russia 2008: Growth Financed from the State<br />
Coffers?<br />
Ukraine: UniCredit Completes Ukrsotsbank<br />
Acquisition<br />
Equity markets<br />
2 500<br />
2 400<br />
2 300<br />
2 200<br />
2 100<br />
2 000<br />
1 900<br />
1 800<br />
Index<br />
14 Nov 20 Nov 26 Nov 30 Nov 6 Dec 12 Dec 18 Dec 24 Dec 28 Dec 14 Jan 18 Jan 24 Jan<br />
Source: RTS, MICEX, Bloomberg<br />
RTS PFTS re-based KASE re-based<br />
Ukrainian equity market chart, see p. 7<br />
Kazakh equity market chart, see p. 10<br />
Equity indices, currencies, commodities<br />
Close Change 1 YTD 1<br />
% %<br />
Russian<br />
RTS 1 988 5.1 -13.2 <br />
RTS-2 2 437 1.5 -7.3 <br />
RTX 2 697 5.7 -14.6 <br />
MICEX 1 662 5.8 -12.0 <br />
Ukrainian<br />
KAC 20 19 911 4.0 -1.9 <br />
PFTS 1 127 3.3 -2.8 <br />
Kazakh<br />
KASE_Shares 2 592 0.4 -1.7 <br />
Reuters ADR Index 331 1.2 5.6 <br />
International<br />
MSCI Russia 1 338 5.6 -12.9 <br />
MSCI GEM 1 083 2.7 -13.0 <br />
DJIA 12 379 0.9 -6.7 <br />
S&P 500 1 352 1.0 -7.9 <br />
Shanghai Comp 4 786 1.4 -9.0 <br />
FTSE 100 5 876 4.8 -9.0 <br />
NIKKEI 225 13 629 4.1 -11.0 <br />
ASX 2 998 4.6 -8.8 <br />
ISE 100 45 011 5.8 -19.0 <br />
Bovespa 57 463 6.0 -10.1 <br />
R/$ Exchange Rates<br />
CBR 24.6325 -1.0 0.4 <br />
SELT tomorrow 24.5991 -0.3 0.3 <br />
UAH Exchange Rates<br />
UAH/$ 5.05 0.0 0.0<br />
KAZ Exchange Rates<br />
KAZ/$ 120.22 0.0 -4.7 <br />
$/Euro Exchange Rate 1.4734 1.2 0.1 <br />
Commodities<br />
Brent, $/bbl 89.33 3.1 -4.9 <br />
Urals, $/bbl 87.27 3.1 -4.4 <br />
WTI, $/bbl 90.06 2.8 -6.2 <br />
Nickel, $/ton * 27 250 1.3 3.6 <br />
Copper, $/ton * 7 020 2.2 5.2 <br />
Gold, $/oz 911 -0.2 9.3 <br />
Palladium, $/oz 375 0.3 1.6 <br />
* - 3 months forward<br />
<strong>Morning</strong> <strong>Brief</strong><br />
Top 6 Gainers: URKA $7.10 14.5% URSI $0.053 12.9% RASP $5.96 11.0%<br />
RTKMP $2.27 10.8% MMBM $47.0 10.6% EVR $68.2 10.0%<br />
Top 6 Losers: CHE $12.5 -9.1% RMG $24.6 -3.0% NNSI $4.65 -2.1%<br />
SNGSP $0.50 -2.0% TGKJ $3.52 -2.0% SNOZ $91.0 -1.1%<br />
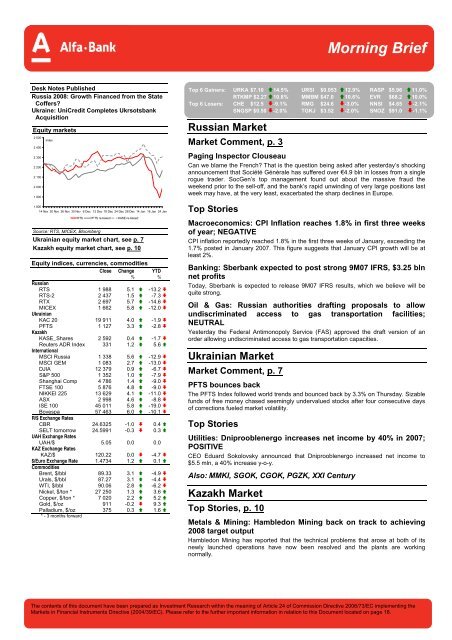
Russian Market<br />
Market Comment, p. 3<br />
Paging Inspector Clouseau<br />
Can we blame the French? That is the question being asked after yesterday’s shocking<br />
announcement that Société Générale has suffered over €4.9 bln in losses from a single<br />
rogue trader. SocGen’s top management found out about the massive fraud the<br />
weekend prior to the sell-off, and the bank’s rapid unwinding of very large positions last<br />
week may have, at the very least, exacerbated the sharp declines in Europe.<br />
Top Stories<br />
Macroeconomics: CPI Inflation reaches 1.8% in first three weeks<br />
of year; NEGATIVE<br />
CPI inflation reportedly reached 1.8% in the first three weeks of January, exceeding the<br />
1.7% posted in January 2007. This figure suggests that January CPI growth will be at<br />
least 2%.<br />
Banking: Sberbank expected to post strong 9M07 IFRS, $3.25 bln<br />
net profits<br />
Today, Sberbank is expected to release 9M07 IFRS results, which we believe will be<br />
quite strong.<br />
Oil & Gas: Russian authorities drafting proposals to allow<br />
undiscriminated access to gas transportation facilities;<br />
NEUTRAL<br />
Yesterday the Federal Antimonopoly Service (FAS) approved the draft version of an<br />
order allowing undiscriminated access to gas transportation capacities.<br />
Ukrainian Market<br />
Market Comment, p. 7<br />
PFTS bounces back<br />
The PFTS Index followed world trends and bounced back by 3.3% on Thursday. Sizable<br />
funds of free money chased seemingly undervalued stocks after four consecutive days<br />
of corrections fueled market volatility.<br />
Top Stories<br />
Utilities: Dniprooblenergo increases net income by 40% in 2007;<br />
POSITIVE<br />
CEO Eduard Sokolovsky announced that Dniprooblenergo increased net income to<br />
$5.5 mln, a 40% increase y-o-y.<br />
Also: MMKI, SGOK, CGOK, PGZK, XXI Century<br />
Kazakh Market<br />
Top Stories, p. 10<br />
Metals & Mining: Hambledon Mining back on track to achieving<br />
2008 target output<br />
Hambledon Mining has reported that the technical problems that arose at both of its<br />
newly launched operations have now been resolved and the plants are working<br />
normally.<br />
The contents of this document have been prepared as Investment Research within the meaning of Article 24 of Commission Directive 2006/73/EC implementing the<br />
Markets in Financial Instruments Directive (2004/39/EC). Please refer to the further important information in relation to this Document located on page 18.
ALFA’S TOP PICKS<br />
Ticker Target Price Upside to Target Investment Rationale<br />
Equities<br />
RUSSIA<br />
Gazprom GAZP $22.0 76% We think Gazprom is currently the best play among the Russian oil & gas<br />
producers, and believe it is seriously undervalued. Gazprom will benefit<br />
disproportionately from higher international oil prices and upcoming steep<br />
domestic gas price increases, the latter sorely needed to dampen rampant<br />
domestic demand. The Street has been behind the curve on long-term oil prices,<br />
and it is now behind the curve on Gazprom’s long-term business prospects. We,<br />
however, have raised our Gazprom target price to $22.0/share and make it our top<br />
pick in the Russian oil & gas universe.<br />
VimpelCom VIP $50 46% We see VimpelCom as the most attractive Russian telecom stock. The acquisition<br />
of Golden Telecom, a leading Russian fixed-line provider, will directly add $1 bln to<br />
VimpelCom, as we value Golden at $129 per share vs. the $105 offered. It will also<br />
bring VimpelCom an additional $3.4 bln in synergies and exposure to the growing<br />
consumer broadband story, which is going to be a key driver in pushing<br />
VimpelCom’s value higher in the coming months. Regional broadband will surprise<br />
on the upside, increasing by at least 120% by 2010.Our new assumptions result in<br />
2008E revenue of $11.4 bln and EBITDA of $5.8 bln, which are 10% and 18%<br />
higher than the combined market consensus for VIP and GLDN.<br />
Integra INTE $21.5 64% The Russian OFS industry is entering a period of strong secular growth fueled by a<br />
number of long-term trends specific to the Russian oil industry. Integra is<br />
excellently placed to capitalize on these factors with an aggressive, well-balanced<br />
management team; a large asset base and experienced workforce to support its<br />
further expansion; and relatively significant financial resources at management’s<br />
disposal. The current '07 EV/EBITDA multiple of 10x is on par with that of global<br />
peers, but taking into consideration Integra's very rapid growth (EBITDA tripled yo-y<br />
in 1H07) we believe the stock trades at very attractive levels.<br />
Aeroflot AFLT $4.88 35% As Russia’s national carrier, Aeroflot benefits from bilateral agreements with<br />
international markets and receives all of the country’s estimated $300 mln in<br />
annual flyover fees. Synergies from joining SkyTeam will increasingly improve the<br />
business through route optimization and booking strategies such as code sharing<br />
between members. In a tight market for planes and staff, Aeroflot has an<br />
advantage over its smaller, less prestigious players. In our view, the company is<br />
led by a professional management team and sets the industry standard in terms of<br />
financial disclosure, having issued accounts according to IFRS for more than 5<br />
years.<br />
Sistema-HALS HALS $12.0 40% Sistema-HALS has managed to double its portfolio value in its first twelve months<br />
as a public company, while the stock has struggled and currently trades below<br />
November’s IPO price. In our view, the company has balanced exposure to all real<br />
estate development sectors and access to a steady future pipeline, and it should<br />
benefit from the diversified interests of parent company AFK Sistema. Risks in the<br />
story include the unclear status of key projects linked to the parent company<br />
(Detsky Mir, MGTS), a growing number of project delays, over-reliance on the<br />
Moscow market, aggressive yield compression already priced into the independent<br />
appraiser’s valuation, and general negative investor sentiment towards the stock.<br />
Sberbank<br />
UKRAINE<br />
SBER $5.05 28% Sberbank is the most liquid proxy for Russia’s rapidly expanding economy and<br />
improving living standards. It benefits directly from upgrades in Russia’s sovereign<br />
rating. The bank has shown revenue-driven growth based on diversified exposure to<br />
corporate and retail lending. Sberbank is keeping a strong presence on all markets. It<br />
maintains 33% of the retail lending market and 54% of retail deposits. Very impressive<br />
2006 IFRS results are backed with robust revenue flow.<br />
Alchevsk Metals Plant ALMK $0.18 55% ALMK is poised for a 60% increase in steel output in 2008 and another 20% rise in<br />
2009-2010. With finalized iron ore contracts that cover 100% of its needs in early<br />
2008, it will likely deliver on production targets. In addition to the steel production<br />
hike, rolled product yield should increase to 96% from 90% in 2007 and gas<br />
consumption will be slashed 6x by 2010, which should decrease the share of gas<br />
in COGS from 7% to just 2% in 2010 and insulate ALMK from gas price growth.<br />
Stirol STIR $37.5 66% Stirol is Ukraine’s major private nitrogen fertilizer producer. Its consolidated 1H07<br />
results showed sales and net income growth of 41% and 3.6x, respectively,<br />
revealing that the stock has more fundamentals for price discovery than just the<br />
natural gas factor. Rising natural gas prices are more than offset by continued<br />
appreciation of nitrogen fertilizers, leaving enough room for pricing in Stirol’s<br />
efficency and consolidation.<br />
Luganskteplovoz<br />
KAZAKHSTAN<br />
LTPL $1.90 42% LTPL is restoring its optimal production level faster than we previously expected. The<br />
order book should hit $145 mln in 2007 and grow 7.2x to $1,050 mln by 2012. We have<br />
increased our 12M target price to $1.9/share and reiterated our BUY rating, as LTPL will<br />
likely reappear as the dominant supplier of locomotives in the CIS in our forecast period.<br />
BMB Munai KAZ $12.3 134% This promising E&P play intends to raise production via enlargement of its contract area if<br />
its current exploration program and undergoing audit according to Western criteria (Aksaz-<br />
Dolinnoe-Emir block of fields in the Caspian Sea region) bear fruit. In addition, BMB Munai<br />
management has developed a good relationship with the Kazakh authorities, which we<br />
view as an advantage. The stock is still 33% below the April 19 level, which we see as a<br />
local peak for Kazakh equities.<br />
2<br />
Source: Alfa Bank Research<br />
For more information, please contact the Alfa Bank sales team at (+7 495) 795-3712<br />
The <strong>Morning</strong> <strong>Brief</strong><br />
January 25, 2008
RUSSIAN MARKET<br />
Russian equity market<br />
2700<br />
2600<br />
2500<br />
2400<br />
2300<br />
2200<br />
2100<br />
2000<br />
1900<br />
1800<br />
1700<br />
1600<br />
14 Nov<br />
Index<br />
20 Nov<br />
Source: RTS, MICEX, Bloomberg<br />
Market Comment<br />
26 Nov 30 Nov 6 Dec 12 Dec 18 Dec 24 Dec 28 Dec 14 Jan<br />
RTS vol MICEX vol ADR vol RTS Index ($) MICEX Index (Rur) RTS2<br />
The <strong>Morning</strong> <strong>Brief</strong><br />
January 25, 2008<br />
Equities<br />
18 Jan<br />
$ mln<br />
9500<br />
9000<br />
8500<br />
8000<br />
7500<br />
7000<br />
6500<br />
6000<br />
5500<br />
5000<br />
4500<br />
4000<br />
3500<br />
3000<br />
2500<br />
2000<br />
1500<br />
1000<br />
500<br />
0<br />
24 Jan<br />
Paging Inspector Clouseau<br />
Can we blame the French? That is the question being asked after yesterday’s<br />
shocking announcement that Société Générale has suffered over €4.9 bln in<br />
losses from a single rogue trader. SocGen’s top management found out about<br />
the massive fraud the weekend prior to the sell-off, and the bank’s rapid<br />
unwinding of very large positions last week may have, at the very least,<br />
exacerbated the sharp declines in Europe. It has also emerged that the Fed<br />
was not aware of SocGen’s losses when it announced its emergency 75 bpt<br />
rate cut earlier this week, and that it had interpreted global market declines as<br />
being purely a reflection of a rapidly weakening economy.<br />
What does this mean for markets going forward? First, it indicates that the<br />
changes in near-term US interest rates could be smaller. Fed funds futures<br />
now show a 75% chance of a further 50 bpt reduction at next week’s meeting<br />
vs. 100% just a day ago. Second, it may be encouraging to some that the<br />
massive selling seen in Europe in the first half of the week was apparently not<br />
being driven primarily by credit-related losses. Perhaps cold comfort, but<br />
nonetheless a factor to take into account when gauging sentiment going<br />
forward.<br />
In local trade, after opening higher with a gap of around 3.5%, the RTS index<br />
paused for consolidation yesterday before heading higher later in the session<br />
as European bourses rallied strongly. At the close the RTS was up 5.2% at<br />
1,988, while MICEX gained 5.8% to 1,662. Large cap gains were<br />
spearheaded by LUKoil (+9.9%), MTS locals (+8.2%), Sberbank (+7.9%),<br />
Surgutneftegaz (+7.9%), Rosneft (+5.6%), Norilsk Nickel (+5.4%), UES<br />
(+5.1%) and Gazprom (+5.0%) and VTB (+4.7%).<br />
The best performer in the mid-cap segment was Uralkali (+14.5%), with<br />
Uralsvyazinform (+12.9%), Raspadskaya (+8.3%) and Sistema locals (+6.2%)<br />
also recording large rebounds. In general, however, mid-caps took a back<br />
11000<br />
10500<br />
10000<br />
3
4<br />
The <strong>Morning</strong> <strong>Brief</strong><br />
January 25, 2008<br />
Equities<br />
seat to the surge in the blue chips, with the RTS-2 index gaining just 1.5% to<br />
2,437.<br />
At the open of US trade, investors remained optimistic that a bond insurer<br />
bailout plan was in the works. Weekly jobless claims came in at 301,000,<br />
lower than the expected reading of 320,000 and below the typical<br />
recessionary levels of over 450,000. Existing home sales at 4.89 mln were<br />
only slightly below the consensus expectation of 4.95 mln. After managing to<br />
stay in positive territory most of the session, the three main US indexes closed<br />
with healthy gains (Dow +0.9%, S&P 500 +1.0%, Nasdaq +1.9%).<br />
In commodities trade, metals prices continue to rebound on LME in response<br />
to the latest Chinese growth figures and easing concern about global growth.<br />
Yesterday copper gained 2.2%, nickel rose 1.3% and zinc added 2.1%. The<br />
price of gold rebounded smartly to $912/oz on COMEX on the view that falling<br />
US interest rates could hurt the dollar and stoke inflation. A weaker dollar is<br />
also a bullish catalyst for the oil price, which jumped $2.42 on NYMEX to back<br />
above the $90/bbl level.<br />
According to the latest fund flow data from EPFR Global, Russia posted the<br />
smallest weekly outflow among all categories we track. While Russia funds<br />
lost $98 mln in the week to January 23, Brazil lost $169 mln, BRIC $685 mln,<br />
India $848 mln, China + Greater China $2,091 mln, and GEM a whopping<br />
$3,057 mln. Global funds saw a massive outflow of $5,890 mln as investors<br />
sought safe havens and generally fled EM equities.<br />
Russia’s clear outperformance in terms of fund flows suggests that investors<br />
resisted the temptation to cut and run during the recent downturn in EM<br />
markets and instead maintained their focus on the country’s compelling<br />
macroeconomic, growth and political stories as well as cheap valuations.<br />
Although delayed redemptions from closed-end funds may yet be in the<br />
pipeline, which could show up closer to quarter’s end, this initial data is very<br />
encouraging from the standpoint of foreign portfolio investment in the postcorrection<br />
period.<br />
Macroeconomics<br />
Ronald P. Smith Head of Research (+7 495) 783-5005<br />
Erik DePoy Mid-Cap Strategist (+7 495) 789-8518<br />
CPI Inflation reaches 1.8% in first three weeks of year; NEGATIVE<br />
CPI inflation reportedly reached 1.8% in the first three weeks of January,<br />
exceeding the 1.7% posted in January 2007.<br />
This figure suggests that January CPI growth will be at least 2%. Given the<br />
increases in natural monopolies’ tariffs and global food inflation, as well as the<br />
increased budgetary spending of late last year, the government’s inflation<br />
forecast of 8.5% for this year already sounds unrealistic.<br />
The monetary authorities are expected to continue supporting banks to avoid<br />
a shortage of banking liquidity. Therefore, in our view the full-year figure will<br />
reach 10.5% at best (please refer to our macroeconomic report issued<br />
yesterday, “Russia 2008: Growth Financed from the State Coffers?”).<br />
Natalia Orlova Senior Analyst (+7 495) 795-3677<br />
Olga Naydenova Analyst (+7 495) 755-5931
SBER BUY<br />
Closing Price: $3.86<br />
Target Price: $5.05<br />
Upside: 31%<br />
GAZP BUY<br />
Closing Price: $12.5<br />
Target Price: $22.00<br />
Upside: 76%<br />
Banking<br />
The <strong>Morning</strong> <strong>Brief</strong><br />
January 25, 2008<br />
Equities<br />
Sberbank expected to post strong 9M07 IFRS, $3.25 bln net profits<br />
Today, Sberbank is expected to release 9M07 IFRS results, which we believe<br />
will be quite strong. We expect the bank to post $3.25 bln in net profit,<br />
including $1.4 bln in 3Q07 alone. Net interest income is expected to show a<br />
stable growth rate, delivering $2.4 bln for 3Q07. The strong profitability in the<br />
third quarter was mainly the result of $0.9 bln from non-interest income.<br />
For 9M07, we expect the bank to have made $2.3 bln in non-interest income,<br />
or 26% of total revenues. We also believe the bank was probably able to<br />
control costs at $4.9 bln.<br />
Figure 1: Sberbank key financials, $ mln<br />
2006 1H07 9M07F 2007F<br />
Net interest income 7,197 4,256 6,696 9,102<br />
Net fees income 1,842 1,113 1,773 2,404<br />
Total non-interest income 2,664 1,387 2,310 3,278<br />
Operating expenditures -5,340 -3,271 -4,870 -6,835<br />
Net profit 3,047 1,840 3,251 4,584<br />
Total assets<br />
Source: Company data, Alfa Bank Research<br />
131,662 165,869 177,215 197,231<br />
Sberbank managed to accelerate its lending growth substantially in October-<br />
November, during the liquidity crunch, and by the end of 2007 had raised its<br />
share of the corporate lending market to 35% from 32% at the beginning of<br />
the year. We believe this strong growth will help the bank deliver profit growth<br />
in 2008 that is much higher than the currently expected 20% y-o-y. We<br />
reiterate our BUY rating for the bank with a 12-month target price of $5.05.<br />
Oil & Gas<br />
Natalia Orlova Senior Analyst (+7 495) 795-3677<br />
Olga Naydenova Analyst (+7 495) 755-5931<br />
Russian authorities drafting proposals to allow undiscriminated access<br />
to gas transportation facilities; NEUTRAL<br />
Yesterday the Federal Antimonopoly Service (FAS) approved the draft version<br />
of an order allowing undiscriminated access to gas transportation capacities.<br />
Next week the draft will be discussed with representatives of Gazprom, and it<br />
is expected to be submitted to the government at the end of 1Q08.<br />
Until now, access to gas transportation capacities has been regulated by<br />
contracts with Gazprom in accordance with the gas monopoly’s internal<br />
procedures. The document in question aims to make the process more<br />
transparent describing all of necessary procedures in detail.<br />
The draft version establishes timelines and a limited list of documents to be<br />
filed when requesting gas transportation services or joining the gas<br />
transportation network. If all the required documents are submitted, the<br />
operator of gas transportation capacities can neither refuse to accept the<br />
request nor demand additional documents.<br />
On receiving the request, the operator either accepts it or reasonably refuses<br />
it, notifying the applicant of the result in either case. If a refusal is<br />
unreasonable or the operator fails to conclude a contract to provide gas<br />
transportation services, the decision can be appealed in court. The draft<br />
version of the order also explicitly prohibits the entity operating gas<br />
transportation capacities to force applicants that are not the operator’s<br />
subsidiaries to transfer property in favor of the latter.<br />
5
6<br />
The <strong>Morning</strong> <strong>Brief</strong><br />
January 25, 2008<br />
Equities<br />
The draft order on undiscriminated access to unutilized gas transportation<br />
capacities aims to provide equal rights to entities using gas transportation<br />
services. However, it stipulates that in the event of a capacity deficit,<br />
applicants supplying gas for state, communal or social needs will take<br />
precedence over the rest. In reality, therefore, the document favors Gazprom<br />
and Itera, which supplies consumers in the Sverdlovsk region.<br />
A further limitation of the draft is that the entity operating gas transportation<br />
capacities also decides on the availability of spare capacities, which<br />
effectively leaves in place the current situation allowing multiple opportunities<br />
for Gazprom to discriminate against independent gas producers.<br />
Although the proposals in question should improve the disclosure of<br />
information on Gazprom’s gas transportation capacities, unless the shortage<br />
of gas transportation facilities in Russia is addressed, Gazprom’s current<br />
operations and behavior will hardly change.<br />
We see this news as NEUTRAL for Gazprom and retain our BUY rating for the<br />
stock with a 12-month target price of $22/share.<br />
Konstantin Batunin Analyst (+7 495) 786-4876<br />
Natalia Pushkina Analyst (+7 495) 785-9568
DNON BUY<br />
Closing Price: $162.6<br />
Target Price: $364<br />
Upside: 124%<br />
UKRAINIAN MARKET<br />
Ukrainian equity market<br />
1 300<br />
1 200<br />
1 100<br />
1 000<br />
900<br />
800<br />
Index<br />
The <strong>Morning</strong> <strong>Brief</strong><br />
January 25, 2008<br />
Equities<br />
$ mln<br />
700<br />
0<br />
15 Nov 21 Nov 27 Nov 03 Dec 07 Dec 13 Dec 19 Dec 25 Dec 08 Jan 14 Jan 18 Jan 24 Jan<br />
Source: Bloomberg, PFTS<br />
Market Comment<br />
Volume, $ mln PFTS KAC20 re-based<br />
PFTS bounces back<br />
The PFTS Index followed world trends and bounced back by 3.3% on<br />
Thursday. Sizable funds of free money chased seemingly undervalued stocks<br />
after four consecutive days of corrections fueled market volatility. However,<br />
the nature of the recovery was rather speculative as fundamentally the<br />
prospects of the world economy are far from optimistic. From this vantage<br />
point, it is rather difficult to expect the rebound to last long.<br />
As if confirming increased volatility, the most speculative stocks, or those with<br />
the weakest association between stock price dynamics and company<br />
performance, showed the strongest returns during the day, i.e. Mariupol<br />
Heavy Machinery Plant (+8.7%) and Azovzagalmash (+8.8%). After publishing<br />
respectable unaudited IFRS financial highlights for 2007 in the middle of this<br />
recent correction, Stirol (+5.8%) moved closer toward pricing in the disclosed<br />
operating results. Steel companies advanced on strong industry fundamentals<br />
and expected concentration of major players, with Enakievo Metals Plant<br />
(+5.4%), Alchevsk Metals Plant (+4.1%), and Azovstal (+4.4%) all advancing.<br />
Ukrsotsbank (+5.7%) gained on news of its completed sale, while its peer<br />
Raiffeisen Bank Aval (+5.5%) followed closely behind.<br />
Utilities<br />
Denis Shauruk Analyst (+380 44) 490-1721<br />
Dniprooblenergo increases net income by 40% in 2007; POSITIVE<br />
CEO Eduard Sokolovsky announced that Dniprooblenergo increased net<br />
income to $5.5 mln, a 40% increase y-o-y. He also mentioned that DNON’s<br />
payment rate to the power pool was 101.7% and that he expected another<br />
36% increase in DNON’s net profit in 2008.<br />
80<br />
70<br />
60<br />
50<br />
40<br />
30<br />
20<br />
10<br />
7
SGOK N/R<br />
Closing Price: $3.12<br />
Target Price: N/R<br />
Upside: N/A%<br />
CGOK N/R<br />
Closing Price: $1.50<br />
Target Price: N/R<br />
Upside: N/A%<br />
8<br />
The <strong>Morning</strong> <strong>Brief</strong><br />
January 25, 2008<br />
Equities<br />
In our view, the declared payment rate does not allow for DNON to reduce its<br />
debt, which is the second largest in the sector. However, given that the state’s<br />
bankruptcy moratorium for energy companies is still in place, we view this<br />
improvement in DNON’s performance as POSITIVE for the company’s<br />
investment case.<br />
Metals & Mining<br />
Maksym Nikulyak Analyst (+380 44) 490-1620<br />
Kateryna Ruskykh Analyst (+380 44) 490-1660<br />
MMKI to cover 100% of its iron ore concentrate needs in 2008-2010;<br />
POSITIVE<br />
Metinvest will supply 8 mmt of iron concentrate annually to Mariupol Metals<br />
Plant n.a. Ilich (MMKI) in 2008-2010 as stipulated in a three-year contract<br />
between the two companies. In addition, 1.4-1.5 mmt of sinter (or 11% of<br />
MMKI’s sinter output) produced by MMKI, with concentrate supplied by<br />
Metinvest, will be delivered to Metinvest-affiliated steel plants, i.e. Azovstal,<br />
ENMZ and Makeyevka Steelworks.<br />
The news is very POSITIVE for MMKI as the agreed upon amount of iron ore<br />
exceeds MMKI’s iron ore concentrate consumption in 2007 (7.8 mmt), which<br />
implies more than 100% coverage of MMKI’s concentrate needs for the next<br />
three years. This also means that MMKI will achieve this without importing<br />
iron ore concentrate from Russia (1.5 mmt in 2007), thereby saving on<br />
transportation costs. The deal between MMKI and Azovstal over sinter supply<br />
points should also develop closer cooperation between the two groups.<br />
SGOK and CGOK to post strong growth in 2007 net income; POSITIVE<br />
Metinvest announced that Pivnichny GOK (SGOK) should raise 2007 net<br />
income by 133% y-o-y to $364 mln, implying an estimated net income margin<br />
of 25% (+6 ppt y-o-y). Tsentralny GOK also expects to increase net income by<br />
121% to $123 mln in 2007, yielding an expected net income margin of 23%<br />
(+8 ppt y-o-y). We attribute these strong results to favorable iron ore market<br />
conditions throughout 2007.<br />
Metinvest plans to increase CAPEX for these two companies by 25% to<br />
$321 mln in 2008. We expect iron ore output in 2008 will stay flat, with 0% and<br />
2% growth anticipated at CGOK and SGOK, respectively. SGOK is planning<br />
to add another 2-2.5 mmt of pellets in 2009, which is about 20% of total<br />
current output, after launching a new pelletizing line in 1Q09. The outlook for<br />
GOKs is very POSITIVE as iron ore prices look to grow 40-50% this year.<br />
Both companies have reportedly increased prices by 10% for 1Q08 and<br />
should raise the price beginning in 2Q08 when the results of international ore<br />
price negotiations become known.<br />
Metinvest to cooperate with Evraz Group at Pivdenny GOK; POSITIVE<br />
Alexander Vilkul, the head of Metinvest’s mining division, said that Metinvest<br />
and Evraz Group, which recently acquired about 50% of Pivdenny GOK<br />
(PGZK), will sign a transparent agreement governing their cooperation at the<br />
plant. He also said that Metinvest and Smart Group have agreed that<br />
Metinvest will acquire 25% of PGZK, while Smart Group will control the rest.<br />
We think that an amicable agreement between the two largest shareholders is<br />
POSITIVE for minority shareholders in PGZK.<br />
Oleh Yuzefovych Analyst (+380 44) 490-1617
XXIC N/R<br />
Closing Price: $23.4<br />
Target Price: N/A<br />
Upside: N/A<br />
Real Estate<br />
The <strong>Morning</strong> <strong>Brief</strong><br />
January 25, 2008<br />
Equities<br />
XXI Century postpones SPO in Warsaw indefinitely; NEUTRAL<br />
XXI Century, a leading real estate developer in Ukraine, announced that it<br />
would postpone indefinitely conducting an SPO in Warsaw in 1Q08. The<br />
company’s Chairman Lev Partskhaladze noted in a press release that now<br />
that markets have fallen, the new share issue is not in the best interest of<br />
shareholders. In our view, this makes a great deal of sense, as the stock price<br />
of XXI Century fell 16% over the last five days due to the current stock market<br />
crisis worldwide.<br />
We believe this news is NEUTRAL for XXI Century. On one hand, the<br />
company needs capital to finance growth, but with the current market<br />
situation, the placement is not likely to be successful.<br />
Andriy Gubachov Analyst (+380 44) 490-1600<br />
9
10<br />
KAZAKH MARKET<br />
Kazakh equity market<br />
KASE Index<br />
3 000<br />
2 900<br />
2 800<br />
2 700<br />
2 600<br />
2 500<br />
2 400<br />
2 300<br />
2 200<br />
2 100<br />
2 000<br />
15 Nov<br />
21 Nov<br />
27 Nov<br />
3 Dec<br />
Source: Kazakh Stock Exchange, Irbis<br />
Metals & Mining<br />
7 Dec<br />
The <strong>Morning</strong> <strong>Brief</strong><br />
January 25, 2008<br />
13 Dec<br />
24 Dec<br />
28 Dec<br />
Volume, $ mln KASE_Shares<br />
8 Jan<br />
14 Jan<br />
18 Jan<br />
Equities<br />
$ mln<br />
100<br />
90<br />
80<br />
70<br />
60<br />
50<br />
40<br />
30<br />
20<br />
10<br />
0<br />
24 Jan<br />
Hambledon Mining back on track to achieving 2008 target output<br />
Hambledon Mining has reported that the technical problems that arose at both<br />
of its newly launched operations – an ore-processing plant at Ognevka<br />
(copper, gold and silver-containing residues from zinc smelters) and another<br />
treatment plant at the Sekisovskoye gold mine, both located close to Ust<br />
Kamenogorsk, in eastern Kazakhstan – have now been resolved and the<br />
plants are working normally.<br />
The management says the plant at Ognevka is now processing 20 metric tons<br />
of ore per hour, a figure that should increase to 30 mt per hour starting in<br />
February. This suggests that the company will achieve its goal for the initial<br />
phase of 150,000 mt per year and generate over $11 mln in revenues.<br />
At the Sekisovskoye plant, the crushing and milling sections are now<br />
operating satisfactorily, and its throughput design level of 850,000 mt per year<br />
is expected to be achieved by the end of January. We note that the initial<br />
production from the open pit is expected to be around 40,000 oz per year,<br />
rising to over 100,000 oz as underground ore is substituted.<br />
In our view, as a turnaround play, Hambledon has a good chance to unlock its<br />
value as it begins to transform from a junior gold prospector into a producing<br />
company, with both the Sekisovskoye and Ognevka plants expected to<br />
become fully operational in late 2008.<br />
Hambledom Mining is one of the stocks that we picked for our Kazakh model<br />
portfolio last November with an initial weighting of 3.6%.<br />
Rinat Gainoulline Analyst (+7 495) 795-3744
RUSSIAN MARKET TABLES<br />
The <strong>Morning</strong> <strong>Brief</strong><br />
January 25, 2008<br />
Equities<br />
Figure 2: Most liquid stocks performance<br />
RTS MICEX<br />
Close* Change Volume* YTD Close* Change Volume* YTD Mcap 12 M TP Upside Rating<br />
$ % $/1000 % $ % $/1000 % $ mln $ %<br />
Gazprom 12.50 5.0 15 653 -11 12.54 3.3 1 407 303 -10 295 919 22.0 76 BUY<br />
LUKoil 70.80 9.9 7 363 -19 70.77 7.4 403 681 -16 60 220 U/R N/A U/R<br />
Gazpromneft 5.00 N/T N/T -21 5.36 7.1 11 447 -14 23 706 U/R N/A U/R<br />
Rosneft 7.55 5.6 1 562 -21 7.59 4.2 122 022 -20 80 016 U/R N/A U/R<br />
Surgutneftegaz 0.95 3.3 952 -23 0.97 5.2 101 837 -20 33 940 U/R N/A U/R<br />
TNK-BP 1.68 8.4 1 425 -25 N/T N/T N/T N/A 26 623 U/R N/A U/R<br />
Tatneft 5.00 4.0 1 200 -17 5.07 5.5 35 698 -16 10 893 U/R N/A U/R<br />
Novatek 7.33 N/T N/T -2 7.29 2.4 5 868 -3 22 256 9.88 35 BUY<br />
UES 1.09 5.1 10 742 -17 1.10 5.0 168 391 -15 44 859 1.90 74 BUY<br />
Mosenergo (TGK-3) 0.23 N/T N/T -5 0.22 3.2 722 -7 8 944 0.23 2 HOLD<br />
Irkutskenergo 1.00 1.0 7 -16 1.02 1.4 587 -15 4 743 1.14 15 HOLD<br />
TGK-1 0.00120 N/T N/T -5 0.00120 1.4 1 -8 3 510 0.00141 18 HOLD<br />
OGK-1 0.11 N/T N/T -7 0.16 N/T 19 N/A 5 089 0.117 3 HOLD<br />
OGK-2 0.13 N/T N/T -16 N/T N/T N/T N/A 3 443 0.171 32 BUY<br />
OGK-3 0.137 N/T N/T -10 0.132 0.9 74 -12 6 506 0.170 24 BUY<br />
OGK-4 0.132 N/T N/T -1 0.134 0.3 125 0 6 461 0.101 -23 SELL<br />
OGK-5 0.175 N/T N/T 0 0.178 0.2 2 617 1 6 190 0.151 -14 SELL<br />
OGK-6 0.110 N/T N/T -14 0.000 N/T N/A N/A 2 940 0.170 55 BUY<br />
MTS 13.15 8.2 2 248 -14 13.24 7.4 25 339 -14 26 212 20.4 55 BUY<br />
Rostelecom 11.25 4.2 224 -4 11.37 5.1 27 491 -4 8 198 2.39 -79 SELL<br />
Comstar-UTS N/T N/T N/T N/A N/T N/T N/T N/A N/A 12.1 N/A HOLD<br />
Sitronics 0.12 N/T N/T -4 N/T N/T N/T N/A 924 N/R N/A N/R<br />
MGTS 34.60 N/T N/T 2 33.17 0.0 N/A -4 2 762 36.50 5 BUY<br />
Center Telecom 0.84 N/T N/T -10 0.82 -1.6 351 -8 1 326 0.80 -5 HOLD<br />
NW Telecom 1.47 N/T N/T -14 1.48 -1.3 667 -15 1 295 1.60 9 HOLD<br />
South Telecom 0.170 N/T N/T -14 0.171 0.7 197 -12 503 0.140 -18 SELL<br />
Volga Telecom 4.65 -2.1 47 -21 4.77 4.0 463 -19 1 144 8.10 74 BUY<br />
Siberia Telecom 0.098 N/T N/T -19 0.099 2.8 1 558 -15 1 171 0.148 52 BUY<br />
Uralsvyazinform 0.053 12.9 53 -17 0.052 6.5 12 531 -16 1 696 0.075 43 HOLD<br />
FE Telecom 5.00 N/T N/T -6 5.10 2.9 68 -5 478 5.50 10 BUY<br />
Severstal 21.20 0.5 212 -7 21.52 3.5 4 413 -6 19 733 U/R N/A U/R<br />
NLMK 3.45 N/T N/T -14 3.67 5.4 2 867 -10 20 677 U/R N/A U/R<br />
MMK 1.05 N/T N/T -19 1.08 0.8 9 031 -17 11 733 N/R N/A N/R<br />
Norilsk Nickel 226.00 5.4 4 527 -15 228.31 5.9 505 733 -14 41 381 303 34 HOLD<br />
Polyus 47.50 N/T N/T 3 50.19 3.0 51 067 9 9 055 58.80 24 BUY<br />
Polymetal 7.70 -1.3 116 9 8.39 5.4 2 243 19 2 118 N/R N/A N/R<br />
TMK 9.75 2.6 146 -11 9.78 0.8 208 -12 8 512 N/R N/A N/R<br />
AvtoVAZ 1.82 N/T N/T 1 1.86 0.0 587 -2 4 949 N/R N/A N/R<br />
Sberbank 3.95 7.9 32 800 -6 3.90 6.2 365 459 -7 85 268 5.05 28 BUY<br />
VTB 0.0042 0.0 42 -17 0.0042 3.9 120 066 -18 28 241 0.0059 40 BUY<br />
Source: RTS, MICEX, Bloomberg, Alfa Bank Research<br />
11
12<br />
The <strong>Morning</strong> <strong>Brief</strong><br />
January 25, 2008<br />
Equities<br />
Figure 3: Local share price performance<br />
RTS MICEX<br />
Close* Change Volume* YTD Close* Change Volume* YTD Mcap 12 M TP Upside Rating<br />
$ % $/1000 % $ % $/1000 % $ mln $ %<br />
MOESK 0.109 N/T N/T 4 0.103 1.9 415 2 3 079 0.155 51 BUY<br />
MGESK 0.090 1.1 135 0 0.091 4.4 311 9 2 542 0.130 43 BUY<br />
TGK-2 0.00094 N/T N/T -6 0.00087 1.4 15 -11 1 041 0.00103 18 HOLD<br />
TGK-4 0.00110 N/T N/T -11 0.00109 1.9 237 -9 1 453 0.00127 17 HOLD<br />
TGK-5 0.00084 N/T N/T -8 0.00089 3.8 808 -1 1 033 0.00151 70 BUY<br />
TGK-6 0.00100 N/T N/T -12 0.00103 3.7 262 -8 1 290 0.00133 29 BUY<br />
TGK-8 0.00138 N/T N/T -1 0.00140 0.3 87 2 1 899 0.00130 -7 HOLD<br />
TGK-9 0.00029 N/T N/T -9 0.00030 1.4 148 -7 1 652 0.00028 -7 HOLD<br />
TGK-10 3.8 N/T N/T -8 3.5 -2.9 32 -11 1 622 4.0 14 HOLD<br />
Kuzbassenergo 2.52 N/T N/T -8 2.6 4.1 9 -7 1 528 3.5 37 BUY<br />
TGK-13 N/T N/T N/T N/A N/A N/A N/A N/A N/A N/A N/A N/A<br />
TGK-14 0.0003 N/T N/T 0 0.0003 2.7 74 -9 232 0.00037 19 HOLD<br />
Bashkirenergo 2.06 N/T N/T -4 N/T N/T N/T N/A 2 143 2.90 41 BUY<br />
Novosibirskenergo 54.0 N/T N/T 8 N/T N/T N/T N/A 730 93.30 73 BUY<br />
Megionneftegaz 35.0 N/T N/T -13 33.5 3.8 39 -13 3 482 58.16 66 HOLD<br />
RITEK 9.85 N/T N/T -3 9.2 1.2 263 -8 983 9.17 -7 HOLD<br />
Bashneft 14.5 N/T N/T -12 N/T N/T N/T N/A 2 467 20.54 42 BUY<br />
Ufaneftekhim 3.55 N/T N/T 3 N/T N/T N/T N/A 977 6.43 81 BUY<br />
Ufa Refinery 1.90 N/T N/T -2 N/T N/T N/T N/A 1 036 4.24 123 BUY<br />
Novoil 1.51 N/T N/T 6 N/T N/T N/T N/A 1 200 2.42 60 BUY<br />
NizhegorodNOS 62.0 N/T N/T 2 N/T N/T N/T N/A 1 110 104.7 69 BUY<br />
Moscow Refinery 100.0 N/T N/T -13 N/T N/T N/T N/A 591 335.0 235 BUY<br />
SalavatNOS 91.0 -1.1 18 10 N/T N/T N/T N/A 1 688 106.4 17 BUY<br />
YaroslavNOS 1.0 N/T N/T 0 N/T N/T N/T N/A 933 1.89 89 HOLD<br />
RBC 9.3 N/T N/T -11 9.6 1.7 1 228 -8 1 109 U/R N/A U/R<br />
VSMPO 257 N/T N/T -15 260.4 -2.6 550 -18 2 963 U/R N/A U/R<br />
Chelyabinsk Zinc 10.0 3.1 10 N/A N/T N/T N/T N/A 542 18.0 80 BUY<br />
Priargunsk Mining 531 N/T N/T N/A N/T N/T N/T N/A 905 1 000 88 BUY<br />
Raspadskaya 5.85 8.3 202 -10 6.0 9.9 2 410 -8 4 575 N/R N/A N/R<br />
Chelyabinsk Pipe 3.90 1.3 79 -7 N/T N/T N/T N/A 1 842 U/R N/A U/R<br />
Vyksa Pipe 2 080 N/T N/T 0 N/T N/T N/T N/A 3 915 U/R N/A U/R<br />
Uralkali 7.10 14.5 383 -9 N/T N/T N/T N/A 15 083 9.20 30 BUY<br />
Silvinit 915 N/T N/T 4 N/T N/T N/T N/A 7 161 1 310 43 BUY<br />
Lengazspetsstroi 4 000 N/T N/T -29 N/T N/T N/T N/A 202 6 800 70 BUY<br />
Irkut 0.88 N/T N/T -8 0.849 4.2 368 -9 856 N/R N/A N/R<br />
OMZ 7.00 N/T N/T -7 7.15 3.0 14 -9 248 N/R N/A N/R<br />
Power Machines 0.202 N/T N/T 0 N/T N/T N/T N/A 1 458 N/R N/A N/R<br />
Aeroflot 3.62 2.8 119 -3 3.68 4.9 1 458 -3 4 020 4.88 35 BUY<br />
UTair 0.73 N/T N/T -1 N/T N/T N/T N/A 418 0.97 34 BUY<br />
S7 4 100 N/T N/T 4 N/T N/T N/T N/A 420 5 537 35 BUY<br />
KrasAir 290 N/T N/T N/A N/T N/T N/T N/A 136 U/R N/A U/R<br />
Baltika 48.8 N/T N/T -3 46.0 -0.5 255 -6 7 875 60 23 BUY<br />
Lebedyansky 83.5 1.1 164 -9 N/T N/T N/T N/A 1 704 100 20 BUY<br />
Seventh Continent 26.1 N/T N/T 1 26.40 -1.4 944 1 1 954 23.3 -11 SELL<br />
Kalina 34.8 N/T N/T -14 33.69 0.1 85 -17 339 U/R N/A U/R<br />
Pharmacy 36'6 61.3 N/T N/T -16 62.9 1.1 46 -13 490 U/R N/A U/R<br />
Razgulyai Group 7.20 N/T N/T 6 7.8 3.8 303 17 763 N/R N/A N/R<br />
Wimm-Bill-Dann 83.0 N/T N/T -8 85.2 2.3 231 -5 3 652 98 18 BUY<br />
Open Investments 285 1.6 924 -8 N/T N/T N/T N/A 3 286 355 25 BUY<br />
Veropharm 46.0 N/T N/T -13 N/T N/T N/T N/A 460 N/R N/A N/R<br />
Magnit 47.0 3.8 3 054 -7 47.0 0.8 1 845 -9 3 384 55.0 17 BUY<br />
UralSib 0.019 N/T N/T -13 N/T N/T N/T N/A 3 879 0.027 42 SELL<br />
Rosbank 6.90 0.0 138 -7 7.0 -0.5 222 -4 4 967 7.60 10 HOLD<br />
Vozrozhdenie 67.8 N/T N/T 0 69.4 0.6 199 1 1 610 83.0 22 BUY<br />
Bank of Moscow 50.1 N/T N/T -5 47.0 9.5 199 -13 6 507 57.0 21 SELL<br />
Source: RTS, MICEX, Alfa Bank Research; Notes: N/T – not traded, price reflects previous day; * includes quotes and matched transactions
Figure 4: Preferred stock performance<br />
RTS MICEX<br />
Close* Change Volume* YTD Close* Change Volume* YTD Mcap 12 M TP<br />
Equities<br />
Discount to<br />
commons Upside Rating<br />
$ % $/1000 % $ % $/1000 % $ mln $ % %<br />
Bashneft pref 10.60 N/T N/T -4 N/T N/T N/T N/A 367 12.32 -27 16 HOLD<br />
MegionNG pref 19.90 N/T N/T -7 20.42 4.5 24 -6 658 50.75 -43 155 BUY<br />
SurgutNG pref 0.50 -2.0 136 -23 0.50 2.1 49 620 -21 3 851 U/R -47 N/A U/R<br />
Tatneft pref 2.85 1.8 71 -23 2.9 4.5 518 -18 415 2.21 -43 -22 SELL<br />
UES pref 0.90 N/T N/T -25 0.94 5.6 11 234 -17 1 868 1.73 -18 92 BUY<br />
Rostelecom pref 2.00 N/T N/T -35 2.27 9.7 28 290 -21 486 2.02 -80 1 SELL<br />
Transneft pref 1 685 5.3 923 -16 1 687 2.8 10 747 -15 7 860 U/R N/A N/A U/R<br />
Ufaneftekhim pref 1.55 N/T N/T 0 N/T N/T N/T N/A 100 4.80 -56 210 BUY<br />
Ufa Refinery pref 0.94 N/T N/T -8 N/T N/T N/T N/A 70 3.20 -51 240 BUY<br />
Novoil pref 0.75 N/T N/T -5 N/T N/T N/T N/A 59 1.82 -51 144 BUY<br />
Sberbank pref 2.35 N/T N/T -22 2.46 7.3 25 770 -13 2 350 4.29 -41 83 BUY<br />
Baltika pref 30.0 0.0 30 -12 31.2 3.5 21 -8 406 48.0 -38 60 BUY<br />
Priargunsk Mining pref 290 N/T N/T -12 N/T N/T N/T N/A 120 750 -45 159 BUY<br />
Silvinit pref 620 N/T N/T -5 N/T N/T N/T N/A 1 617 904 -32 46 BUY<br />
Source: RTS, MICEX, Alfa Bank Research; Notes: N/T – not traded, price reflects previous day; * includes quotes and matched transactions<br />
Figure 5: ADR/GDR performance<br />
Europe United States Implied<br />
Ratio Close Change Volume YTD Close Change Volume YTD 12 M TP Upside rating<br />
$ % $/1000 % $ % $/1000 % $ %<br />
Gazprom 4 in 1 49.8 4.6 1 098 841 -12 50.2 5.9 155 020 -11 88 77 BUY<br />
LUKoil 1 in 1 70.3 7.8 343 184 -19 70.9 5.7 20 267 -18 U/R N/A U/R<br />
Gazpromneft 5 in 1 26.9 7.2 475 0 27.0 10.8 265 -17 U/R N/A U/R<br />
Rosneft 1 in 1 7.5 3.4 91 689 -23 N/T N/T N/A N/A U/R N/A U/R<br />
Surgutneftegaz 50 in 1 48.5 5.5 43 742 -21 49.0 7.7 234 -19 U/R N/A U/R<br />
Tatneft 20 in 1 99.0 4.2 22 595 -18 N/T N/T N/A N/A U/R N/A U/R<br />
Yukos 4 in 1 N/T N/T N/A N/A N/T N/T N/A N/A Susp N/A SUSP<br />
Novatek 10 in 1 69.3 3.4 46 380 -10 N/T N/T N/A N/A 98.8 43 BUY<br />
Integra 1 in 20 13.1 0.8 6 853 -23 N/T N/T N/A N/A 21.5 64 BUY<br />
UES 100 in 1 109.0 3.8 113 063 -16 110.0 6.0 106 -15 190 74 BUY<br />
Mosenergo 100 in 1 22.3 1.1 N/A -5 23.3 0.0 N/A -1 23 3 HOLD<br />
Irkutskenergo 50 in 1 51.5 1.7 133 -13 60.5 0.0 N/A 16 57 11 HOLD<br />
MTS 5 in 1 N/T N/T N/A N/A 86.6 4.0 179 400 -15 102 18 BUY<br />
VimpelCom 1 in 4 34.2 16.0 454 -23 34.2 5.8 160 687 -18 50 46 BUY<br />
Golden Telecom 1 in 1 103.5 1.1 11 5 101.5 -0.2 75 461 1 U/R N/A U/R<br />
Comstar UTS 1 in 1 10.3 2.5 7 854 -19 N/T N/T N/A N/A 12.1 18 HOLD<br />
Sitronics 50 in 1 6.0 0.0 N/A 4 N/T N/T N/A N/A N/R N/A N/R<br />
Moscow CableCom - N/T N/T N/A N/A N/T N/T N/A N/A N/R N/A N/R<br />
Sistema 1 in 50 37.0 5.1 38 776 -11 N/T N/T N/A N/A 35 -5 HOLD<br />
Rostelecom 6 in 1 67.8 5.9 3 991 -11 68.0 4.6 9 928 -2 14.34 -79 SELL<br />
MGTS 1 in 1 31.7 -0.9 N/A -9 N/T N/T N/A N/A 36.50 15 BUY<br />
Center Telecom 100 in 1 79.0 3.9 N/A -13 N/T N/T N/A N/A 80 1 HOLD<br />
NW Telecom 50 in 1 73.2 0.0 N/A -15 N/T N/T N/A N/A 80 9 HOLD<br />
South Telecom 50 in 1 9.9 0.0 N/A -1 N/T N/T N/A N/A 7.0 -29 SELL<br />
Volga Telecom 2 in 1 9.5 -4.3 N/A -17 10.0 2.6 3 -17 16.20 71 BUY<br />
Siberia Telecom 800 in 1 77.6 -3.6 N/A -18 71.0 0.0 N/A -23 118.4 53 BUY<br />
Uralsvyazinform 200 in 1 10.2 13.1 22 -20 N/T N/T N/A N/A 15.0 47 HOLD<br />
Far East Telecom 30 in 1 153.7 0.0 N/A -5 N/T N/T N/A N/A 165 7 BUY<br />
CTC Media 1 in 1 N/T N/T N/A N/A 26.8 1.1 28 292 -11 N/R N/A N/R<br />
RBC 4 in 1 N/T N/T N/A N/A N/T N/T N/A N/A U/R N/A U/R<br />
Rambler 1 in 1 24.6 -3.0 4 -18 N/T N/T N/A N/A N/R N/A N/R<br />
Norilsk Nickel 1 in 1 227.0 3.9 207 665 -16 N/T N/T N/A N/A 303 33 HOLD<br />
NLMK 10 in 1 36.6 7.6 15 458 -11 N/T N/T N/A N/A U/R N/A U/R<br />
Severstal 1 in 1 21.4 4.4 31 515 -8 N/T N/T N/A N/A U/R N/A U/R<br />
MMK 13 in 1 14.0 5.4 2 951 -17 N/T N/T N/A N/A N/R N/A N/R<br />
Polymetal 1 in 1 7.7 4.1 4 401 8 N/T N/T N/A N/A N/R N/A N/R<br />
TMK 4 in 1 39.0 4.1 17 981 -13 N/T N/T N/A N/A N/R N/A N/R<br />
Polyus 1 in 1 49.0 4.0 27 643 2 49.2 5.9 1 155 4 58.8 20 BUY<br />
OMZ 1 in 1 7.0 0.0 N/A -12 N/T N/T N/A N/A N/R N/A N/R<br />
Celtic Resources - 5.7 N/T N/A 1 N/T N/T N/A N/A 5.10 -11 HOLD<br />
Highland Gold Mining - 3.9 3.2 2 662 25 N/T N/T N/A N/A U/R N/A U/R<br />
Peter Hambro Mining - 26.2 5.3 51 269 8 N/T N/T N/A N/A 25.4 -3 HOLD<br />
Trans-Siberian Gold - 0.4 -1.1 0 -11 N/T N/T N/A N/A N/R N/A N/R<br />
Mechel 3 in 1 N/T N/T N/A N/A 82.9 6.6 96 546 -15 U/R N/A U/R<br />
Evraz 1 in 3 68.2 10.0 67 406 -12 N/T N/T N/A N/A U/R N/A U/R<br />
Chelyabinsk Zinc 1 in 1 9.5 2.9 1 349 -18 N/T N/T N/A N/A 18.0 90 BUY<br />
PIK Group 1 in 1 28.0 1.8 8 989 -8 N/T N/T N/A N/A 35.6 27 BUY<br />
AFI Development 1 in 1 7.4 1.0 9 327 -22 N/T N/T N/A N/A 11.1 51 HOLD<br />
Sistema Hals 1 in 20 8.6 1.2 355 -12 N/T N/T N/A N/A 12.0 40 BUY<br />
RGI International - 8.1 -0.2 559 -16 N/T N/T N/A N/A 12.0 49 BUY<br />
MirLand - 9.0 -0.9 1 502 -12 N/T N/T N/A N/A 14.5 62 BUY<br />
Wimm-Bill-Dann 1 in 1 N/T N/T N/A N/A 116.0 2.7 20 360 -11 140.0 21 BUY<br />
X5 Retail Group 1 in 4 33.3 4.1 7 164 -9 N/T N/T N/A N/A 42.0 26 BUY<br />
Amtel-Vredestein 1 in 1 2.7 1.9 3 -2 N/T N/T N/A N/A U/R N/A U/R<br />
Efes Breweries 5 in 1 30.3 -0.8 16 -11 N/T N/T N/A N/A N/R N/A N/R<br />
Cherkizovo Group 1 in 150 12.5 -9.1 N/A -13 N/T N/T N/A N/A 12.6 1 SELL<br />
The <strong>Morning</strong> <strong>Brief</strong><br />
January 25, 2008<br />
13
14<br />
The <strong>Morning</strong> <strong>Brief</strong><br />
January 25, 2008<br />
Equities<br />
VTB 2000 in 1 8.4 5.4 94 739 -17 N/T N/T N/A N/A 11.8 40 BUY<br />
Source: Bloomberg, Alfa Bank Research; Notes: N/T – not traded, price reflects previous day<br />
Figure 8: Major macroeconomic parameters<br />
Figure 6: RTS Index futures performance<br />
Close Change Maturity<br />
$ %<br />
VEH8 2 026.10 5.80 Mar 08<br />
VEM8<br />
Source: Bloomberg<br />
2 074.50 7.55 Jun 08<br />
Figure 7: Equity futures performance<br />
Close Change Volume Delivery<br />
$ % $/1000<br />
GAZR-03.08 1 259.19 3.06 263 283.87 14.03.2008<br />
LKOH-03.08 711.10 7.16 53 933.05 14.03.2008<br />
EERU-03.08 1 126.04 7.52 14 428.01 14.03.2008<br />
RTKM-03.08<br />
Source: Bloomberg<br />
1 142.69 8.27 277.67 14.03.2008<br />
Unit Current YTD, %<br />
Hard currency reserves $ bln 477.7 0.8<br />
Monetary base (M0) R bln 5 513.3 0.0<br />
R/$ exchange rate R/$ 24.6349 0.4<br />
Inflation, M-o-M<br />
Source: Reuters<br />
% 1.1 11.9<br />
Figure 9: Major commodity prices<br />
Oil, $/barrel (IPE CIF Close Previous Change Change 3 Metals Close Previous Change Change 3<br />
Prices)<br />
close<br />
months<br />
close<br />
months<br />
$ $ % % $ $ % %<br />
Brent, spot 89.33 86.67 3.1 6.1 Gold, $/oz 911.3 912.9 -0.2 18.5<br />
1-month 89.54 89.07 0.5 2.4 Platinum, $/oz 1 617 1 611 0.4 11.6<br />
3-month 88.73 88.37 0.4 2.4 Palladium, $/oz 374.8 373.5 0.3 2.7<br />
Urals 87.27 84.63 3.1 6.8 Nickel, $/ton* 27 250 26 905 1.3 -11.5<br />
WTI 90.06 87.64 2.8 1.1 Copper, $/ton* 7 020 6 870 2.2 -8.7<br />
REBCO 85.58 82.74 3.4 6.3 Zinc, $/ton 2 237 2 188 2.3 -20.7<br />
Source: Bloomberg, NYMEX; Note: N/A – not available<br />
Figure 10: Russian debt market<br />
Maturity Next Coupon<br />
coupon rate<br />
payment<br />
Closing Change YTM Current<br />
price<br />
yield<br />
Duration Spread<br />
over RFR<br />
Issue<br />
volume<br />
% % % % % Years bpts mln<br />
Currency<br />
Sovereigns<br />
Russia-10 03/31/10 03/31/08 8.3 104.5 0.03 4.3 7.9 1.1 193.5 1 538 USD<br />
Russia-18 07/24/18 07/24/08 11.0 145.5 -0.03 5.3 7.6 7.2 159.7 3 467 USD<br />
Russia-28 06/24/28 06/24/08 12.8 183.9 0.00 5.7 6.9 10.5 202.6 2 500 USD<br />
Russia-30 03/31/30 03/31/08 7.5 115.4 -0.12 5.3 6.5 6.9 160.0 2 011 USD<br />
MinFins<br />
MinFin-8 05/14/08 05/14/08 3.0 99.5 0.04 4.6 3.0 0.3 226.8 2 837 USD<br />
MinFin-11 05/14/11 05/14/08 3.0 94.7 0.29 4.8 3.2 3.1 237.4 1 750 USD<br />
Source: Reuters; Note: N/A – not applicable
The <strong>Morning</strong> <strong>Brief</strong><br />
January 25, 2008<br />
Equities<br />
Figure. 11: Valuation table, $ mln<br />
EV Revenues EBITDA Net profit EV/Sales EV/EBITDA P/E Revenues,<br />
CAGR<br />
2006 2007F 2006 2007F 2006 2007F 2006 2007F 2008F 2006 2007F 2008F 2006 2007F 2008F 2007-2008F<br />
Gazprom 331 055 79 151 94 067 35 147 40 975 22 558 24 274 4.2 3.5 3.0 9.4 8.1 6.6 13.1 12.2 9.6 19%<br />
LUKoil 66 098 68 109 66 914 12 328 10 304 7 484 5 674 1.0 1.0 1.0 5.4 6.4 6.0 8.0 10.6 10.2 -2%<br />
Rosneft 107 659 33 099 40 435 7 242 9 605 3 533 4 132 3.3 2.7 2.6 14.9 11.2 9.6 22.6 19.4 14.8 13%<br />
TNK-BP Holding 29 150 32 114 30 143 7 161 6 105 6 409 3 871 0.9 1.0 1.0 4.1 4.8 5.6 4.2 6.9 8.6 -5%<br />
Gazpromneft 23 243 20 172 18 670 5 168 4 245 3 661 2 660 1.2 1.2 1.3 4.5 5.5 6.9 6.5 8.9 13.1 -6%<br />
Surgutneftegaz 29 613 18 408 17 339 7 161 6 105 2 836 2 963 1.6 1.7 1.8 4.1 4.9 5.6 12.0 11.5 13.3 -5%<br />
Novatek 22 152 1 795 2 340 823 1 112 501 725 12.3 9.5 6.5 26.9 19.9 12.6 44.4 30.7 19.0 38%<br />
Oil & Gas average 1 3.5 2.9 2.4 9.9 8.7 7.5 15.8 14.3 12.7<br />
UES 50 312 32 510 37 861 5 708 8 636 1 245 2 823 1.5 1.3 1.1 8.8 5.8 5.7 37.9 16.7 21.0 17%<br />
Irkutskenergo 4 809 782 865 125 145 37 50 6.1 5.6 5.1 38.6 33.1 26.2 99.5 99.5 49.8 10%<br />
Bashkirenergo 2 254 1 118 1 300 167 203 44 51 2.0 1.7 1.5 13.5 11.1 8.8 51.4 41.1 29.4 17%<br />
Novosibirskenergo 900 636 726 111 132 70 84 1.4 1.2 1.1 8.1 6.8 5.0 11.4 9.6 6.7 13%<br />
OGK-5 4 997 921 1 139 136 207 162 80 5.4 4.4 3.9 36.7 24.2 21.5 38.1 77.7 71.2 17%<br />
TGK-5 322 401 460 59 53 n/a n/a 0.8 0.7 0.6 5.5 6.1 5.4 n/a n/a n/a 15%<br />
MOESK 3 524 896 1 536 309 824 150 484 3.9 2.3 1.6 11.4 4.3 2.7 20.5 6.4 4.4 55%<br />
MGESK 1 802 373 661 202 461 105 301 4.8 2.7 2.1 8.9 3.9 2.9 17.5 6.1 4.5 51%<br />
Utilities average 1 3.3 2.5 2.1 16.4 11.9 9.8 39.5 36.7 26.7<br />
Sistema 25 448 9 703 11 745 3 931 4 583 630 769 2.6 2.2 1.8 6.5 5.6 5.0 28.4 23.2 20.5 19%<br />
MTS 37 190 6 384 8 446 3 230 4 381 1 076 2 347 5.8 4.4 3.5 11.5 8.5 6.8 32.1 14.7 11.4 29%<br />
Comstar-UTS 4 923 1 120 1 435 429 634 82 276 4.4 3.4 3.3 11.5 7.8 7.7 52.2 15.5 15.7 16%<br />
VimpelCom 36 841 4 868 7 110 2 452 3 677 811 1 538 7.6 5.2 3.9 15.0 10.0 7.5 43.3 22.8 14.0 39%<br />
Golden Telecom 4 305 855 1 281 227 341 86 171 5.0 3.4 2.3 18.9 12.6 7.1 43.0 21.7 12.6 49%<br />
Rostelecom 7 821 2 263 2 270 380 460 54 148 3.5 3.4 3.7 20.6 17.0 16.6 153 55.4 45.8 -3%<br />
MGTS 3 119 802 993 356 451 125 229 3.9 3.1 2.9 8.8 6.9 6.3 20.1 11.0 9.7 16%<br />
RBC 1 079 200 244 54 74 35 47 5.4 4.4 3.5 20.0 14.6 10.8 31.7 23.6 16.8 24%<br />
Center Telecom 2 466 1 084 1 286 396 442 68 90 2.3 1.9 1.9 6.2 5.6 5.5 19.5 14.7 17.0 9%<br />
NW Telecom 1 739 759 853 245 308 47 110 2.3 2.0 1.9 7.1 5.6 5.2 27.7 11.8 10.9 9%<br />
South Telecom 1 550 660 728 229 215 13 3 2.3 2.1 2.1 6.8 7.2 6.8 39.5 167.8 24.0 6%<br />
Volga Telecom 2 002 914 1 180 321 442 79 165 2.2 1.7 1.6 6.2 4.5 4.2 14.5 6.9 6.3 16%<br />
Sibir Telecom 1 966 1 110 1 369 271 513 43 210 1.8 1.4 1.4 7.3 3.8 3.5 27.2 5.6 5.1 14%<br />
Uralsvyazinform 3 075 1 248 1 477 344 551 30 191 2.5 2.1 2.0 8.9 5.6 5.0 56.5 8.9 7.1 12%<br />
FE Telecom 897 400 485 100 161 12 62 2.2 1.8 1.8 9.0 5.6 5.0 39.8 7.7 6.6 12%<br />
Telecom average 1 3.6 2.8 2.5 11.0 8.1 6.9 41.9 17.4 14.3<br />
Norilsk Nickel 41 590 11 550 17 174 7 611 12 396 5 965 8 325 3.6 2.4 2.6 5.5 3.4 3.8 7.2 5.2 6.1 17.9%<br />
Severstal 21 309 12 423 12 588 2 987 2 921 1 231 1 203 1.7 1.7 1.7 7.1 7.3 7.8 16.0 16.4 19.8 0.1%<br />
NLMK 19 334 6 046 6 574 2 631 2 758 2 066 1 785 3.2 2.9 3.1 7.3 7.0 7.5 10.0 11.6 12.5 2%<br />
Chelyabinsk Zinc Plant 557 553 599 178 177 96 111 1.0 0.9 1.0 3.1 3.1 2.6 5.6 4.9 3.9 2%<br />
Evraz 26 145 8 385 9 121 2 395 2 395 1 366 1 079 3.1 2.9 3.0 10.9 10.9 11.7 17.5 22.2 24.8 3%<br />
Polus Gold 7 604 735 775 286 357 1 157 236 10.4 9.8 10.1 26.6 21.3 23.6 7.1 34.8 41.5 1%<br />
Priargunsk Mining 949 212 453 29 242 9 172 4.5 2.1 1.6 33.2 3.9 2.5 92.6 4.9 3.2 69%<br />
Highland Gold Mining 1 383 102 107 -65 11 -96 -7 13.5 12.9 13.1 nm 125 94.1 neg neg neg 1%<br />
Peter Hambro Mining 2 248 157 187 80 97 42 47 14.4 12.0 6.2 28.3 23.2 10.5 50.6 45.1 16.7 52%<br />
Metals average 1 6.1 5.3 4.7 15.3 22.7 18.2 16.3 18.1 16.1<br />
Wimm-Bill-Dann 5 566 1 762 2 416 218 320 95 148 3.2 2.3 1.9 25.5 17.4 12.9 53.7 34.5 24.7 30%<br />
Lebedyansky 1 910 710 983 139 182 86 102 2.7 1.9 1.5 13.7 10.5 8.3 19.8 16.7 13.3 32%<br />
Baltika 8 023 2 183 2 442 694 807 415 518 3.7 3.3 3.0 11.6 9.9 8.7 18.7 15.0 12.5 12%<br />
Pharmacy Chain 36.6 1 013 424 784 -0.3 22 37 143 2.4 1.3 0.8 nm 47.1 21.2 13.3 3.4 neg 71%<br />
X5 Retail Group 8 202 3 551 5 183 295 485 103 181 2.3 1.6 1.2 27.8 16.9 12.4 70.1 39.8 28.1 40%<br />
Seventh Continent 2 011 958 1 285 104 126 68 83 2.1 1.6 1.3 19.4 16.0 13.1 28.9 23.5 26.4 29%<br />
Magnit 3 757 2 505 3 697 122 197 57 92 1.5 1.0 0.7 30.7 19.1 12.8 59.5 36.8 28.0 46%<br />
Cherkizovo Group 995 630 842 74 113 30 45 1.6 1.2 1.0 13.4 8.8 6.4 24.6 16.4 10.7 29%<br />
Amtel-Vredestein 771 817 1 019 77 80 -5 -28 0.9 0.8 0.7 10.0 9.6 5.8 neg neg 19.6 20%<br />
Consumer average 1 2.3 1.7 1.3 19.0 17.3 11.3 36.1 23.3 20.4<br />
PIK Group 14 680 1 546 2 681 474 827 298 461 9.5 5.5 3.7 nm 17.8 10.3 46.3 30.0 14.1 60%<br />
AFI Development 3 212 4 47 118 45 112 45 nm 68.3 11.7 27.2 71.4 13.0 34.6 86.1 3.1 729%<br />
Open Investments 3 866 86 173 24 12 58 80 45.0 22.3 9.2 161.1 322.2 43.0 66.7 48.3 6.7 120%<br />
Sistema-HALS 1 880 283 453 15 90 56 37 6.6 4.2 3.0 129.7 20.9 12.8 34.7 51.6 12.5 48%<br />
RGI International 1 274 0.4 3 -5 -1 55 700 nm nm 27.5 nm nm 36.2 18.7 1.5 41.7 977%<br />
MirLand 900 4 45 -6 22 30 95 nm 19.8 1.3 nm 40.9 2.4 30.1 9.5 5.8 1209%<br />
Real Estate average 1 20.4 24.0 9.4 106.0 94.6 19.6 38.5 37.8 14.0<br />
Uralkali 15 417 820 1 132 311 552 129 351 18.8 13.6 7.5 49.6 27.9 11.6 116.9 43.0 16.0 59%<br />
Silvinit 8 834 674 1 025 279 550 180 393 13.1 8.6 4.8 31.7 16.1 7.0 39.8 18.2 7.6 65%<br />
Fertilizers average 1 16.0 11.1 6.1 40.6 22.0 9.3 78.4 30.6 11.8<br />
Revenues EBITDA Net profit NI Margin P/BV P/E Revenues,<br />
CAGR<br />
2006 2007F 2006 2007F 2006 2007F 2006 2007F 2008F 2006 2007F 2008F 2006 2007F 2008F 2007F<br />
Sberbank - 9 861 12 380 - - 3 047 4 584 6.6% 5.5% 5.8% 7.3 3.7 3.1 28.0 18.6 11.8 34%<br />
VTB - 3 252 3 968 - - 1 179 1 314 3.9% 3.5% 4.0% 4.1 1.8 1.7 24.4 21.9 15.0 34%<br />
Vozrozhdenie - 218 356 - - 30 69 5.9% 6.1% 6.2% 7.7 3.4 2.7 52.9 23.3 13.5 50%<br />
Banks average 1 5.5% 5.0% 5.3% 6.4 2.9 2.5 35.1 21.3 13.4<br />
Source: company data, Bloomberg.<br />
15
Kazakhstan Equities<br />
16<br />
KAZAKH MARKET TABLE<br />
Figure 12: Most liquid stocks performance<br />
Type Market Ratio Close Change Volume YTD MCap 12M Target<br />
Price<br />
The <strong>Morning</strong> <strong>Brief</strong><br />
January 25, 2008<br />
Equities<br />
Upside Rating<br />
$ % $/1000 % $ mln $ %<br />
Kazmunaigas E&P GDR Europe 1/6 in 1 28.25 2.4 10 120 -9 11 902 N/R N/A N/R<br />
Petrolinvest Common stock Europe 131 0.2 2 186 -2 767 N/R N/A N/R<br />
Arawak Energy Common stock U.S., Canada 2.24 2.9 68 -9 388 N/R N/A N/R<br />
Max Petroleum Common stock Europe 1.08 9.5 4 856 -10 354 N/R N/A N/R<br />
BMB Munai Common stock U.S. 5.25 6.1 763 -16 235 12.3 134 BUY<br />
Transmeridian Exploration Common stock U.S. 1.29 -0.8 543 -35 151 N/R N/A N/R<br />
Tethys Petroleum Common stock U.S., Canada 2.57 2.4 39 -14 120 N/R N/A N/R<br />
Caspian Services Common stock U.S. 2.55 N/T N/T -23 107 N/R N/A N/R<br />
Victoria Oil & Gas Common stock Europe 0.424 8.6 1 318 19 53 N/R N/A N/R<br />
Caspian Energy Common stock U.S., Canada 0.337 8.4 13 1 35 N/R N/A N/R<br />
Big Sky Energy Common stock U.S. 0.09 12.5 3 20 14 U/R N/A U/R<br />
Caspian Holdings Common stock Europe 0.071 4.6 9 11 7 N/R N/A N/R<br />
Eurasian Natural Resources Common stock Europe 12.59 7.5 16 502 -1 16 207 N/R N/A N/R<br />
Kazakhmys Common stock Europe 21.8 6.5 100 667 -20 9 930 21 -4 HOLD<br />
Uranium One Common stock U.S., Canada 7.24 7.8 24 049 -19 3 378 N/R N/A N/R<br />
KazakhGold ADR Europe 1 in 1 24.85 1.7 1 776 -3 1 257 40.6 63 BUY<br />
Oriel Resources Common stock Europe 1.15 10.5 782 7 734 N/R N/A N/R<br />
European Minerals Corp Common stock U.S., Canada 1.33 8.5 652 -7 379 N/R N/A N/R<br />
ShalkiyaZinc GDR Europe 1/10 in 1 4.5 0 N/A -10 254 N/R N/A N/R<br />
Bekem Metals Common stock U.S. 2 N/T N/A N/A 250 N/R N/A N/R<br />
Hambledon Mining Common stock Europe 0.37 5.2 567 -10 157 N/R N/A N/R<br />
Alhambra Resources Common stock U.S., Canada 1.19 2 18 -1 90 N/R N/A N/R<br />
Frontier Mining Common stock Europe 0.158 1 3 -13 34 N/R N/A N/R<br />
Kazkommertsbank GDR Europe 1 in 1 14.12 2.9 38 718 5 4 060 13.5 -4 HOLD<br />
Halyk Savings Bank GDR Europe 4 in 1 15.8 3.6 9 710 2 3 887 24 52 BUY<br />
Bank TuranAlem ADR Europe 1 in 1 614 1.2 N/A -12 3 294 900 47 HOLD<br />
ATF Bank GDR Europe 1 in 1 58.94 1.2 N/A 12 2 098 N/R N/A N/R<br />
Alliance Bank GDR Europe 1/30 in 1 5.45 -3.5 501 9 1 576 7.0 28 HOLD<br />
TemirBank GDR Europe 1 in 1 18.61 0.3 N/A -15 279 N/R N/A N/R<br />
KazakhTelecom ADR Europe 1/3 in 1 89.88 2.9 360 -11 2 945 N/R N/A N/R<br />
Steppe Cement Common stock Europe 4.93 1 48 -10 562 7.8 58 BUY<br />
Kazakhstan Kazagy GDR Europe 1 in 1 5 0 N/A -5 524 N/R N/A N/R<br />
Chagala Group GDR Europe 4 in 1 7.75 0 50 2 165 N/R N/A N/R<br />
Source: Bloomberg, Alfa Bank Research
CALENDAR<br />
Figure 13: Calendar of upcoming events<br />
The <strong>Morning</strong> <strong>Brief</strong><br />
January 25, 2008<br />
Equities<br />
International January 28 US<br />
New Home Sales<br />
Eurozone<br />
Eurozone M3<br />
Utilities<br />
Late January TGK-4 new share issue<br />
Late January TGK-6 to publish its 2006 IFRS results<br />
Late January TGK-10 to publish its 2006 IFRS results<br />
Banking<br />
January 25 Sberbank to release 3Q07 IFRS financial results<br />
January 30 Sberbank to release 2007 RAS financial results (key figures)<br />
February 4 Sberbank to release 2007 RAS financial results<br />
Source: Bloomberg, Alfa Bank Research<br />
17
Contact Information<br />
Alfa Bank (Moscow)<br />
Head of Equities Dominic Gualtieri<br />
Telephone (+7 495) 795-3649<br />
Facsimile (+7 495) 745-7897<br />
Research Department<br />
Telephone (+7 495) 795-3676<br />
Facsimile (+7 495) 745-7897<br />
Head of Research Ronald P. Smith<br />
Strategy Ronald P. Smith, Erik DePoy<br />
Oil & Gas Konstantin Batunin, Natalia Pushkina<br />
Macroeconomics, Banking Natalia Orlova, Olga Naydenova<br />
Telecoms, Technology, Internet Ivan Shuvalov<br />
Utilities Alexander Kornilov, Elina Kulieva<br />
Metals & Mining Chirvani Abdoullaev, Maxim Semenovykh<br />
Consumer Goods, Retail, Media Brady Martin, Vitaly Kupeev<br />
Real Estate Brady Martin, Alexey Kryuchkov<br />
Transportation, Fertilizers, Machine-Building Roydel Stewart, Andrei Fedorov<br />
Kazakh Product Rinat Gainoulline<br />
Fixed Income Ekaterina Leonova, Pavel Simonenko<br />
Technical Analysis Vladimir Kravchuk, Ph.D.<br />
Russian Product Angelika Henkel, Ph.D., Vladimir Dorogov, Vladimir Kravchuk, Ph.D.<br />
Editorial David Spencer<br />
Translation Anna Sholomitskaya, Dmitry Dolgin<br />
Production Aleksei Balashov<br />
Equity Sales & Trading<br />
Telephone (+7 495) 795-3712<br />
Facsimile (+7 495) 745-7897<br />
International Sales Kirill Surikov, Mikhail Shipitsin, Shani Kogan, David Johnson,<br />
Michael McAtavey<br />
Domestic Sales Alexander Nasonov, Konstantin Shapsharov, Vsevolod Topolyansky<br />
Address 12 Akad. Sakharov Prospect, Moscow, Russia 107078<br />
Alfa Capital (Kiev)<br />
Research Department<br />
Telephone (+380 44) 490-1600<br />
Strategy, Macroeconomics, Fixed Income Sergiy Kulpinsky, Ph.D.<br />
Metals & Mining Oleh Yuzefovych<br />
Engineering, Chemicals Denis Shauruk<br />
Utilities Maksym Nikulyak, Kateryna Ruskykh<br />
Consumer Goods Tetyana Orlova<br />
Banking Andrey Zaripov<br />
Real Estate, Small-Cap Strategy Andriy Gubachov<br />
Editorial Orysia M. Kulick<br />
Equity Sales<br />
Sales Sergey Grigorian, Ivan Shehavtsov, Anfisa Anikushina<br />
Telephone (+380 44) 490-1600<br />
Alfa Capital Markets (London)<br />
Telephone (+44 20) 7588-8500<br />
Facsimile (+44 20) 7382-4170<br />
Sales Maxim Shashenkov, Mark Cowley<br />
Sales Trading Ross Hassett, Douglas Babic<br />
Address City Tower, 40 Basinghall Street, London, EC2V 5DE<br />
Alfa Capital Markets (New York)<br />
Telephones (+1 212) 421-8563 / (+1 212) 421-7500<br />
Facsimile (+1 212) 421-8633<br />
Sales Robert Kaplan, Roman Kogan<br />
Sales Trading Roman Kogan<br />
Address 540 Madison Avenue, 30 th Floor, New York, NY 10022<br />
Copyright Alfa Bank, 2008. All rights reserved.<br />
IMPORTANT INFORMATION<br />
The contents of this document have been prepared by Open Joint Stock Company Alfa Bank ("Alfa Bank") as Investment Research within the meaning of Article 24 of<br />
Commission Directive 2006/73/EC implementing the Markets in Financial Instruments Directive 2004/39/EC ("MiFID"). Alfa Capital Markets ("ACM") is distributing this document<br />
to its clients in the EEA and accepts no responsibility towards any other classes of recipient. Alfa Bank and ACM have in place appropriate conflicts of interest policies and<br />
procedures aimed at ensuring the objectivity of the information contained in this document. The information contained in this document is provided for information purposes only<br />
and is not a marketing communication, investment advice or personal recommendation within the meaning of MiFID. The information must not be used or considered as an offer<br />
of solicitation of an offer to sell or to buy or subscribe for any securities or financial instruments. In the UK, this document does not constitute a Financial Promotion within the<br />
meaning of section 21 of the Financial Services and Markets Act 2000 (as amended). ACM is regulated by the Financial Services Authority (“FSA”) with FSA registration number<br />
416251, for the conduct of UK investment business and is the trading name of the UK branch of Alfa Capital Holdings (Cyprus) Limited (“ACC”) which is authorized by the Cyprus<br />
Securities and Exchange Commission under license number CIF 025/04. This document is not for distribution to retail clients as defined by MiFID and may not be communicated<br />
to such persons. This document is not for distribution or use by any person or entity in any jurisdiction where such distribution or use would be contrary to local law or regulation<br />
or which would subject Alfa Bank, ACC, ACM or any other group entity to authorization, licensing or other registration requirements under applicable laws. The information<br />
contained in this document is the exclusive property of Alfa Bank. Unauthorized duplication, replication or dissemination of this document, in whole or in part, without the express<br />
written consent of Alfa Bank is strictly prohibited. Although the information in this document has been obtained from, and is based on, sources Alfa Bank believes to be reliable,<br />
no representation or warranty, express or implied, is made by Alfa Bank, ACM or the authors. ACM and its officers and employees do not accept any responsibility as to the<br />
accurateness or completeness of any information herein or as to whether any material facts have been omitted. All information stated herein is subject to change without notice.<br />
ACM makes no warranty or representation that any securities referred to herein are suitable for all recipients and any recipients considering investment decisions should seek<br />
appropriate independent advice. Nothing in this document constitutes tax, legal or accounting advice. Alfa Bank, ACC and their associated companies, officers and directors<br />
(excluding any financial analysts or other personnel involved in the production of research), from time to time, may deal in, hold or act as market makers or advisors, brokers or<br />
commercial and/or investment bankers in relation to the securities, financial instruments and companies mentioned in this email, or may have been, or may be represented on the<br />
board of such companies. If such circumstances arise, ACM, Alfa Bank, ACC and their associated companies have in place appropriate conflicts of interest policies and<br />
procedures to ensure that investment research remains independent and objective.