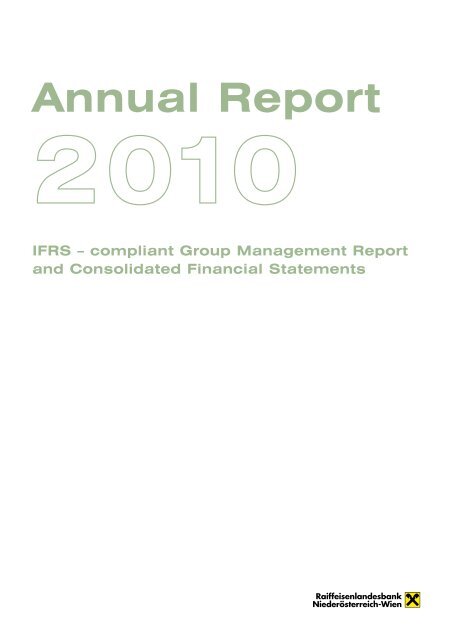
Annual Report - Raiffeisenlandesbank Niederösterreich-Wien
Annual Report - Raiffeisenlandesbank Niederösterreich-Wien
Annual Report - Raiffeisenlandesbank Niederösterreich-Wien

Create successful ePaper yourself
Turn your PDF publications into a flip-book with our unique Google optimized e-Paper software.
<strong>Annual</strong> <strong>Report</strong><br />
IFRS – compliant Group Management <strong>Report</strong><br />
and Consolidated Financial Statements
2<br />
OVERVIEW OF THE RLB NÖ-WIEN GROUP (IFRS FIGURES)<br />
RLB NÖ-<strong>Wien</strong> Group<br />
MONETARY VALUES ARE IN €m 2010 +/(-) CHANGE 2009<br />
Income Statement<br />
Net interest income after impairment charge 193.8 > 100.0% 84.8<br />
Net fee and commission income 65.7 20.7% 54.4<br />
Net trading income 24.2 5.3% 23.0<br />
Profit from investments in entities accounted for using the<br />
equity method 256.4 98.3% 129.3<br />
General administrative expenses (180.7) 5.6% (171.1)<br />
Profit for the year before tax 316.3 80.7% 175.0<br />
Consolidated net profit for the year 308.6 80.5% 170.9<br />
Balance Sheet<br />
Loans and advances to other banks 12,189 (4.5%) 12,758<br />
Loans and advances to customers 9,680 11.3% 8,696<br />
Deposits from other banks 15,899 0.1% 15,883<br />
Deposits from customers 7,071 2.9% 6,870<br />
Equity (incl. Profit) 2,383 16.8% 2,040<br />
Assets 32,683 3.1% 31,699<br />
Regulatory information1 Risk-weighted basis of assessment 12,930 2.9% 12,567<br />
Total own funds 1,826 10.0% 1,661<br />
Own funds requirement 1,102 3.6% 1,063<br />
Surplus own funds ratio 65.8% 9.6 ppt 56.2%<br />
Tier 1 ratio (credit risk) 9.7% 0.6 ppt 9.1%<br />
Total Tier 1 ratio 9.1% 0.5 ppt 8.6%<br />
Own funds ratio 13.3% 0.8 ppt 12.5%<br />
Performance<br />
Return on equity before tax 14.3% 5.6 ppt 8.7%<br />
Consolidated return on equity 14.0% 5.5 ppt 8.5%<br />
Cost:income ratio 34.6% (9.5 ppt) 44.1%<br />
Earnings per share, € 142.06 82.4% 77.90<br />
Return on assets after tax 0.96% 0.38 ppt 0.58%<br />
Risk:earnings ratio 13.3% (30.5 ppt) 43.8%<br />
Additional information<br />
Workforce on balance sheet date 1,332 6.1% 1,256<br />
Branches and offices 67 (3) 70<br />
1 The RLB NÖ-<strong>Wien</strong> Group is part of the Raiffeisen-Holding NÖ-<strong>Wien</strong> Group. Austria’s Bankwesengesetz (BWG: banking act) does not govern the<br />
regulatory own funds of subsidiaries that make up a subgroup. The presentation of this regulatory information in accordance with BWG on the basis<br />
of partial consolidation within the credit institution group (Kreditinstitutsgruppe) is therefore provided for informational purposes only.
CONTENTS<br />
OVERVIEW OF THE RLB NÖ-WIEN GROUP (IFRS FIGURES)<br />
GROUP MANAGEMENT REPORT 4<br />
BUSINESS PERFORMANCE AND ECONOMIC CONDITIONS 4<br />
RESULTS IN 2010 6<br />
NOTES ON THE GROUP’S PROFIT, ASSETS AND LIABILITIES AND FINANCIAL POSITION 7<br />
FINANCIAL PERFORMANCE INDICATORS 13<br />
THE INTERNAL CONTROL SYSTEM FOR THE FINANCIAL REPORTING PROCESS 13<br />
RISK REPORT 14<br />
MATERIAL EVENTS AFTER THE BALANCE SHEET DATE 14<br />
BRANCHES AND OFFICES 14<br />
RESEARCH AND DEVELOPMENT 14<br />
NON-FINANCIAL PERFORMANCE INDICATORS 14<br />
CORPORATE SOCIAL RESPONSIBILITY 16<br />
OUTLOOK FOR 2011 17<br />
IFRS-COMPLIANT CONSOLIDATED FINANCIAL STATEMENTS 19<br />
A. STATEMENT OF COMPREHENSIVE INCOME 19<br />
B. BALANCE SHEET 21<br />
C. STATEMENT OF CHANGES IN EQUITY 22<br />
D. CASH FLOW STATEMENT 24<br />
E. NOTES 25<br />
THE FUNDAMENTALS OF PREPARING IFRS-COMPLIANT CONSOLIDATED FINANCIAL STATEMENTS 25<br />
RECOGNITION AND MEASUREMENT POLICIES 27<br />
DETAILS OF THE INCOME STATEMENT 38<br />
DETAILS OF THE BALANCE SHEET 47<br />
NOTES ON FINANCIAL INSTRUMENTS 62<br />
ADDITIONAL INFORMATION 87<br />
OVERVIEW OF EQUITY INVESTMENTS (PURSUANT TO § 265 ABS. 2 UGB) 96<br />
BOARDS AND OFFICERS 103<br />
DECLARATION BY THE MANAGING BAORD 105<br />
AUDITOR’S REPORT 106<br />
GLOSSARY 108<br />
2<br />
3
4<br />
GROUP MANAGEMENT REPORT<br />
Business performance and economic conditions<br />
THE GLOBAL ECONOMIC ENVIRONMENT<br />
International economic conditions were altogether positive<br />
in 2010. In parts, the growth dynamic already initiated<br />
by government economic packages and central<br />
bank action in 2009 developed strongly. The threshold<br />
countries led, accounting for 80 per cent of the 4.8 per<br />
cent increase in global GDP. The United States, the<br />
eurozone, the United Kingdom and Japan accounted for<br />
just 20 per cent of this growth.<br />
The Centrope region made people sit up and take notice<br />
in 2010 with its growth edge over the eurozone.<br />
Whereas real GDP growth in the eurozone as a whole<br />
came to 1.7 per cent, the economies of the Centrope<br />
region grew by 2.4 per cent.<br />
Economic and economic policy events in the eurozone<br />
were shaped by the debt crises occurring in a number of<br />
countries. In May 2010, the EU Commission intervened<br />
jointly with the International Monetary Fund, promising<br />
Greece massive support. Risk premiums were a clear<br />
reflection of worries about loan losses and the<br />
financeability of extremely high debt ratios.<br />
2.5<br />
Economic Growth in Austria<br />
The European financial markets were burdened anew by<br />
the troubled state of the Irish budget. As a result, the<br />
European Financial Stability Fund (EFSF) was called into<br />
being in June 2010.<br />
The heads of state and government leaders in the EU<br />
also took additional action to stabilize the Monetary<br />
Union. To protect the euro against further deliberate<br />
attacks from the financial markets, the EU summit in the<br />
middle of December decided to create a permanent<br />
rescue fund for countries threatened by insolvency.<br />
Germany emerged as the eurozone’s growth leader in<br />
2010, recording GDP growth of 3.7 per cent. Thanks to<br />
the good growth dynamic, there was a strong increase<br />
in its exports. Combined with the weak euro, this<br />
stimulated economic activity at home and abroad.<br />
The jobless rate in the eurozone fell slightly, to 10.1 per<br />
cent. Lending in Europe began to grow again in the<br />
course of 2010. The average rate of inflation over the<br />
year was still below the ECB’s 2 per cent target.<br />
(Percentage Real Change versus Previous Year. Data sources: Statistik Austria, WIFO.)<br />
3.6<br />
3.7<br />
2.2<br />
(3.9)<br />
2.0<br />
2005 2006 2007 2008 2009 2010
THE ECONOMIC ENVIRONMENT<br />
IN AUSTRIA<br />
2010 was the year in which Austria’s economic recovery<br />
broadened. Growth came to just under 2 per cent. In<br />
all, the economic stimulus packages put in place since<br />
the start of the economic crisis increased GDP growth<br />
by 1.4 percentage points. Those economic stimulus<br />
packages, which were substantial by international<br />
standards, were already having a significant impact in<br />
2010.<br />
Besides those special measures to support the<br />
economy, the principal contributor to the recovery in<br />
Austria was the welcome recovery of the global<br />
economy. Exports were still 3 per cent down on the<br />
previous year at the beginning of 2010, but they grew<br />
strongly in August, coming to nearly 29 per cent more<br />
than in 2009. However, this pace could not be<br />
maintained later in the year. Besides driving a strong<br />
increase in industrial output, Austria’s exporting<br />
successes also led to record employment levels in the<br />
labour market. The jobless rate of 4.1 per cent was well<br />
below the EU average of 9.6 per cent.<br />
The way ahead was set for the budget consolidation<br />
path in the period up to 2013. Net new debt reached its<br />
outer limit at 4.5 per cent of GDP. Total public debt came<br />
to 70.2 per cent of aggregate GDP, which was well<br />
above the Maastricht threshold figure of 60 per cent.<br />
The tax reform and the first and second federal<br />
economic stimulus packages came to more than €5<br />
billion, and measures taken by the Austrian provinces<br />
came to slightly over €1 billion.<br />
Points<br />
5,000<br />
4,500<br />
4,000<br />
3,500<br />
3,000<br />
2,500<br />
2,000<br />
1,500<br />
1,000<br />
The ATX since 2005<br />
THE EUROZONE MONEY AND CAPITAL MARKETS<br />
AND THE INTERNATIONAL EQUITY MARKETS<br />
The ECB maintained its highly expansionary monetary<br />
policy throughout the year. Besides leaving its key<br />
interest rate unchanged at a historical low of 1 per cent,<br />
a variety of other measures were taken to support the<br />
economy. They included the large-scale buying of<br />
government bonds and the continuation of extensive<br />
tender operations.<br />
10-year capital market rates were dominated by worries<br />
about the euro debt crisis, falling to an all-time low of<br />
2.10 per cent (10-year German Bunds) at the end of<br />
August. Numerous supporting measures and concrete<br />
efforts to consolidate public budgets took the 10-year<br />
rate up to just under 3 per cent by year-end.<br />
The recovery of the world economy was reflected in the<br />
international equity markets, and this was especially true<br />
in Russia, the United States and Germany. These three<br />
stock markets were clear leaders, delivering an annual<br />
performance of 22.5, 19.2 and 16 per cent, respectively.<br />
The Vienna Stock Exchange also did well in international<br />
comparisons, gaining over 16 per cent in 2010.<br />
CHANGE IN THE SCOPE OF CONSOLIDATION<br />
The scope of consolidation did not change in 2010.<br />
Points<br />
5,000<br />
4,500<br />
4,000<br />
3,500<br />
3,000<br />
2,500<br />
2,000<br />
1,500<br />
1,000<br />
5
6<br />
Results in 2010<br />
The RAIFFEISENLANDESBANK NIEDERÖSTERREICH-WIEN Group (RLB NÖ-<strong>Wien</strong> Group) made a very good profit<br />
in the 2010 financial year. In view of the RLB NÖ-<strong>Wien</strong> Group’s responsibility for the people living in the region, the<br />
Managing Board attached great importance to sustained development. By combining cost savings and efficiency<br />
enhancements with the responsible conduct of financial transactions, the Group was able to remain on its safe and<br />
secure path. This in turn benefited its customers.<br />
• At 31 December 2010, the Group’s assets came to<br />
€32,682.8 million, which was 3.1 per cent or €984.2<br />
million more than the figure of €31,698.6 million recorded<br />
at the end of 2009.<br />
• Operating profit in 2010 was outstanding, at €341.9<br />
million. This was €125.2 million or 57.8 per cent up<br />
on the prior-year figure of €216.7 million. Operating<br />
income increased by €134.8 million or 34.8 per cent<br />
to €522.6 million, whereas general administrative<br />
expenses increased by €9.6 million or 5.6 per cent<br />
to €180.7 million.<br />
• Net interest income—the most important item of<br />
income from the Group’s core operations—was<br />
very satisfactory, at €223.5 million. This was €72.6<br />
million or 48.1 cent more than the prior-year figure of<br />
€151.0 million.<br />
• Net fee and commission income was substantially<br />
up on the previous year to €65.7 million, having increased<br />
by €11.3 million or 20.7 percent.<br />
• Net trading income increased to €24.2 million,<br />
which was €1.2 million up on the previous year.<br />
• Our profit from investments in entities accounted for<br />
using the equity method is mainly a reflection of the<br />
performance of the Raiffeisen Zentralbank Group<br />
(RZB Group). It came to €256.4 million, which was<br />
€127.1 million or 98.3 per cent more than in 2009.<br />
19,549.3<br />
812.4<br />
Assets and Tier 1 Capital, €m<br />
27,533.4<br />
1,222.6<br />
• Profit from financial investments was down on 2009,<br />
falling by €20.4 million to €4.2 million. The increase<br />
in interest rate volatility in the international money<br />
and capital markets played a major role in this decline.<br />
• General administrative expenses increased by €9.6<br />
million or 5.6 per cent to €180.7 million, having<br />
come to €171.1 million in 2009. The cost saving<br />
and efficiency enhancement programme that has<br />
been running since 2008 continued to brake the rise<br />
in costs and improve workflows during 2010.<br />
• Consolidated profit for the year after tax and minorities<br />
came to €308.6 million, compared with €170.9<br />
million in 2009. The increase of €137.6 million was,<br />
to a large degree, due to the increases in net interest<br />
income, net fee and commission income and<br />
profit from investments in entities accounted for using<br />
the equity method.<br />
• The RLB NÖ-<strong>Wien</strong> Group’s good business performance<br />
in 2010 allowed another big increase in its Tier<br />
1 capital, which increased from €1,293.5 million to<br />
€1,401.5 million.<br />
• The Group’s Tier 1 ratio (in relation to total risk) was<br />
sustained at a high 9.1 per cent in 2010, as against<br />
8.6 per cent in 2009.<br />
31,698.6<br />
1,293.5<br />
32,682.8<br />
1,401.5<br />
2007 2008 2009 2010<br />
Assets Tier 1 capital
Notes on the Group’s Profit, Assets and Liabilities and Financial Position<br />
CONSOLIDATED OPERATING PROFIT IN 2010 COMPARED WITH 2009<br />
€’000 2010 2009<br />
Net interest income 223,539 150,967<br />
Net fee and commission income 65,714 54,440<br />
Net trading income 24,189 22,982<br />
Profit from investments in entities accounted for using the equity method 256,430 129,290<br />
Other operating profit/(loss) (47,272) 30,086<br />
Operating income 522,600 387,765<br />
Staff costs (99,120) (95,470)<br />
Other administrative expenses (77,468) (71,678)<br />
Depreciation/amortization/write-offs (4,155) (3,963)<br />
General administrative expenses (180,743) (171,111)<br />
Operating profit 341,857 216,654<br />
The year 2010 was shaped by the economy’s recovery<br />
following the 2008/2009 recession. Precisely in these<br />
difficult times, the RLB NÖ-<strong>Wien</strong> Group profited from its<br />
conservative risk policy and a business model that is<br />
focused on customers’ needs. Emerging from the crisis<br />
stronger than before, the RLB NÖ-<strong>Wien</strong> Group proved<br />
itself to be a strong partner to corporate and retail<br />
banking customers in the Centrope region.<br />
Customer operations made an important contribution to<br />
the increase in net interest income, which grew by<br />
€72.6 million or 48.1 per cent to €223.5 million. Credit<br />
operations expanded significantly as the demand for<br />
loans increased with the economy’s recovery. RLB NÖ-<br />
<strong>Wien</strong> Group consistently fulfilled its role as a lender to<br />
business, increasing the balance of loans and advances<br />
to customers by 11.3 per cent during 2010. Moreover, it<br />
proved possible to improve credit margins. The<br />
structure of RLB NÖ-<strong>Wien</strong>’s customer base constitutes a<br />
solid foundation for further sustainable credit growth.<br />
Although interest rates were low, confidence in the<br />
Raiffeisen brand was strong. As a result, customer<br />
deposits remained a vital source of funds. This too<br />
helped drive another increase in net interest income in<br />
2010.<br />
The third contributing factor to the success of the<br />
Group’s interest rate operations was the profitable use<br />
of maturity transformation. Thanks to our cautiously<br />
optimistic market outlook and accurate interest rate<br />
forecasting, it generated a pleasing amount of interest<br />
income.<br />
The economic recovery was also clearly apparent in the<br />
securities sector and, therefore, in net fee and<br />
commission income. The demand for shares, fund units<br />
and bonds was greatly increased by customers’<br />
renewed faith in rising markets, ending the downtrend of<br />
the crisis years. Net fee and commission income<br />
totalled €65.7 million in 2010, which was €11.3 million or<br />
20.7 per cent more than in 2009. Alongside fee and<br />
commission from securities operations, this increase<br />
was driven mainly by fee and commission income from<br />
payment services and credit operations. Insurance and<br />
building society operations also proved to be an<br />
important source of earnings thanks to the undiminished<br />
demand for secure saving and investment products.<br />
Net trading income was again very high, at €24.2<br />
million. This compared with €23.0 million in 2009.<br />
Earnings from interest rate operations (bond trading and<br />
money market operations) contributed to the increase,<br />
as did trading in foreign exchange and (gold) coins.<br />
7
8<br />
RLB NÖ-<strong>Wien</strong>’s Profit from investments in entities<br />
accounted for using the equity method is mainly a<br />
reflection of the performance of the RZB Group, which<br />
was very satisfactory in 2010. On balance, the RLB NÖ-<br />
<strong>Wien</strong> Group’s direct equity investments in the Czech<br />
Republic, Slovakia and Hungary also made positive<br />
contributions, although an exceptional burden was imposed<br />
on Raiffeisenbank in Hungary as a result of the<br />
supplementary levy on banks. Profit from investments in<br />
entities accounted for using the equity method nearly<br />
doubled, increasing by €127.1 million on the previous<br />
year to €256.4 million.<br />
Other operating profit/(loss) consisted largely of profit<br />
or loss from ‘other’ derivative operations and income<br />
from services and reimbursed costs. Together, they<br />
came to negative €47.3 million, which was substantially<br />
down on the profit of €30.1 million recorded in 2009.<br />
This was, above all, due to revaluation losses on<br />
derivative financial instruments that were neither held for<br />
trading nor hedging instruments within the meaning of<br />
IAS 39.<br />
General administrative expenses increased by €9.6<br />
million to €180.7 million. This line item consisted of staff<br />
600<br />
500<br />
400<br />
300<br />
200<br />
100<br />
515.0<br />
Operating Income and<br />
General Administrative Expenses, €m<br />
376.9<br />
157.9 163.5<br />
costs of €99.1 million, other administrative expenses of<br />
€77.5 million and depreciation/amortization/write-offs of<br />
property and equipment and intangible assets totalling<br />
€4.2 million. The rise in general administrative expenses<br />
was kept in check by individual cost optimizations and<br />
efficiency enhancements. Staff numbers were selectively<br />
increased to meet the growing demands of<br />
banking operations as effectively as possible, but staff<br />
costs as a whole rose by just €3.7 million. Other<br />
administrative expenses increased by €5.8 million. Most<br />
of the increase was in IT, advertising and entertainment<br />
expenses. On the one hand, it enabled us to implement<br />
our growth strategy in the customer segment. On the<br />
other, we needed to continue to steadily modernize our<br />
banking IT systems at a low cost.<br />
Total operating profit increased by €125.2 million or<br />
57.8 per cent to €341.9 million. Operating income<br />
increased by €134.8 million or 34.8 per cent to €522.6<br />
million, while general administrative expenses increased<br />
by €9.6 million or 5.6 per cent. This improved the<br />
cost:income ratio to 34.6 per cent, compared with 44.1<br />
per cent in 2009.<br />
387.8<br />
171.1<br />
522.6<br />
180.7<br />
0<br />
2007 2008 2009 2010<br />
Operating income General administrative expenses
CONSOLIDATED PROFIT IN 2010 COMPARED WITH 2009<br />
€’000 2010 2009<br />
Operating profit 341,857 216,654<br />
Impairment charge on loans and advances (29,732) (66,144)<br />
Profit from financial investments 4,151 24,523<br />
Profit for the year before tax 316,276 175,033<br />
Income tax (7,703) (4,084)<br />
Profit for the year after tax 308,573 170,949<br />
Minority interests in profit (8) (13)<br />
Consolidated profit for the year 308,565 170,936<br />
Consistent risk management and a successful lending<br />
strategy gave us an excellent risk position. The balance<br />
of impairment allowances and impairment reversals<br />
resulted in an impairment charge on loans and<br />
advances of €29.7 million, which was well below the<br />
prior-year figure of €66.1 million.<br />
Profit from financial investments came to €4.2 million.<br />
It was largely generated by financial investments<br />
designated as at fair value through profit or loss. In<br />
addition, this line item includes profits from other<br />
financial investments and unlisted securities. Profit from<br />
financial investments was €20.4 million down on the<br />
previous year.<br />
400<br />
300<br />
200<br />
100<br />
Consolidated Operating Profit and<br />
Consolidated Net Profit for the Year, €m<br />
357.1<br />
303.6<br />
213.4 216.7<br />
Income tax expense came to €7.7 million. Current<br />
income tax consisted mainly of the portion of<br />
Körperschaftsteuer (Austrian corporation tax) payable<br />
under the Steuerumlagenvereinbarung (tax contribution<br />
agreement) with RAIFFEISEN-HOLDING NIEDERÖS-<br />
TERREICH-WIEN reg. Gen.m.b.H. (Raiffeisen-Holding<br />
NÖ-<strong>Wien</strong>), which is the parent of the steuerliche<br />
Unternehmensgruppe (taxable enterprises group).<br />
In total, the Group’s successful business growth<br />
together with integrated risk management and effective<br />
cost controls resulted in consolidated net profit for the<br />
year of €308.6 million, compared with €170.9 million in<br />
2009. The RLB NÖ-<strong>Wien</strong> Group thus achieved a lasting<br />
increase in profit in the year under review.<br />
170.9<br />
341.9<br />
308.6<br />
0<br />
29.1<br />
2007 2008 2009 2010<br />
Consolidated operating profit Consolidated net profit for the year<br />
9
10<br />
SEGMENTAL REPORT FOR 2010<br />
The RLB NÖ-<strong>Wien</strong> Group is divided into the segments<br />
listed below. The segment definitions correspond<br />
exactly to the customers being serviced. (Primary<br />
segment reporting within the meaning of IFRS 8 is<br />
based on the RLB NÖ-<strong>Wien</strong> Group’s internal<br />
management reporting system.)<br />
• Retail Banking (Personal and Business Banking<br />
Customers)<br />
• Corporate Customers<br />
• Financial Markets<br />
• Investments<br />
• Management Services<br />
The Retail Banking (Personal and Business Banking<br />
Customers) segment encompasses retail business<br />
carried on by the Group’s branches in Vienna. It<br />
therefore covers the banking requirements of retail<br />
banking customers in Vienna. In particular, this includes<br />
providing them with advisory services in the loan, saving<br />
and investment fields. The Group’s private banking<br />
teams provide professional advice to high net worth<br />
personal banking customers in Vienna. The Group’s<br />
centres of excellence for trade and business customers<br />
service small and medium-sized enterprises in Vienna.<br />
Because money market rates were low, 2010 was a<br />
particularly challenging year for this segment. However,<br />
as in 2009, it proved possible to sustain the level of<br />
savings deposit balances in 2010. In addition, the<br />
economic recovery had a very beneficial effect on risks<br />
and customers’ propensity to invest. Profit for the year<br />
before tax in this segment came to €25.1 million,<br />
compared with €16.3 million in 2009. This resulted in a<br />
return on equity before tax of 17.3 per cent (2009: 12.3<br />
per cent). This segment’s cost:income ratio improved<br />
from 75.7 per cent in 2009 to 73.5 per cent in 2010.<br />
The Corporate Customers segment made an excellent<br />
profit in 2010. The keys to this segment’s success are<br />
made-to-measure products and solutions and close<br />
attention to the needs of corporate customers in the<br />
Centrope region. The Group continued to pursue a<br />
consistent business acquisition strategy during the year<br />
under review while at the same time deepening its<br />
relationships with existing customers. Our profitorientated<br />
business policy led to another increase in<br />
business volumes and advance in net interest income.<br />
As the segment’s net interest income after the<br />
impairment charge shows, risks were under control. It<br />
was massively up on the previous year, coming to €98.2<br />
million in 2010, as against €58.5 million in 2009.<br />
The RLB NÖ-<strong>Wien</strong> Group’s corporate customers<br />
segment therefore made a profit for the year before tax<br />
of €94.1 million, compared with €43.2 million in 2009.<br />
With average equity employed of €709.4 million, it thus<br />
delivered a return on equity before tax of 13.3 per cent<br />
(2009: 6.5 per cent).<br />
Although the money and capital market were volatile, the<br />
Financial Markets segment made another contribution<br />
to consolidated net profit thanks to consistent risk- and<br />
profit-orientated management. Net interest income in<br />
2010 came to €78.9 million, which was considerably up<br />
on the prior-year figure of €16.9 million. Net trading<br />
income remained at the same high level as in 2009,<br />
coming to €11.7 million. However, high volatilities<br />
dented other profit/(loss) and led to realized losses and<br />
impairments that mainly affected interest positions. The<br />
financial markets segment recorded profit for the year<br />
before tax of €15.4 million and a return on equity of 4.9<br />
per cent. This was on the back of a strong profit from<br />
maturity transformation activities and the success of its<br />
trading activities.<br />
The Investments segment accounted for the biggest<br />
slice of the RLB NÖ-<strong>Wien</strong> Group’s consolidated profit for<br />
the year before tax, namely €196.8 million, with RZB’s<br />
consolidated net profit for 2010 playing a pivotal role.<br />
The successful merger of parts of RZB with Raiffeisen<br />
Bank International AG (RBI) contributed to this increase<br />
in profit, and the direct stakes held in the Raiffeisen<br />
Network Banks in the Czech Republic and Slovakia also<br />
yielded generally satisfactory results in 2010. However,<br />
the bank levy in Hungary severely dented profit from our<br />
investment in Raiffeisenbank Hungary.<br />
The Management Services segment encompasses all<br />
the activities of the RLB NÖ-<strong>Wien</strong> Group within the<br />
scope of its role in the Austrian Raiffeisen organization—<br />
serving the Raiffeisen Banks in Lower Austria as their<br />
central institution—as well as income and expenses<br />
arising from the work it does to support activities in the<br />
market in the other customer segments. In 2010, risk<br />
management activities carried out jointly with the<br />
Group’s credit divisions made a substantial contribution<br />
to reducing the impairment charge on loans and<br />
advances. In 2010, this segment recorded a loss of<br />
€15.1 million, compared with a loss of €14.5 million in<br />
2009.
BALANCE SHEET PERFORMANCE IN 2010<br />
The RLB NÖ-<strong>Wien</strong> Group’s assets grew by €984.2 million or 3.1 per cent compared with the end of the previous year<br />
to €32,682.8 million. This reflected the continued steady and stable growth of the Group’s customer operations. The<br />
principal contributor to growth on the assets side of the Balance Sheet was Loans and advances to customers.<br />
Growth on the equity and liabilities side of the Balance Sheet was driven by increases in Deposits from customers,<br />
Liabilities evidenced by paper and Equity.<br />
ASSETS<br />
During 2010, loans and advances to other banks fell by<br />
€569.7 million or 4.5 per cent to €12,188.5 million. Most<br />
of the balance of loans and advances to other banks<br />
resulted from loans and advances to banks within the<br />
Austrian Raiffeisen organization, including, above all,<br />
RZB and the Raiffeisen Banks in Lower Austria.<br />
Loans and advances to customers grew by €984.3<br />
million or 11.3 per cent to €9,680.4 million.<br />
Commercially, this was one of the most important line<br />
items on the assets side of the Balance Sheet alongside<br />
Loans and advances to other banks. The improvement<br />
in the economic climate boosted the demand for loans<br />
among corporate and retail banking customers.<br />
Qualitative growth was always our main priority in the<br />
customer loan market. The Group remained true to its<br />
conservative risk policy throughout and continued to<br />
actively manage its existing loan portfolio.<br />
19.549,3 19,549.3<br />
27.533,4 27,533.4<br />
Other current financial assets fell by €183.7 million or<br />
7.3 per cent to €2,320.5 million. On the other hand,<br />
financial investments were €270.0 million or 8.2 per<br />
cent up on the previous year to €3,548.7 million. Trading<br />
assets increased from €396.6 million to €588.3<br />
million.<br />
Investments in entities accounted for using the equity<br />
method increased to €2,384.3 million. During 2010, the<br />
corporate customer operations of Raiffeisen Zentralbank<br />
Österreich AG (RZB) were hived off to Cembra<br />
Beteiligungs AG (Cembra), after which Cembra was<br />
merged into RBI as general legal successor. These<br />
restructurings did not alter RLB NÖ-<strong>Wien</strong>’s stake in RZB.<br />
RLB NÖ-<strong>Wien</strong> therefore remained RZB’s biggest single<br />
shareholder, with a 31.4 per cent stake.<br />
Structure Structure of Assets of Assets on the Balance on the Balance Sheet, €m<br />
Sheet<br />
31.698,6 31,698.6<br />
€m<br />
32.682,8 32,682.8<br />
2007 2008 2009 2010<br />
Loans and advances to other banks Loans and advances to customers<br />
Financial investments and current financial assets<br />
Other assets<br />
Investments in entities accounted for using the equity method<br />
11
12<br />
EQUITY AND LIABILITES<br />
Deposits from other banks were virtually static on the<br />
previous year at €15,899.3 million, compared with<br />
€15,883.3 million in 2009. Deposits from Raiffeisen<br />
Banks in Lower Austria and RZB accounted for €8,692.2<br />
million or 54.7 per cent of total deposits from other<br />
banks. The structure of the RLB NÖ-<strong>Wien</strong> Group’s<br />
equity and liabilities is a reflection of RLB NÖ-<strong>Wien</strong>’s role<br />
as the central institution of Raiffeisen-Bankengruppe<br />
NÖ-<strong>Wien</strong> (the Raiffeisen Banking Group in Lower Austria<br />
and Vienna). The Raiffeisen Banks in Lower Austria hold<br />
their statutory liquidity reserves at RLB NÖ-<strong>Wien</strong>.<br />
RLB NÖ-<strong>Wien</strong> itself does not carry on retail banking<br />
business in Lower Austria.<br />
Deposits from customers increased by €200.7 million or<br />
2.9 per cent to €7,071.2 million during the year under<br />
review, with savings deposit balances accounting for<br />
€2,260.2 million of the total at year-end. Overall, the<br />
demand for secure forms of investment among retail<br />
banking customers was undiminished, confirming customer<br />
confidence in RLB NÖ-<strong>Wien</strong>. Customer sight<br />
deposit balances came to €3,835.4 million at the end of<br />
2010. Time deposit balances totalled €975.6 million.<br />
Liabilities evidenced by paper came to €3,844.0 million,<br />
which was 4.9 per cent or €179.2 million more than the<br />
total of €3,664.8 million recorded at the end of the<br />
previous year.<br />
Primary funds—comprising balances of deposits from<br />
customers and all liabilities evidenced by paper—<br />
totalled €10,915.1 million, accounting for roughly 33.4<br />
per cent of the RLB NÖ-<strong>Wien</strong> Group’s balance sheet<br />
total.<br />
Structure Structure of Equity and of Equity Liabilities and Liabilities on the Balance on the Sheet, Balance €m<br />
Sheet<br />
19.549,3 19,549.3<br />
2007 2008 2009 2010<br />
Deposits from other banks Deposits from customers<br />
Liabilities evidenced by paper Equity<br />
Other liabilities<br />
27.533,4 27,533.4<br />
31.698,6 31,698.6<br />
€m<br />
32.682,8 32,682.8
Financial Performance Indicators<br />
PERFORMANCE<br />
The key performance indicators that are in widespread<br />
international use stayed very good in 2010.<br />
The Group’s cost:income ratio—the ratio of operating<br />
costs to operating income—came to 34.6 per cent,<br />
which was also outstanding by international standards.<br />
As this showed, the Group continued consistently and<br />
successfully to apply its cost optimization and efficiency<br />
enhancement programme and other measures in the<br />
customer operations and proprietary trading fields. Its<br />
cost:income ratio in 2009 was 44.1 per cent.<br />
The Group’s consolidated return on equity after tax—<br />
its return on equity based on average consolidated<br />
equity—came to 14.0 per cent in 2010, compared with<br />
8.5 per cent in 2009. This means that the RLB NÖ-<strong>Wien</strong><br />
Group was still operating very profitably.<br />
REGULATORY OWN FUNDS<br />
At 31 December 2010, the RLB NÖ-<strong>Wien</strong> Group had<br />
total own funds of €1,826.5 million. This compared with<br />
a regulatory own funds requirement of €1,101.8 million,<br />
giving the Group surplus own funds of €724.6 million or<br />
65.8 per cent of its own funds requirement on its<br />
balance sheet date in 2010.<br />
The Group was also able to increase its Tier 1 ratio<br />
(calculated in relation to total risk) to 9.1 per cent, as<br />
against 8.6 per cent in 2009 (regulatory minimum: 4.0<br />
per cent), and its own funds ratio (calculated in relation<br />
to all risks) also increased further, namely from 12.5 per<br />
cent in 2009 to 13.3 per cent in 2010 (regulatory<br />
minimum: 8.0 per cent). (See Note (50) Regulatory own<br />
funds).<br />
The Internal Control System for the<br />
Financial <strong>Report</strong>ing Process<br />
The Managing Board of RLB NÖ-<strong>Wien</strong> has put in place<br />
an effective and appropriate internal control system for<br />
the financial reporting process. The Supervisory Board<br />
monitors the effectiveness of this internal control system.<br />
The internal control system includes pre-defined controls<br />
that make it an integral part of the Group’s technical and<br />
organizational processes. It ties together risk and<br />
compliance and ensures that adequate controls are<br />
implemented and correctly applied based on the<br />
defined risks.<br />
Risks and controls are documented using a risk control<br />
matrix. Its purpose is to show which risks should be<br />
limited, which processes should be controlled, what the<br />
controls should look like, and by whom and how<br />
frequently they should be carried out.<br />
The internal control system for the financial reporting<br />
process is designed to ensure reasonable reliability<br />
during the preparation and fair presentation of published<br />
annual financial statements and financial information in<br />
accordance with the legislative provisions contained in<br />
BWG (Austrian banking act) and UGB (Austrian<br />
enterprises code).<br />
The Supervisory Board and Managing Board rely on the<br />
support of experts, including, in particular, the experts in<br />
Accounts and Controlling, which is a Head Office<br />
department. In addition, Audit, likewise a Head Office<br />
department, audits adherence to the internal control<br />
system. Auditing the effectiveness of the internal control<br />
system for the financial reporting process is also one of<br />
the objects of the annual audits performed by<br />
Österreichische Raiffeisenverband and KPMG Austria<br />
GmbH Wirtschaftsprüfungs- und Steuerberatungsgesellschaft.<br />
13
14<br />
Risk <strong>Report</strong><br />
We refer the reader to the detailed Risk <strong>Report</strong> provided<br />
in Note (31) for information about the RLB NÖ-<strong>Wien</strong><br />
Group’s overall financial risks and its risk management<br />
goals and methodologies.<br />
Material Events after the Balance Sheet<br />
Date<br />
To date, there have been no business transactions or<br />
other events that would be of particular public interest or<br />
will materially affect the annual financial statements for<br />
2011.<br />
Branches and Offices<br />
At year-end 2010, some 600 account managers and<br />
sales assistants were servicing RLB NÖ-<strong>Wien</strong>’s<br />
customers at 67 branches and offices in Vienna. These<br />
included 49 retail banking branches, seven private<br />
banking teams for high net worth personal banking<br />
customers and six special centres of excellence for<br />
trade and business customers. The Raiffeisen-<br />
Mitarbeiterberatung staff advice service provides special<br />
services for enterprises within the Austrian Raiffeisen<br />
organization as well as for their employees at another<br />
five locations.<br />
The Group has neither offices nor branches abroad.<br />
Corporate customers are serviced by some 90 account<br />
managers and sales assistants in 11 departments at<br />
Raiffeisenhaus <strong>Wien</strong>, which is located at F.-W.-Raiffeisen-<br />
Platz 1. The Group has some 5,000 corporate<br />
customers. They value the customer-orientated advice<br />
and professional processing services they are offered in<br />
the classical loan, corporate finance (project and<br />
investment finance), acquisition finance, property<br />
finance, trade and export finance, documentary<br />
business and local authority and financial institutions<br />
fields.<br />
Research and Development<br />
Because of the industry in which it operates, the Bank<br />
does not perform any material research or development<br />
activities.<br />
Non-financial Performance Indicators<br />
HUMAN RESOURCES<br />
Being a bank with a strong advisory focus, RLB NÖ-<br />
<strong>Wien</strong> continued to enlarge its workforce in every<br />
customer segment. It processed over 5,870 job<br />
applications, carried out 1,150 individual job interviews<br />
and held 40 assessment centre modules with over 200<br />
participants. 170 new staff joined RLB NÖ-<strong>Wien</strong> during<br />
2010, increasing the workforce to 1,332 by year-end.<br />
In August 2010, RLB NÖ-<strong>Wien</strong> launched its<br />
apprenticeships offensive jointly with the Raiffeisen<br />
Banks in Lower Austria to help young people in our<br />
region. Eleven apprentices were accepted in Vienna<br />
and 16 in Lower Austria. Because the apprentices are<br />
completing their three-year banking apprenticeships in<br />
direct contact with customers, the emphasis is on<br />
intensive in-branch training supported by a mentor<br />
combined with training at MODAL (RBG NÖ-<strong>Wien</strong>’s<br />
training centre) and studies at a vocational school.<br />
When recruiting staff, RLB NÖ-<strong>Wien</strong> attaches particular<br />
importance to working together with secondary schools,<br />
universities and vocational colleges. Lectures by<br />
management staff and RLB NÖ-<strong>Wien</strong>’s presence at<br />
professional fairs also help it meet its sizeable staffing<br />
requirements. Karrieretalk sessions with over 200<br />
school pupils again proved to be a highly successful<br />
positioning and recruiting instrument.<br />
From their first day at work, employees’ development is<br />
fostered by an intensive training programme made up of<br />
on-the-job training and seminars. Mentorships play a<br />
special role, making sure that new employees fulfil their<br />
potential more rapidly. The induction scheme for new<br />
staff members makes an important contribution to their<br />
integration. It consists of a Welcome Day and being<br />
greeted personally by the Managing Board on the day of<br />
their induction.<br />
The management training schemes for existing heads of<br />
department and for young management personnel<br />
continued successfully. Meanwhile, the Group’s ‘pool<br />
programme’ for young management personnel,<br />
Mehr[WERT] ‘value added’ training in the corporate<br />
customers segment, mentor training and our trainee<br />
programme for young college and university graduates<br />
continued to provide training for a new generation of<br />
team leaders and senior account managers. As in 2009,<br />
staff attended a large number of training days during<br />
2010, namely 7,642. This translates into 5.9 training<br />
days per member of staff. 89.1 per cent of the<br />
workforce took advantage of our extensive range of<br />
training opportunities.
Refining job descriptions was especially important.<br />
These act as guides and provide orientation for staff<br />
during their development. The aim was to create<br />
transparent development grades and foster banking<br />
careers, ensuring stronger identification with each job.<br />
RLB NÖ-<strong>Wien</strong>’s personnel management activities<br />
particularly emphasize staff satisfaction. Our feedback<br />
culture was reinforced by quarterly surveys. These were<br />
based on sentiment barometer assessments carried out<br />
in five Head Office departments. Survey analyses were<br />
discussed directly in the departments concerned and<br />
the overall results were presented at the beginning of<br />
January 2011.<br />
The health and well-being of employees at the<br />
workplace are also important to RLB NÖ-<strong>Wien</strong>. Staff<br />
members attended a series of expert lectures on a<br />
variety of health and fitness topics within the scope of<br />
the Group’s Wellness Programme. In addition, nearly<br />
400 employees had check-ups. To encourage staff to<br />
be physically fit, they were offered a broad range of<br />
sporting opportunities by Turn- und Sportunion Raiffeisen<br />
NÖ-<strong>Wien</strong>. These proved very popular.<br />
Raiffeisen-Holding having already received it in 2009,<br />
RLB NÖ-<strong>Wien</strong> was awarded the Beruf & Familie (Job &<br />
Family) Audit Quality Seal in 2010. During this<br />
standardized process, Management (with the support of<br />
an internal project group) agreed on numerous<br />
measures that will make RLB NÖ-<strong>Wien</strong> more familyfriendly.<br />
These measures will be put into effect in years<br />
to come, after which recertification can take place.<br />
THE ENVIRONMENT AND CLIMATE PROTECTION<br />
An RKI Manual for Enterprises and Staff was drawn up<br />
within the scope of the Raiffeisen Climate Protection<br />
Initiative (RKI) set up by the Austrian Raiffeisenverband.<br />
The measures it recommends have been in the<br />
implementation stage since the end of 2008. One of the<br />
measures implemented at RLB NÖ-<strong>Wien</strong> was the<br />
distribution of regular information to every member of<br />
staff using weekly pop-ups on their PCs, which has been<br />
happening since 2010. These pop-ups provide valuable<br />
advice about saving energy in the office and in one’s<br />
free time. An online quiz was held to increase employee<br />
awareness of climate issues, and 45 per cent of our staff<br />
took part.<br />
Moreover, RLB NÖ-<strong>Wien</strong> gives the city’s population the<br />
free use of bicycles in cooperation with city of Vienna,<br />
providing them with an environmentally friendly<br />
additional form of public transport.<br />
RLB NÖ-<strong>Wien</strong>’s commitment to protecting the<br />
environment also finds expression in its business<br />
activities. The financing of environmental investments in<br />
Austria and abroad is becoming ever more important.<br />
This is particularly the case in the renewable energy<br />
field, which includes wind power, biomass and biogas<br />
technologies.<br />
RLB NÖ-<strong>Wien</strong> held Lower Austria’s fourth Energy Saving<br />
Day and Vienna’s third in 2010, offering visitors<br />
extensive information about energy-efficient building<br />
materials, construction ecology, subsidies, financing<br />
models, heating and building regulations in cooperation<br />
with the Province of Lower Austria, the City of Vienna<br />
and experts from the Raiffeisen Banks. Some 3,500<br />
advice sessions took place during these events, which<br />
were held on 12 February 2010. This successful project<br />
is part of Raiffeisen’s standard annual programme in<br />
Lower Austria and Vienna.<br />
RLB NÖ-<strong>Wien</strong> also acts as a partner in the energy<br />
contracting field. This is a commercially compelling<br />
model for optimizing a building’s energy consumption<br />
and energy (cost) efficiency. Measures taken to boost<br />
energy efficiency also benefit the environment in that<br />
energy contracting reduces energy consumption without<br />
affecting comfort. The measurable benefit for the<br />
environment is a substantial CO 2 saving.<br />
‘MIT.GESTALTEN’—A PROJECT FOR THE FUTURE<br />
In the financial year under review, RLB NÖ <strong>Wien</strong><br />
launched a multi-year project for the future called<br />
mit.gestalten (co.designing) in cooperation with Raiffeisen-Holding<br />
NÖ-<strong>Wien</strong>. On the basis of cooperative<br />
underlying principles, they developed a modern corporate<br />
strategy designed to successfully and sustainably<br />
position Raiffeisen with its employees and customers. A<br />
multi-layer process was used to pinpoint areas of activity<br />
that have the potential for further development. They are<br />
‘inter-generation.dialogue’, ‘migration.integration’, ‘opportunities.equality’,<br />
‘Austrian Raiffeisen organization.network’<br />
and ‘society.responsibility’. The first measures<br />
developed within the scope of this project were<br />
already put into effect in 2010.<br />
15
16<br />
Corporate Social Responsibility<br />
SOCIAL WELFARE<br />
RLB NÖ-<strong>Wien</strong>’s employees demonstrated their high<br />
levels of personal commitment by cooking for the clients<br />
of the Gruft—a Caritas refuge for the homeless—within<br />
the scope of sponsorship of the Gruft by Raiffeisen and<br />
the Kurier newspaper as part of the ‘Cardinal König’<br />
scheme. Since the beginning of this partnership in<br />
2006, they have served over 14,000 plates of food at<br />
more than 120 Raiffeisen evening meals cooked for an<br />
average of 120 people. Their activities are rounded off<br />
by Christmas present collections for people staying at<br />
the Gruft refuge and by arranging collections of nonfinancial<br />
donations at companies close to the Raiffeisen<br />
organization.<br />
This personal contribution by members of our staff is a<br />
part of the corporate social responsibility lived out by<br />
RLB NÖ-<strong>Wien</strong>. In 2010, we again did a number of things<br />
to improve the quality of life in the regions where our<br />
customers live.<br />
The ‘Cardinal König’ scheme is an important part of the<br />
mosaic that makes up Raiffeisen’s commitment to<br />
helping socially disadvantaged people in Vienna. Help<br />
ranges from direct financial support that aims to prevent<br />
people from sliding back into homelessness to buying<br />
food to paying for a psychiatrist for the people staying in<br />
the Gruft refuge. Moreover, Raiffeisen did more than fill<br />
the scheme’s coffers directly; it also activated its<br />
network links to other companies, in turn generating<br />
substantial non-financial donations from them.<br />
SPORT<br />
The attractiveness of a neighbourhood also depends<br />
greatly on the leisure opportunities that it offers. Sponsoring<br />
sporting events, including above all running<br />
events like the Business Run, the Frauenlauf (women’s<br />
run) and the Friedenslauf (peace run), was another of<br />
RLB NÖ-<strong>Wien</strong>’s priorities. This commitment to sport is<br />
rounded off by its support of young athletes through<br />
sponsorship of the Austria Juniors (who train young<br />
footballers), the Raiffeisen Vikings (football) and the Aon<br />
Fivers (handball).<br />
SAFETY AND SECURITY<br />
Ensuring people’s safety and security is becoming<br />
increasingly important, so there too, RLB NÖ-<strong>Wien</strong> is<br />
playing an active role in partnership with the police. For<br />
instance, it sponsors the Sicherheitsverdienstpreis<br />
(security prize of honour) for Vienna and Lower Austria,<br />
which is awarded to both law enforcement officers and<br />
civilians.<br />
INTEGRATION<br />
Since 2009, RLB NÖ-<strong>Wien</strong> has also been breaking new<br />
ground in an area of great importance to society and to<br />
business, namely integration. At the suggestion of our<br />
Deputy CEO Georg Kraft-Kinz, RLB NÖ-<strong>Wien</strong> set up the<br />
Wirtschaft für Integration (business for integration)<br />
charity in March 2009. The charity’s patrons are Michael<br />
Häupl (Mayor of Vienna) and Christian Konrad<br />
(Chairman of the Supervisory Board of RLB NÖ-<strong>Wien</strong><br />
and Raiffeisen’s advocate general). This organization is<br />
a platform for top managers and business proprietors<br />
that takes effective action to address the issue of<br />
integrating people who have immigrated or are<br />
immigrating to Austria in a way that reflects their true<br />
potential. Wirtschaft für Integration’s basic funding is<br />
provided by RLB NÖ-<strong>Wien</strong>. In 2010, this charity set<br />
important accents in the public integration debate by<br />
awarding Austria’s first integration prize (together with<br />
ORF), organizing the first multilingual public speaking<br />
competition (Sag’s Multi) and setting up an information<br />
and discussion forum called Forum Brunnenpassage.
OUTLOOK FOR 2011<br />
THE ECONOMIC ENVIRONMENT<br />
The decade that began in 2011 will be shaped by the<br />
economic recovery that takes place following the<br />
massive slump in economic growth during 2008 and<br />
2009. Recovery in Austria has been and will continue to<br />
be dominated by strong growth in its exports. Against<br />
this backdrop, the Wirtschaftsforschungsinstitut (the<br />
Austrian Institute of Economic Research) is predicting<br />
real GDP growth of 2.2 per cent in Austria in 2011,<br />
compared with 2.0 per cent in 2010. This would be the<br />
strongest growth since 2008 and would maintain<br />
Austria’s growth edge over the eurozone as a whole,<br />
which will record growth of about 1.7 per cent in 2011.<br />
Economic recovery in 2011 will improve conditions in the<br />
labour market. In addition, the path of public budget<br />
consolidation will have a major impact on Austria’s<br />
economic policy environment. The federal government<br />
has drawn up a multi-year fiscal consolidation<br />
programme that should bring the budget deficit back<br />
below the Maasstricht target of 3 per cent of GDP in<br />
2012.<br />
RLB NÖ-WIEN — THE ‘BEST ADVISOR BANK’<br />
In this environment, the RLB NÖ-<strong>Wien</strong> Group is following<br />
a commercial path that is consistently directed at<br />
sustainability while remaining closely tied to RLB NÖ-<br />
<strong>Wien</strong>’s cooperative roots. The RLB NÖ-<strong>Wien</strong> Group<br />
services its customers in markets with which it is not just<br />
familiar but in which it has also had lasting success. In<br />
2011, the RLB NÖ-<strong>Wien</strong> Group will continue to focus on<br />
advising and supporting its retail and corporate<br />
customers as Vienna’s ‘Best Advisor Bank’. Both<br />
lending and saving and investment operations will profit<br />
from further stabilization of the global economy and the<br />
positive economic outlook.<br />
The RLB NÖ-<strong>Wien</strong> Group’s strength also makes it a<br />
reliable partner to the Raiffeisen Banks in Lower Austria<br />
and to RZB and its subsidiary Raiffeisen Bank<br />
International AG. Cooperation within the Austrian<br />
Raiffeisen organization will again be intensified in 2011.<br />
THE RAIFFEISEN ORGANIZATION’S 1-IT PROJECT<br />
1-IT for Austria is a core project that will permit cost<br />
effective cooperation across Austria’s regional borders<br />
and further increase the quality of that cooperation. This<br />
will give even greater strength to Raiffeisen’s already<br />
outstanding position in the nationwide market. The<br />
increases in efficiency that should result from this project<br />
will enable us to work in a modern way at a lower cost.<br />
The relevant strategic decisions have been made and<br />
the first steps in the project have been taken. The<br />
project to implement a shared nationwide IT system for<br />
the Austrian Raiffeisen organization was launched at the<br />
start of 2011.<br />
THE RAIFFEISEN BRAND STANDS FOR TRUST<br />
The Raiffeisen brand remained the banking brand of<br />
trust in uncertain times. The RLB NÖ-<strong>Wien</strong> Group will<br />
continue to earn this trust in 2011 and will steadily<br />
enlarge its customer base. ‘<strong>Wien</strong> erobern’ (conquering<br />
Vienna) is our ambitious motto, and it will come a step<br />
closer to fruition with the help of the events we will be<br />
holding and the many contacts we will be cultivating<br />
during 2011.<br />
In line with its medium-term plans, the RLB NÖ-<strong>Wien</strong><br />
Group expects to achieve a modest increase in its<br />
assets in 2011. Growth will be driven both by corporate<br />
customer and retail banking business. Moreover, since<br />
every business segment is planning for a steady<br />
increase in operating income that will outstrip the rise in<br />
costs, our cost:income ratio should also improve.<br />
We will consistently continue two important market<br />
initiatives—‘<strong>Wien</strong> erobern’ and ‘Centrope’—and our<br />
successful treasury and equity investment operations.<br />
Together, these activities should ensure that the RLB<br />
NÖ-<strong>Wien</strong> Group achieves sustained growth and that its<br />
positive business development continues.<br />
17
18<br />
Deputy CEO<br />
Georg KRAFT-KINZ<br />
Member<br />
Gerhard REHOR<br />
Vienna<br />
21 March 2011<br />
The Managing Board<br />
CEO<br />
Erwin HAMESEDER<br />
Member<br />
Reinhard KARL<br />
Member<br />
Michael RAB
IFRS-COMPLIANT CONSOLIDATED FINANCIAL STATEMENTS<br />
A. Statement of Comprehensive Income<br />
INCOME STATEMENT<br />
€’000 Note 2010 2009<br />
Interest income (1) 705,090 763,607<br />
Interest expenses (1) (481,551) (612,640)<br />
Net interest income (1) 223,539 150,967<br />
Impairment charge on loans and advances (2) (29,732) (66,144)<br />
Net interest income after impairment charge 193,807 84,823<br />
Fee and commission income (3) 94,821 79,699<br />
Fee and commission expenses (3) (29,107) (25,259)<br />
Net fee and commission income (3) 65,714 54,440<br />
Net trading income<br />
Profit from investments in entities accounted for using the<br />
(4) 24,189 22,982<br />
equity method (5) 256,430 129,290<br />
Profit from financial investments (6) 4,151 24,523<br />
General administrative expenses (7) (180,743) (171,111)<br />
Other operating profit/(loss) (8) (47,272) 30,086<br />
Profit for the year before tax 316,276 175,033<br />
Income tax (10) (7,703) (4,084)<br />
Profit for the year after tax 308,573 170,949<br />
Minority interests in profit (8) (13)<br />
Consolidated net profit for the year 308,565 170,936<br />
Undiluted earnings per share, € (11) 142.06 77.90<br />
There were no conversion or option rights in issue. Consequently, earnings per share were undiluted.<br />
19
20<br />
RECONCILIATION TO COMPREHENSIVE INCOME<br />
Attributable to Equity Holders<br />
of the Parent Minorities<br />
€’000 2010 2009 2010 2009<br />
Consolidated net profit for the year 308,565 170,936 8 13<br />
Cash flow hedge reserve (5,912) (798) 0 0<br />
Available-for-sale reserve<br />
Enterprise’s interest in other<br />
comprehensive income of the entities<br />
(12,301) 6,533 1 3<br />
accounted for using the equity method 56,540 (76,013) 0 0<br />
Deferred taxes 4,115 (1,908) 0 0<br />
Other comprehensive income 42,441 (72,186) 1 3<br />
Comprehensive Income 351,006 98,750 9 16
B. Balance sheet<br />
ASSETS, €’000 Note(s) 2010 2009<br />
Cash and balances with the central bank (13) 42,837 47,420<br />
Loans and advances to other banks (14, 34, 35) 12,188,513 12,758,222<br />
Loans and advances to customers (15, 34, 35) 9,680,435 8,696,138<br />
Impairment allowance balance (16, 35) (299,122) (281,035)<br />
Trading assets (17, 34, 35) 588,348 396,585<br />
Other current financial assets (18, 34, 35) 2,320,545 2,504,290<br />
Financial investments (19, 34, 35) 3,548,723 3,278,686<br />
Investments in entities accounted for using the equity method 2,384,329 2,085,007<br />
Intangible assets (20) 5,947 6,273<br />
Property and equipment (21) 8,879 9,538<br />
Other assets (22, 35) 2,213,411 2,197,478<br />
Total assets 32,682,845 31,698,602<br />
EQUITY AND LIABILITIES, €’000 Note(s) 2010 2009<br />
Deposits from other banks (23, 34, 35) 15,899,314 15,883,332<br />
Deposits from customers (24, 34, 35) 7,071,160 6,870,496<br />
Liabilities evidenced by paper (25, 34, 35) 3,843,953 3,664,804<br />
Trading liabilities (26, 34, 35) 242,383 65,039<br />
Other liabilities (27, 35) 2,428,127 2,396,775<br />
Provisions (28, 35) 60,905 62,130<br />
Subordinated debt capital (29, 34) 753,739 715,890<br />
Equity (30) 2,383,264 2,040,136<br />
Attributable to equity holders of the parent 2,383,165 2,040,043<br />
Minorities 99 93<br />
Total equity and liabilities 32,682,845 31,698,602<br />
21
22<br />
C. Statement of Changes in Equity<br />
Non-voting<br />
Non-ownership<br />
Capital<br />
(Partizipations-<br />
€’000 Share Capital kapital) Reserves Earnings Net Profit Interests Total<br />
Equity at 1 January 2010 214,520 76,500 432,688 1,316,335 0 93 2,040,136<br />
Comprehensive income 42,441 308,565 9 351,015<br />
Contractual profit transfer<br />
Distribution in respect of nonvoting<br />
non-ownership capital<br />
(56,500) (56,500)<br />
(Partizipationskapital) (3,825) (3,825)<br />
Transferred to retained earnings 248,240 (248,240) 0<br />
Other distributions (3) (3)<br />
Other changes 52,441 52,441<br />
Capital<br />
Retained<br />
Consolidated<br />
Minority<br />
Equity at 31 December 2010 214,520 76,500 432,688 1,659,457 0 99 2,383,264<br />
Non-voting<br />
Non-ownership<br />
Capital<br />
(Partizipations- Capital Retained Consolidated Minority<br />
€’000 Share Capital kapital) Reserves Earnings Net Profit Interests Total<br />
Equity at 1 January 2009 214,520 76,500 432,688 1,272,710 0 80 1,996,498<br />
Comprehensive income (72,186) 170,936 16 98,766<br />
Contractual profit transfer<br />
Distribution in respect of nonvoting<br />
non-ownership capital<br />
(53,700) (53,700)<br />
(Partizipationskapital) (3,825) (3,825)<br />
Transferred to retained earnings 113,411 (113,411) 0<br />
Other distributions (3) (3)<br />
Other changes 2,400 2,400<br />
Equity at 31 December 2009 214,520 76,500 432,688 1,316,335 0 93 2,040,136<br />
The share capital of RAIFFEISENLANDES-BANK NIEDERÖSTERREICH-WIEN AG (RLB NÖ-<strong>Wien</strong>) was<br />
€214,520,100.00 (year-end 2009: €214,520,100.00). Its subscribed share capital comprised 2,145,201 (year-end<br />
2009: 2,145,201) no-par bearer shares (Stückaktie) with a nominal value of €214,520,100.00 (year-end 2009:<br />
€214,520,100.00). In 2008, RLB NÖ-<strong>Wien</strong> AG issued 765,000 registered non-voting non-ownership ‘participation’<br />
certificates (Partizipationsschein) within the meaning of § 23 Abs. 3 Z. 8. in conjunction with Abs. 4 und Abs. 5 BWG.<br />
One such certificate has a nominal value of €100.00.
The cash flow hedge reserve and available-for-sale reserve transferred to retained earnings (in both cases, prior to<br />
the deduction of deferred taxes) and deferred taxes recognized directly in other comprehensive income changed as<br />
follows:<br />
Cash Flow Hedge Available-for-sale Deferred Taxes<br />
€’000<br />
Reserve<br />
Reserve Taken to Equity<br />
At 1 January 2010 (22,628) (6,176) 8,597<br />
Net changes in the financial year<br />
Of which gains and losses taken to Other comprehensive<br />
(5,912) (12,300) 4,115<br />
income<br />
Of which the amount taken from Other comprehensive<br />
(3,952) (14,477)<br />
income and recognized in profit or loss in the financial year (1,960) 2,177<br />
At 31 December 2010 (28,540) (18,476) 12,712<br />
Cash Flow Hedge<br />
Available-for-sale<br />
Deferred Taxes<br />
€’000<br />
Reserve<br />
Reserve Taken to Equity<br />
At 1 January 2009 (21,830) (12,712) 10,505<br />
Net changes in the financial year (798) 6,536 (1,908)<br />
Of which gains and losses taken to Other comprehensive<br />
income<br />
Of which the amount taken from Other comprehensive<br />
2,188 (2,295)<br />
income and recognized in profit or loss in the financial year (2,986) 8,831<br />
At 31 December 2009 (22,628) (6,176) 8,597<br />
Amounts charged off against the cash flow hedge reserve through profit or loss were recognized in Net interest income.<br />
Breakdown of the change in deferred taxes recognized in Other comprehensive income:<br />
€’000 2010 2009<br />
Deferred taxes arising from the cash flow hedge reserve 988 (300)<br />
Deffered taxes arising from the available-for-sale reserve 3,127 (1,608)<br />
Total 4,115 (1,908)<br />
23
24<br />
D. Cash Flow Statement<br />
€’000 2010 2009<br />
Profit for the year before minority interests 308,573 170,949<br />
Non-cash items in profit and reconciliation to net cash from/(used in) operating<br />
activities:<br />
Write-downs/(write-ups) of property and equipment and financial investments<br />
Revaluation (gains)/losses on investments in entities accounted for using the<br />
3,794 (2,017)<br />
equity method (256,430) (129,290)<br />
Net creation of provisions and impairment allowances<br />
(Gains)/losses on disposals of property and equipment and financial<br />
37,997 72,601<br />
investments (2,795) (16,479)<br />
Other adjustments (net) (173,094) (60,851)<br />
Subtotal<br />
Change in assets and liabilities arising from operating activities after<br />
corrections for non-cash items:<br />
(81,955) 34,913<br />
Loans and advances to customers and other banks (414,065) (4,015,460)<br />
Trading assets (191,762) 1,840,225<br />
Other current financial assets 184,950 (262,134)<br />
Other assets (41,957) (1,369,616)<br />
Deposits from customers and other banks 216,647 4,932,869<br />
Liabilities evidenced by paper 179,149 (187,797)<br />
Trading liabilities 177,344 (2,122,363)<br />
Other liabilities 28,519 1,434,070<br />
Subtotal 56,870 284,707<br />
Interest and dividends received 776,232 432,166<br />
Interest paid (604,658) (273,091)<br />
Income taxes paid 1,063 (1,287)<br />
Net cash from operating activities 229,507 442,495<br />
Cash receipts from sales of:<br />
Financial investments and equity investments 846,280 673,470<br />
Property and equipment and intangible assets<br />
Cash paid for:<br />
84 139<br />
Financial investments and equity investments (1,057,578) (1,110,409)<br />
Property and equipment and intangible assets (3,254) (3,685)<br />
Net cash from/(used in) investing activities (214,468) (440,485)<br />
Net inflows of subordinated debt capital<br />
Contractual profit transfer including service of non-voting non-ownership<br />
37,849 45,282<br />
capital (Partizipationskapital) (57,525) (45,300)<br />
Net cash from/(used in) financing activities (19,676) (18)<br />
€’000 2010 2009<br />
Cash and cash equivalents at end of previous period 47,420 45,423<br />
Net cash from operating activities 229,507 442,495<br />
Net cash from/(used in) investing activities (214,468) (440,485)<br />
Net cash from/(used in) financing activities (19,676) (18)<br />
Effect of exchange rate changes 54 5<br />
Cash and cash equivalents at end of period 42,837 47,420<br />
Cash and cash equivalents corresponds to Cash and balances with the central bank.
E. Notes<br />
THE ENTERPRISE<br />
RAIFFEISENLANDESBANK NIEDERÖSTERREICH-WIEN<br />
AG (RLB NÖ-<strong>Wien</strong>) is the regional central institution of<br />
Raiffeisen Bankengruppe NÖ-<strong>Wien</strong>. It is registered in<br />
the companies register (Firmenbuch) at Vienna trade<br />
court (Handelsgericht <strong>Wien</strong>) under the number<br />
FN 203160 s. The company’s address is Friedrich-Wilhelm-Raiffeisen-Platz<br />
1, 1020 Vienna.<br />
RAIFFEISEN-HOLDING NIEDERÖSTERREICH-WIEN<br />
registrierte Genossenschaft mit beschränkter Haftung<br />
(Raiffeisen-Holding NÖ-<strong>Wien</strong>) is RLB NÖ-<strong>Wien</strong>’s majority<br />
shareholder with a stake of 78.58 per cent. In accordance<br />
with Austrian disclosure regulations, the consolidated<br />
financial statements of Raiffeisen-Holding NÖ-<br />
<strong>Wien</strong> are lodged in the companies register and published<br />
in the Raiffeisen newspaper. The remaining<br />
shares of RLB NÖ-<strong>Wien</strong> are held by the <strong>Niederösterreich</strong>ische<br />
Raiffeisenbanken (Lower Austrian Raiffeisen<br />
Banks). As their central institution, RLB NÖ-<strong>Wien</strong><br />
provides them with support in every area of banking.<br />
RLB NÖ-<strong>Wien</strong> is a regional bank. In its core business<br />
segment, it operates in its regional home market—<br />
eastern Austria—and thus within the Centrope region,<br />
providing professional advisory services and optimum<br />
banking products. Thanks to its stake in Raiffeisen<br />
Zentralbank Österreich Aktiengesellschaft (RZB), it also<br />
profits from the Raiffeisen Banking Group’s presence in<br />
Central and Eastern Europe.<br />
The foundation stones of RLB NÖ-<strong>Wien</strong>’s banking activities<br />
are personal banking, business banking, corporate<br />
banking and proprietary operations. It provides retail<br />
banking services at its branches and consulting offices<br />
in Vienna under the slogan ‘Raiffeisen in <strong>Wien</strong>. Meine<br />
BeraterBank’ (Raiffeisen in Vienna. My Advisor Bank).<br />
RLB NÖ-<strong>Wien</strong>’s core strategic operations are supplemented<br />
by its participation in syndicated loan projects<br />
and its equity investments in banks and other bankingrelated<br />
investments in Austria, Hungary, the Czech Republic<br />
and Slovakia.<br />
The Fundamentals of Preparing IFRScompliant<br />
Consolidated Financial<br />
Statements<br />
PRINCIPLES<br />
The Consolidated Financial Statements for the financial<br />
year 2010 and the prior-year figures for 2009 were prepared<br />
in accordance with EU Directive (EC) 1606/2002,<br />
as issued by the Commission on 11 September 2002, in<br />
conjunction with § 245a UGB (Austrian enterprises code)<br />
and § 59a BWG (Austrian banking act). All the International<br />
Financial <strong>Report</strong>ing Standards and IFRIC interpretations<br />
whose application in connection with the Consolidated<br />
Financial Statements was mandatory were<br />
taken account of as adopted by the EU.<br />
The basis for the Consolidated Financial Statements<br />
was provided by the separate financial statements of all<br />
the consolidated entities, which were prepared applying<br />
uniform, Group-wide standards and in accordance with<br />
the provisions of IFRSs. The effect of the nonconsolidated<br />
subsidiaries on the Group’s assets, liabilities,<br />
financial position and profit or loss for the purposes<br />
of the framework in IAS/IFRS F 29f et seq was immaterial.<br />
With the exception of two subsidiaries accounted for as<br />
of and for the periods ended 30 September and<br />
31 October, respectively, and two subsidiaries whose<br />
balance sheet dates were 28 February and 31 March,<br />
respectively, for which interim financial statements were<br />
prepared as of and for the period ended 31 December,<br />
the consolidated companies and the entities accounted<br />
for using the equity method prepared their annual financial<br />
statements as of and for the period ended<br />
31 December. Appropriate adjustments were carried out<br />
to allow for the effects of material business transactions<br />
and other events occurring between a subsidiary’s reporting<br />
date and 31 December.<br />
Unless specifically stated otherwise, the figures in these<br />
Financial Statements are in full thousands of euros<br />
(€’000). There may be rounding errors in the tables that<br />
follow.<br />
CONSOLIDATION POLICIES<br />
The consolidation process involves eliminating intragroup<br />
investments and equity, balances, gains and<br />
losses, income and expenses.<br />
In accordance with IFRS 3 Business Combinations, the<br />
elimination of intragroup investments and equity arising<br />
from combinations took place applying the purchase<br />
method of accounting, acquired assets and liabilities<br />
being recognized as at the date of acquisition applying<br />
their fair values on that date. The difference between<br />
cost and the fair value of the acquired net assets was, if<br />
positive, recognized as goodwill.<br />
Pursuant to IFRS 3, par. 55, goodwill is not amortized.<br />
Instead, it is tested for impairment once a year. Following<br />
reassessment, negative goodwill is immediately<br />
25
26<br />
recognized in profit or loss in accordance with IFRS 3,<br />
par. 56.<br />
Investments in entities over which the RLB-NÖ-<strong>Wien</strong><br />
Group had a significant influence were accounted for<br />
using the equity method and recorded on the Balance<br />
Sheet in the line item Investments in entities accounted<br />
for using the equity method. The Group’s interests in<br />
the annual profits/(losses) of entities accounted for<br />
using the equity method were reported in Profit from<br />
investments in entities accounted for using the equity<br />
method. The Group’s interest in the ‘other comprehensive<br />
income’ of entities accounted for using the equity<br />
method was reported in Other comprehensive income.<br />
The same rules were applied to investments in entities<br />
accounted for using the equity method (date of first-time<br />
consolidation, calculation of goodwill or negative goodwill)<br />
as to investments in subsidiaries. The basis for<br />
recognition was provided by the respective financial<br />
statements of the entities accounted for using the equity<br />
method. If an entity accounted for using the equity<br />
method deviated from Group-wide recognition and<br />
measurement policies in respect of similar transactions<br />
and events, appropriate adjustments were carried out.<br />
Investments in other entities were recognized at fair<br />
value, or if a fair value was not available or could not be<br />
determined reliably, at cost less any impairment.<br />
During the elimination of intragroup balances, intragroup<br />
receivables and payables were eliminated.<br />
Intragroup gains and losses were eliminated if their<br />
effect on line items in the Income Statement was mate-<br />
rial. Banking business between the individual companies<br />
within the Group was conducted on arm’s length<br />
terms.<br />
Expenses and income resulting from transactions between<br />
consolidated entities were eliminated.<br />
SCOPE OF CONSOLIDATION<br />
The scope of consolidation of the RLB NÖ-<strong>Wien</strong> Group<br />
included all of the following Group members, in which<br />
RLB NÖ-<strong>Wien</strong> held direct or indirect interests of more<br />
than 50 per cent or over whose operating and/or financial<br />
policies it had a controlling influence:<br />
• RAIFFEISENLANDESBANK NIEDERÖSTERREICH-<br />
WIEN AG (Group parent)<br />
• RLB NÖ-<strong>Wien</strong> Holding GmbH<br />
• RLB NÖ-<strong>Wien</strong> Sektorbeteiligungs GmbH<br />
• RLB Ostbankenholding GmbH<br />
• Tatra Holding GmbH<br />
• ‘ARSIS’ Beteiligungs GmbH<br />
• ‘BARIBAL’ Holding GmbH<br />
• ‘EXEDRA’ Holding GmbH<br />
• ‘FIBULA’ Beteiligungs GmbH<br />
• Acceptia Holding GmbH<br />
• VAKS – Veranstaltungskartenservice Ges.m.b.H.<br />
• Raiffeisen Centropa Invest Verwaltungs- und Beteiligungs<br />
AG<br />
The number of consolidated entities and entities accounted for using the equity method changed as follows:<br />
Consolidated Equity Method<br />
N of Entities 2010 2009 2010 2009<br />
At 1 January 11 11 6 5<br />
First included in the year under review 0 0 0 1<br />
Restructuring carried out during the year under review 0 0 0 0<br />
At 31 December 11 11 6 6<br />
Twenty subsidiaries (2009: 20 subsidiaries) were not<br />
consolidated because their effect on the Group’s assets,<br />
liabilities, financial position and profit or loss was immaterial.<br />
They were accounted for in the line item Financial<br />
investments at cost less impairments as Investments in<br />
subsidiaries. The assets of excluded entities came to<br />
less than 1 per cent of the Group’s aggregated assets.<br />
Entities over whose operating and/or financial policies<br />
the RLB NÖ-<strong>Wien</strong> Group had a significant influence were<br />
accounted for using the equity method. In the 2010<br />
financial year, this applied to RZB, Raiffeisen Bank International<br />
AG (RBI), Raiffeisenbank a.s. (Czech Republic),<br />
Tatra banka a.s. (Slovakia), Raiffeisen Bank Zrt. (Hungary)<br />
and Raiffeisen Informatik GmbH.<br />
In 2010, RZB’s corporate customer operations were<br />
hived off to Cembra Beteiligungs AG (Cembra). Cembra<br />
was then amalgamated into Raiffeisen International<br />
Bank-Holding AG (RI) by way of universal succession.<br />
The merger increased the share capital of RI, which was<br />
renamed as Raiffeisen Bank International AG.<br />
In addition to a direct interest of 0.58 per cent (year-end<br />
2009: 0.58 per cent), RLB NÖ-<strong>Wien</strong> held an indirect<br />
stake of 30.82 per cent (year-end 2009: 30.82 per cent)<br />
in RZB via RLB NÖ-<strong>Wien</strong> Holding GmbH.
The RLB NÖ-<strong>Wien</strong> Group held interests of 47.75 per<br />
cent in Raiffeisenbank Informatik GmbH (year-end 2009:<br />
47.75 per cent) and 24.00 per cent in Raiffeisenbank a.s.<br />
(year-end 2009: 24.00 per cent). In addition, the RLB<br />
NÖ-<strong>Wien</strong> Group held an interest of 16.23 per cent in<br />
Raiffeisen Bank Zrt. via Raiffeisen-RBHU Holding GmbH<br />
(year-end 2009: 16.23 per cent), an interest of 12.62 per<br />
cent in Tatra banka a.s. (year-end 2009:12.80 per cent)<br />
and an interest of 0.54 per cent in RBI (year-end 2009:<br />
0.86 per cent).<br />
Investments in 11 associates (2009: 12 associates) were<br />
not accounted for using the equity method because their<br />
effect on the Group’s assets, liabilities, financial position<br />
and profit or loss was immaterial. They were recognized<br />
in the line item Financial investments at cost less impairments.<br />
Viewed together and based on current data,<br />
the immaterial associates would have changed the<br />
Group’s consolidated equity and consolidated assets by<br />
less than 1 per cent had they been accounted for using<br />
the equity method.<br />
No financial statements prepared in a foreign currency<br />
required consolidation. A list of consolidated entities,<br />
investments in entities accounted for using the equity<br />
method and other equity investments is provided in the<br />
Overview of Equity Investments.<br />
Recognition and Measurement Policies<br />
FINANCIAL INSTRUMENTS<br />
A financial instrument is a contract that gives rise to both<br />
a financial asset of one entity and a financial liability or<br />
equity instrument of another entity. According to IAS 39,<br />
all financial instruments must be recognized on the<br />
Balance Sheet at their fair value at the date of acquisition.<br />
This is usually the transaction price, which corresponds<br />
to the fair value of the consideration given or<br />
received. Financial instruments must be divided into<br />
defined categories. Their subsequent measurement will<br />
depend on the classification carried out.<br />
The following measurement categories result:<br />
At fair value through profit or loss: Financial assets or<br />
liabilities at fair value through profit or loss are financial<br />
instruments either, on initial recognition, classified by the<br />
entity as held for trading or designated as at fair value<br />
through profit or loss.<br />
• Financial assets and financial liabilities classified as<br />
financial instruments held for trading serve the purpose<br />
of generating a profit from short-term fluctuations<br />
in price or dealer’s margin. Instruments held<br />
for trading were measured at fair value, revaluation<br />
gains and losses being recognized in profit or loss.<br />
Liabilities held for trading also belong to this valuation<br />
category.<br />
• Upon initial recognition, financial assets, financial<br />
liabilities and groups of financial instruments (financial<br />
assets, financial liabilities or a combination of the<br />
two) were designated as financial instruments at fair<br />
value through profit or loss if more relevant information<br />
could be communicated that way.<br />
This requirement is met if such a designation eliminates<br />
or substantially reduces mismatches in measurement or<br />
approach (accounting mismatches).<br />
Assignment to this category also took place if financial<br />
assets and/or financial liabilities (including derivatives)<br />
were managed on the basis of a documented risk management<br />
or investment strategy within the scope of<br />
portfolios measured to fair value whose performance<br />
was reported on a regular basis to the Managing Board<br />
as a body. If such derivatives have substantial financial<br />
effects, financial instruments with embedded derivatives<br />
can also be designated as at fair value through profit or<br />
loss. If derivatives embedded in financial instruments<br />
could not be measured separately, the entirety of such a<br />
financial instrument was assigned a priori to this class.<br />
Classification took place as at the date of acquisition of<br />
a financial instrument. The irrevocable designation was<br />
documented by a summary in the portfolio, allowing<br />
separate risk monitoring in each case and, above all,<br />
management action directed at achieving defined profit<br />
goals. Responsibility for individual portfolios was regulated<br />
by clear assignments of responsibilities and the<br />
associated risk was limited by means of monitored lines<br />
and limits.<br />
Financial assets and liabilities designated upon initial<br />
recognition as financial assets at fair value through profit<br />
or loss must subsequently be measured at fair value,<br />
with valuation gains and losses being recognized in<br />
profit or loss. The decisive criterion for assignment to<br />
this measurement category was that, at the time of<br />
acquisition or upon designation at the time of the firsttime<br />
adoption of this standard, as amended, irrevocable<br />
assignment to this class had taken place. Financial<br />
investments in equity instruments that did not have<br />
quoted market prices and whose fair values could not<br />
be determined reliably and derivatives whose values<br />
were dependent upon and required settlement by delivery<br />
of such equity instruments were not measured at fair<br />
value through profit or loss. Such financial instruments<br />
were classified as available for sale and were measured<br />
at cost less any impairment.<br />
Loans and receivables: Loans and receivables are nonderivative<br />
financial assets with fixed or determinable<br />
payments that are not quoted in an active market and<br />
are not classified as held for trading, at fair value<br />
through profit or loss or available for sale. Such financial<br />
instruments result from the supply of money, goods or<br />
services. They were measured at amortized cost using<br />
the effective interest rate method taking account of any<br />
impairment.<br />
27
28<br />
Held-to-maturity: This category comprises financial<br />
assets with fixed or determinable payments that an<br />
entity has the positive intention and ability to hold to<br />
maturity. Such financial instruments were measured at<br />
amortized cost using the effective interest rate method.<br />
Premiums and discounts were recognized on a proportionate<br />
basis. Write-downs were carried out if there was<br />
an impairment of credit quality. If the reason for a writedown<br />
no longer applies, a write-back will take place up<br />
to the amount of the asset’s amortized cost and will be<br />
recognized in the Income Statement.<br />
Available-for-sale: Available-for-sale financial assets are<br />
non-derivative financial assets that are classified as<br />
available for sale and not as loans or receivables, heldto-maturity<br />
investments or financial assets designated<br />
as at fair value through profit or loss. Such assets were<br />
measured to fair value. Revaluation gains and losses<br />
are recognized in a separate item in equity in Other<br />
comprehensive income until the asset is sold or an<br />
impairment occurs. If an increase in fair value is objectively<br />
determinable, an impairment of a debt instrument<br />
will be reversed and the reversal will be recognized in<br />
the Income Statement; an impairment of an equity instrument<br />
will be reversed and recognized in Other comprehensive<br />
income.<br />
Equity and debt instruments not meeting the criteria for<br />
classification as held to maturity or as loans and receivables,<br />
that did not have a quoted market price and<br />
whose fair value could not be determined reliably were<br />
classified as available for sale and were measured at<br />
cost less any impairment.<br />
Financial liabilities not designated as at fair value<br />
through profit or loss or classified as held for trading<br />
were measured at amortized cost using the effective<br />
interest rate method. We refer the reader to the above<br />
comments regarding the recognition of financial liabilities<br />
designated as at fair value through profit or loss or<br />
classified as held for trading.<br />
Reacquired securities issued by the enterprise were<br />
deducted on the equity and liabilities side of the Balance<br />
Sheet.<br />
The fair value is the amount for which an asset could be<br />
exchanged, or a liability settled, between knowledgeable,<br />
willing parties in an arm’s length transaction. The<br />
fair value of a listed financial instrument is its market<br />
value. Where no market values were available, future<br />
cash flows from a financial instrument were discounted<br />
applying the pertinent yield curve at the measurement<br />
date using the methods of financial mathematics. If a<br />
fair value could not be determined reliably, measurement<br />
took place at cost less any impairment.<br />
Embedded derivatives outside the trading portfolio were<br />
separated from the host contract and accounted for as<br />
separate derivative financial instruments if the financial<br />
instrument was not measured in its entirety at fair value,<br />
if changes in fair value were not recognized in profit or<br />
loss, if the economic characteristics and risks of the<br />
embedded derivative were not closely related to the<br />
economic characteristics and risks of the host contract<br />
and if the embedded derivative really met the definition<br />
of a derivative financial instrument. The host contract<br />
was then recognized according to its classification. The<br />
change in the value of the separated derivative measured<br />
at fair value was recognized in profit or loss. If an<br />
embedded derivative could not be valued either upon<br />
acquisition or on subsequent reporting dates, the entire<br />
structured product was designated as at fair value<br />
through profit or loss.<br />
According to IAS 32, if an entity reacquires its own equity<br />
instruments (treasury shares), those instruments<br />
shall be taken from equity and not capitalized.<br />
A financial asset or financial liability was recognized on<br />
the Balance Sheet if a Group entity was a party to the<br />
contractual arrangements for the financial instrument<br />
and, consequently, had a right to receive or a legal obligation<br />
to pay cash. Initial recognition on the Balance<br />
Sheet, measurement in the Income Statement and accounting<br />
for the disposal of a financial instrument took<br />
place using trade date accounting.<br />
Financial assets were derecognized as of the time<br />
when the right to dispose of the asset or the contractual<br />
rights to the asset were lost.
DERIVATIVES<br />
Financial derivatives not designated in a hedge accounting<br />
relationship or accounted for using the fair value<br />
option described above were recognized on the Balance<br />
Sheet at fair value. Changes in value were recognized in<br />
profit or loss.<br />
Because of the different ways in which hedging relationships<br />
between hedged items and derivatives are accounted<br />
for under IAS 39, derivatives acquired for hedging<br />
purposes were divided into the following categories:<br />
Fair value hedge: In the case of a fair value hedge, an<br />
existing asset or an existing liability is hedged against<br />
possible future changes in fair value attributable to a<br />
particular risk that would affect profit or loss. Using<br />
hedge accounting, the hedging instrument is measured<br />
at fair value, with changes in value being recognized in<br />
profit or loss. The carrying amount of the hedged item is<br />
adjusted through profit or loss by the amount of the<br />
revaluation gains or losses attributable to the hedged<br />
risk. These hedges are formally documented, continually<br />
assessed and expected to be highly effective. In<br />
other words, throughout the term of a hedge, one can<br />
assume that changes in the fair value of a hedged item<br />
will be nearly completely offset by changes in the fair<br />
value of the hedging instrument and that the actual risk<br />
offset will lie within a range of deviation of 80 – 125 per<br />
cent.<br />
Cash flow hedge: Cash flow hedges are hedges of the<br />
exposure to variability in cash flows associated with a<br />
recognized asset or liability or a highly probable forecast<br />
transaction that would affect profit or loss. Within the<br />
scope of cash flow hedge accounting, derivatives are<br />
used to hedge against possible future changes in interest<br />
payments. The extent to which derivatives are used<br />
to hedge against the exposure to interest rate risk is<br />
decided within the scope of the asset liability management<br />
process, with future variable interest payments on<br />
variable-yield receivables and debt mainly being<br />
swapped for fixed-rate payments using interest rate<br />
swaps. Hedging instruments were measured at fair<br />
value. Revaluation gains and losses must be separated<br />
into an effective portion and an ineffective portion.<br />
Hedging relationships are judged to be effective if<br />
changes in the cash flow arising from the hedged items<br />
are nearly completely offset by changes in the cash flow<br />
arising from the hedges at the beginning of the transaction<br />
and throughout its term. During the first two years,<br />
cash flows are subdivided into monthly time bands; from<br />
the third to the fifth year, they are subdivided into quarterly<br />
time bands; and from the fifth year they are subdivided<br />
into annual time bands according to the balance<br />
sheet date.<br />
Predictions of hedged interest cash flows were based on the following expectations regarding capital cash flows:<br />
2010<br />
€’000<br />
Cash inflows<br />
Up to 1 Year 1 – 3 Years 3 – 5 Years 5 – 10 Years > 10 Years<br />
(assets)<br />
Cash outflows<br />
501,800 525,000 375,000 450,000 0<br />
(liabilities) (1,667,093) (2,883,336) (1,486,976) (107,828) 0<br />
Net cash flows (1,165,293) (2,358,336) (1,111,976) 342,172 0<br />
2009<br />
€’000 Up to 1 Year 1 – 3 Years 3 – 5 Years 5 – 10 Years > 10 Years<br />
Cash inflows<br />
(assets) 987,867 776,800 475,000 550,000 50,000<br />
Cash outflows<br />
(liabilities) (2,124,277) (3,202,723) (2,446,962) (495,201) (348)<br />
Net cash flows (1,136,410) (2,425,923) (1,971,962) 54,799 49,652<br />
The effective portion of the gain or loss on the hedging<br />
instrument is taken to Other comprehensive income and<br />
reported in a separate line item (Cash flow hedge<br />
reserve).<br />
Gains and losses on these derivatives are set against<br />
the future compensating effects of the hedging relationships,<br />
whose recognition on the Balance Sheet is not yet<br />
allowed. The cash flow hedge reserve is reversed<br />
through profit or loss in the periods in which the cash<br />
flows from the hedged items affect profit or loss for the<br />
period. The ineffective portion of hedging derivatives<br />
must be recognized in profit or loss.<br />
CLASSIFICATION OF FINANCIAL INSTRUMENTS IN<br />
ACCORDANCE WITH IFRS 7<br />
Since the nature of financial instruments is already expressed<br />
by the format of the Balance Sheet, the classifi-<br />
29
30<br />
cation of financial instruments is based on their assignment<br />
to balance sheet items. If a balance sheet item<br />
includes financial instruments in different valuation categories<br />
for the purposes of IAS 39, this will be taken into<br />
account accordingly. The categories of financial instrument<br />
on the assets side of the Balance Sheet are cash<br />
and balances with the central bank, loans and advances<br />
to other banks, loans and advances to customers, trading<br />
assets, other current financial assets, held-tomaturity<br />
financial investments, available-for-sale financial<br />
investments (measured at fair value), available-for-sale<br />
financial investments (measured at cost) and the derivative<br />
financial instruments and derivatives designated as<br />
hedging instruments included in Other assets. The<br />
categories of financial instrument on the equity and<br />
liabilities side of the Balance Sheet are deposits from<br />
other banks, deposits from customers, liabilities evidenced<br />
by paper, trading liabilities, subordinated debt<br />
capital and the derivative financial instruments and<br />
derivatives designated as hedging instruments included<br />
in Other liabilities.<br />
RECEIVABLES<br />
Receivables were measured at amortized cost without<br />
deducting impairment losses. Accrued interest was<br />
reported in the relevant line item. Premiums and discounts<br />
were accrued over a receivable’s term to maturity.<br />
Purchased receivables were also classified as Loans<br />
and receivables.<br />
In the case of receivables constituting hedged items in a<br />
fair value hedge, revaluation gains and losses on the<br />
hedged item were captured and the carrying amount of<br />
the receivable was adjusted accordingly (basis adjustment).<br />
Receivables not attributable to a core banking<br />
relationship were classified as Loans and receivables<br />
and recognized in Other assets.<br />
IMPAIRMENT ALLOWANCE BALANCE<br />
Allowance was made for credit risks by recognizing<br />
item-by-item impairment charges.<br />
Applying uniform Group-wide policies, impairment allowances<br />
in the amount of the expected losses were<br />
made for the recognizable counterparty risks associated<br />
with loans and advances to customers and other banks,<br />
were reversed insofar as the credit risk no longer existed,<br />
and were used if the loan was deemed to be<br />
irrecoverable and was charged off. A risk of default was<br />
deemed to exist if, taking account of collateral, the present<br />
value of expected repayments and interest payments<br />
was less than the carrying amount of the receivable.<br />
A collective assessment of impairments of portfolios was<br />
recognized for losses incurred but not yet reported at<br />
the time of the Balance Sheet’s preparation. They were<br />
classified by risk category on the basis of default probability<br />
time series.<br />
The balance of impairment allowances for receivables<br />
recognized on the Balance Sheet was presented in a<br />
separate line item on the assets side of the Balance<br />
Sheet below receivables (Loans and advances). The<br />
impairment allowance for off-balance sheet transactions<br />
was recognized as a provision.<br />
As a rule, direct write-offs only took place if the waiver of<br />
a receivable had been agreed with a borrower or an<br />
unexpected loss had occurred.<br />
TRADING ASSETS<br />
Trading assets are held for the purpose of exploiting<br />
short-term fluctuations in market prices.<br />
Securities and derivative instruments held for trading<br />
purposes were measured at their fair values. In the case<br />
of listed products, exchange prices were used as fair<br />
values. In the case of unlisted products, prices close to<br />
market prices (Bloomberg, Reuters) were used. If such<br />
prices were not available, primary financial instruments<br />
and forwards were measured using internal prices<br />
based on present value calculations, and options were<br />
measured using appropriate option price models. Derivatives<br />
held for trading were also recognized as part of<br />
the trading portfolio. Where fair values were positive,<br />
these derivatives were classified as Trading assets, and<br />
where fair values were negative, they were recorded on<br />
the Balance Sheet in the line item Trading liabilities, the<br />
fair values of derivatives being calculated without accrued<br />
interest (giving clean prices). Positive and negative<br />
fair values were not netted off against each other.<br />
Receivables arising from accruals of interest on derivatives<br />
held for trading were also reported in the line item<br />
Trading assets. Changes in their clean prices were<br />
recognized in the Income Statement in the line item Net<br />
trading income.<br />
Realized and unrealized gains and losses on trading<br />
assets and interest income and interest expenses arising<br />
from derivatives held for trading were recognized in<br />
the Income Statement in the line item Net trading income.<br />
Interest and dividend income arising from securities<br />
held for trading and the interest costs of funding<br />
them were recognized in the line item Net interest income.
OTHER CURRENT FINANCIAL ASSETS<br />
This line item comprises financial instruments designated<br />
as at fair value through profit or loss under the fair<br />
value option. They are bonds and other fixed-interest<br />
securities and shares and other variable-yield securities.<br />
Accrued interest on such financial instruments was also<br />
reported in this line item on the Balance Sheet.<br />
Realized and unrealized gains and losses were recognized<br />
in the Income Statement in the line item Profit/(loss)<br />
from financial investments, and current investment<br />
income was recognized in the line item Net interest<br />
income.<br />
FINANCIAL INVESTMENTS<br />
The line item Financial investments includes fixedinterest<br />
securities classified as held to maturity and<br />
available for sale, variable-yield securities, investments<br />
in subsidiaries not consolidated on the grounds of immateriality<br />
and other equity investments. The held-tomaturity<br />
portfolio was recognized on the Balance Sheet<br />
at amortized cost. Securities, investments in subsidiaries<br />
and other equity investments not classified as held to<br />
maturity were classified as available for sale. If listed,<br />
these financial assets were recognized at their exchange<br />
prices at the balance sheet date. Otherwise, they were<br />
measured at fair value, or, if their fair value could not be<br />
determined reliably, they were measured at cost. If a<br />
financial investment was classified as available for sale,<br />
revaluation gains and losses were taken to equity and<br />
reported in a special reserve (Available-for-sale reserve)<br />
as ‘other comprehensive income.’ Gains and losses on<br />
the disposal of financial investments were recognized in<br />
the line item Profit/(loss) from financial investments.<br />
When an asset is disposed of, the available-for-sale<br />
reserve in respect of that asset is reversed through profit<br />
PROPERTY AND EQUIPMENT<br />
or loss. Impairments within the meaning of IAS 39 were<br />
recognized in the Income Statement.<br />
INVESTMENTS IN ENTITIES ACCOUNTED FOR<br />
USING THE EQUITY METHOD<br />
Investments in entities accounted for using the equity<br />
method were presented in a separate line item. Profit<br />
from them was also reported separately in the Income<br />
Statement. The Group’s interest in the ‘other comprehensive<br />
income’ of entities accounted for using the<br />
equity method was reported in Other comprehensive<br />
income.<br />
INTANGIBLE ASSETS<br />
Purchased intangible assets with a determinable useful<br />
life were measured at cost less straight-line, ordinary<br />
amortization. Straight-line amortization is based on<br />
expected useful lives of between three and 50 years.<br />
According to IAS 36, if there is any indication that an<br />
asset may be impaired, insofar as the carrying amount<br />
of an asset exceeds its recoverable amount, an impairment<br />
loss must in addition be recognized. The recoverable<br />
amount is the higher of the asset’s fair value less<br />
costs to sell and its value in use. If, in the subsequent<br />
reporting period, there are grounds to believe that the<br />
impairment no longer exists, IAS 36 requires a writeback<br />
up to the recoverable amount but to no more than<br />
the asset’s amortized cost. A write-back of goodwill is<br />
not permitted.<br />
At the balance sheet date, RLB NÖ <strong>Wien</strong> had no selfproduced<br />
intangible assets with reliably determinable<br />
conversion costs that were likely to generate future<br />
economic benefits.<br />
Property and equipment were stated at cost of acquisition or conversion less depreciation. Depreciation is carried<br />
out on a straight-line basis assuming the following useful lives:<br />
Useful Life Years<br />
Buildings 25 – 50<br />
Office furniture and equipment 3 – 20<br />
Fittings in rented premises are depreciated on a<br />
straight-line basis over the shorter of the lease term and<br />
their expected useful life, which is usually 10 years.<br />
Pursuant to IAS 36, if there is any indication that an<br />
asset may be impaired, insofar as the carrying amount<br />
of the asset exceeds its recoverable amount, an impairment<br />
loss must in addition be recognized. The recoverable<br />
amount is the higher of an asset’s fair value less<br />
costs to sell and its value in use. If, in subsequent re-<br />
porting periods, there are grounds to believe that the<br />
impairment no longer exists, IAS 36 requires a writeback<br />
up to the recoverable amount but to no more than<br />
the asset’s amortized cost.<br />
OTHER ASSETS<br />
The line item Other assets consists mainly of receivables<br />
not resulting from core banking relationships (essen-<br />
31
32<br />
tially, receivables resulting from supplies and services),<br />
tax assets, coin and inventories as well as the positive<br />
fair values of derivatives not held for trading and receivables<br />
arising from accruals of interest on such derivatives.<br />
Inventories were measured at the lower of their cost and<br />
net realizable value. Net realizable value is defined as<br />
the estimated selling price in the ordinary course of<br />
business less the estimated costs to sell.<br />
PAYABLES<br />
Financial liabilities not designated as at fair value<br />
through profit or loss or classified as held for trading<br />
were measured at amortized cost. Accrued interest was<br />
reported in the pertinent line item on the Balance Sheet.<br />
Premiums and discounts are accrued over a payable’s<br />
term.<br />
Insofar as the exposure to interest rate risk arising from<br />
payables was hedged against in a fair value hedge,<br />
carrying amounts were adjusted by the amount of the<br />
changes in value arising from the interest rate risk (basis<br />
adjustment).<br />
LIABILITIES EVIDENCED BY PAPER<br />
Any difference between the issue price and settlement<br />
amount of a liability evidenced by paper and measured<br />
at amortized cost is spread over the term of the liability<br />
as a write-up or write-down. Zero-coupon bonds and<br />
similar obligations were measured on a present value<br />
basis.<br />
The recognized total of liabilities evidenced by paper<br />
was reduced by the amount of the securities issued by<br />
the enterprise that had been repurchased. Insofar as<br />
the exposure to interest rate risk associated with such<br />
issuances was hedged against in a fair value hedge,<br />
carrying amounts were adjusted by the amount of the<br />
changes in value arising from the interest rate risk (basis<br />
adjustment). To avoid any accounting mismatch, liabilities<br />
evidenced by paper that were designated as at fair<br />
value through profit or loss were measured in the same<br />
way as interest rate derivative financial instruments using<br />
the fair value option.<br />
TRADING LIABILITIES<br />
Trading liabilities are held for the purpose of exploiting<br />
short-term fluctuations in market prices.<br />
Derivatives held for trading were measured at fair value.<br />
In the case of listed products, exchange prices or prices<br />
close to market prices (Bloomberg, Reuters) were used<br />
as fair values. If such prices were not available, forwards<br />
were measured using internal prices based on<br />
present value calculations and options were measured<br />
using appropriate option price models. Where fair values<br />
were positive, these derivatives were recognized in<br />
the line item Trading assets. Where fair values were<br />
negative, they were recorded on the Balance Sheet in<br />
the line item Trading liabilities. The fair values of derivatives<br />
were calculated without accrued interest (giving<br />
clean prices). Positive and negative fair values were not<br />
netted off against each other. Liabilities arising from<br />
accruals of interest on derivatives held for trading were<br />
also reported in the line item Trading liabilities. Changes<br />
in their clean prices were recognized in the Income<br />
Statement in the line item Net trading income.<br />
Realized and unrealized gains and losses on trading liabilities<br />
and interest income and expenses arising from<br />
derivatives held for trading were recognized in the Income<br />
Statement in the line item Net trading income.<br />
OTHER LIABILITIES<br />
Other liabilities consists mainly of liabilities not resulting<br />
from core banking relationships. These were essentially<br />
payables resulting from supplies of goods and services,<br />
tax liabilities and other payables. Negative fair values of<br />
derivative financial instruments and liabilities arising from<br />
accruals of interest on such derivatives were reported in<br />
this line item. The obligation to transfer profits to Raiffeisen-Holding<br />
NÖ-<strong>Wien</strong>—the parent of RLB NÖ-<strong>Wien</strong>—<br />
under the profit-transfer agreement was also accounted<br />
for here.<br />
PROVISIONS<br />
Provisions were created if there was a reliably determinable<br />
legal or actual obligation to a third party.<br />
All provisions for so-called social capital (for postemployment,<br />
termination and jubilee benefits and for<br />
part-time work by older staff) were created in accordance<br />
with IAS 19 Employee Benefits using the projected<br />
unit credit method.<br />
We distinguished between two kinds of postemployment<br />
old-age benefit plan:<br />
Defined contribution plan: Sums are transferred to a<br />
pension fund for a group of employees. The fund manages<br />
the money and pays the post-employment benefits.<br />
The enterprise does not have any further obligations.<br />
The investment risk associated with the pension<br />
fund’s investment activities is borne by the employee. In<br />
other words, the enterprise merely makes a promise to<br />
the employee to pay the contributions to the pension<br />
fund and does not promise any amount of subsequent<br />
pension payments. In the case of such plans, payments<br />
to the pension fund are treated as current expenditure.
Defined benefit plan: The RLB NÖ-<strong>Wien</strong> Group has, with<br />
legal and binding effect and irrevocably, promised a<br />
group of employees defined benefit plans (by way of socalled<br />
post-employment benefit statutes, special<br />
agreements) that specify the amounts of subsequent<br />
pensions. These plans are in part unfunded (i.e. the<br />
funds needed to pay for them remain within the enterprise)<br />
and partly funded (i.e. the funds are saved with<br />
the pension fund and/or insurers). In the case of benefit<br />
payments under post-employment benefit statutes financed<br />
via the pension fund, the entitlement is determined<br />
once, at the time the employee retires, and then<br />
transferred to a defined contribution plan. Such a removal<br />
from the scope of actuarial valuations is reported<br />
separately.<br />
No allowance was made for fluctuation rates in the provision<br />
for post-employment benefits because the<br />
Group’s commitments were founded on promises made<br />
in individual contracts that were individualized and irrevocable<br />
with respect to the post-employment benefit.<br />
To ascertain termination benefit obligations in the case<br />
of employees who joined the organization up to and<br />
including 2002, the present value of the total obligation<br />
and additional entitlements earned in the period under<br />
review were determined using the projected unit credit<br />
method in accordance with generally accepted actuarial<br />
practice. In the case of all employees who joined the<br />
organization on or after 1 January 2003, the termination<br />
benefit obligations were assumed by a staff benefit fund<br />
and a defined contribution system is in place. The enterprise<br />
pays contributions to a staff benefit fund on the<br />
basis of legislative provisions. Having paid the contributions,<br />
the enterprise does not have any further benefit<br />
obligations.<br />
Besides invalidity rates, mortality rates and factors arising<br />
in connection with the termination of employment<br />
upon the attainment of retirement age, the Group also<br />
applied annual years-of-service dependent fluctuation<br />
rates using internal statistical data on premature terminations<br />
of employment.<br />
The same applied, mutatis mutandis, to the provision for<br />
jubilee benefits (after 25 and 35 years of service). When<br />
calculating the provision for part-time work by older staff,<br />
account was taken of the individual time span of each<br />
promise. No fluctuation rates were applied.<br />
Allowance was made for actuarial gains and losses on<br />
provisions for termination and post-employment benefits<br />
using the corridor method. Applying this method, actuarial<br />
gains and losses were only recognized on the<br />
Balance Sheet if one of the limits laid down in the standard,<br />
namely of 10 per cent of the present value of the<br />
defined benefit obligation (DBO) or 10 per cent of the<br />
present value of the plan assets, had been exceeded at<br />
the end of the previous reporting period, the bigger gain<br />
or loss being recognized. Amounts outside the corridor<br />
are amortized over the average remaining period of<br />
service of the active employee as determined by an<br />
expert.<br />
The actuarial parameters used to calculate provisions for<br />
termination and post-employment benefits are described<br />
in more detail in Note (28) Provisions.<br />
Expenditure on provisions for post-employment benefits<br />
was reported in the Income Statement in the line item<br />
General administrative expenses.<br />
Other provisions were created for indefinite obligations<br />
to third parties in the amount of the expected claims.<br />
These provisions were not discounted because the<br />
interest effect of discounting them was unlikely to have<br />
any material effects on the <strong>Annual</strong> Financial Statements.<br />
SUBORDINATED DEBT CAPITAL<br />
The subordinated liabilities recognized at amortized cost<br />
comprised subordinated liabilities within the meaning of<br />
§ 23 Abs. 8 BWG and supplementary capital within the<br />
meaning of § 23 Abs. 7 BWG. The capitalized amount<br />
was reduced by the amount of securities issued by the<br />
enterprise that had been repurchased. Insofar as the<br />
exposure to the interest rate risk associated with such<br />
instruments was hedged against in a fair value hedge,<br />
carrying amounts were adjusted by the amount of the<br />
changes in value arising from the interest rate risk (basis<br />
adjustment). Associated accrued interest was also<br />
reported in this line item on the Balance Sheet.<br />
If the performance and repayable amount of subordinated<br />
liabilities depended on the performance of a specific<br />
portfolio of assets, accounting mismatches were<br />
avoided by designating all the assets and liabilities as at<br />
fair value through profit or loss. Such liabilities were<br />
subordinated within the meaning of § 45 Abs. 4 BWG.<br />
Subordinated liabilities were also designated as at fair<br />
value through profit or loss if they were measured in the<br />
same way as interest rate derivative financial instruments<br />
using the fair value option so as to avoid any<br />
accounting mismatch.<br />
EQUITY<br />
Equity is made up of paid-in capital, this being capital<br />
made available to the entity (subscribed share capital,<br />
non-voting non-ownership capital [Partizipationskapital]<br />
within the meaning of § 23 Abs. 4 BWG and capital<br />
reserves), and earned capital (retained earnings, liable<br />
reserves [Haftrücklage], profit carryforward, profit for the<br />
year, ‘other comprehensive income’ [comprising gains<br />
and losses resulting from cash flow hedges not recognized<br />
in the Income Statement, the available-for-sale<br />
reserve, the Group’s interest in the ‘other comprehensive<br />
income’ of entities accounted for using the equity me-<br />
33
34<br />
thod and deferred taxes taken to Other comprehensive<br />
income]).<br />
Minority interests in the equity of consolidated subsidiaries<br />
were reported separately in this line item.<br />
INCOME TAX<br />
Income tax was recognized and measured in conformity<br />
with IAS 12 using the balance sheet liability method.<br />
Deferred taxes were calculated on the basis of temporary<br />
differences between carrying amounts in the Consolidated<br />
Financial Statements and the tax base that<br />
were going to balance out in subsequent periods. Deferred<br />
taxes were formed to adjust current tax expense<br />
as recognized in the Income Statement in the IFRScompliant<br />
annual financial statements to the profit for<br />
the year reported therein as if that profit for the year were<br />
the basis of assessment for tax. The recognition of<br />
deferred tax assets or liabilities anticipated the future tax<br />
effects of present and past events. Deferred tax assets<br />
and liabilities were netted off against each other in respect<br />
of each taxable unit. Deferred tax assets resulting<br />
from tax loss carryforwards were recognized if the same<br />
taxable unit was expected to record a corresponding<br />
amount of taxable profits in the future.<br />
Since the assessment year 2005, RLB NÖ-<strong>Wien</strong> has<br />
been a member of a taxable enterprises group (steuerliche<br />
Unternehmensgruppe) within the meaning of<br />
§ 9 KStG (Austrian corporation tax act) under group<br />
parent (Gruppenträger) Raiffeisen-Holding NÖ-<strong>Wien</strong>. It<br />
has signed a tax contribution agreement (Steuerumlagenvereinbarung)<br />
with its group parent. The profittransfer<br />
agreement, signed among other things because<br />
of prior group taxation rules (Organschaft), remains in<br />
place. In the assessment year 2010, the taxable enterprises<br />
group under group parent Raiffeisen-Holding NÖ-<br />
<strong>Wien</strong> had 82 members besides group member RLB NÖ-<br />
<strong>Wien</strong> (2009: 87). The basis of assessment for tax on the<br />
group as a whole is the sum of the earnings of the group<br />
parent and the allocated taxable profits of the group<br />
members taking account of the group parent’s tax loss<br />
carryforwards to the extent allowed by law. RLB NÖ-<br />
<strong>Wien</strong> incurs group corporation tax (Gruppenkörperschaftsteuer),<br />
which is assessed at the level of the<br />
group parent Raiffeisen-Holding NÖ-<strong>Wien</strong>, on a proportionate<br />
basis. A contractually agreed tax contribution is<br />
payable to group parent Raiffeisen-Holding NÖ-<strong>Wien</strong> for<br />
the untaxed portion of the taxable profit of RLB NÖ-<br />
<strong>Wien</strong>. If RLB NÖ-<strong>Wien</strong> makes a tax loss, a negative tax<br />
contribution will be charged.<br />
Deferred taxes were measured applying the corporation<br />
tax rate of 25 per cent in force on the balance sheet<br />
date. The gains and losses taken to equity (cash flow<br />
hedge reserve, available-for-sale reserve) were, likewise,<br />
adjusted by the amount of deferred tax on a proportionate<br />
basis.<br />
Income tax assets and liabilities were recognized in<br />
Other assets or Other liabilities. Deferred tax assets and<br />
liabilities were recognized in Other assets or Tax provisions.<br />
Profit-based current and deferred taxes were<br />
recognized in the Income Statement in the line item<br />
Income tax. Non-profit based taxes were recognized in<br />
the Income Statement in the line item Other operating<br />
profit/(loss). Deferred taxes were not discounted.<br />
INCOME STATEMENT<br />
Besides interest income and interest expenses, the line<br />
item Net interest income also includes all similar recurring<br />
and non-recurring income and charges. Interest<br />
and similar income and charges were measured on an<br />
accrual basis using the effective interest rate method.<br />
This line item also includes all interest and dividend<br />
income from securities and earnings from associates<br />
and non-consolidated subsidiaries. Dividend income<br />
was recognized as of the time when the right to payment<br />
arose.<br />
The line item Impairment charge on loans and advances<br />
includes all expenses and income in connection with the<br />
revaluation of loans and advances to customers and<br />
other banks and in connection with other credit risks for<br />
which provisions were created.<br />
The line item Net fee and commission income includes<br />
all income and expenses arising with legal and binding<br />
effect in connection with the rendering of services.<br />
Net trading income includes all realized and unrealized<br />
gains and losses arising from trading in securities, currencies<br />
and derivatives and interest income and interest<br />
expenses arising from derivatives held for trading. Interest<br />
and dividend income arising from securities held for<br />
trading and the costs of funding them were recognized<br />
in the line item Net interest income.<br />
Profit from investments in entities accounted for using<br />
the equity method made a material contribution to consolidated<br />
profit. It is presented in a separate line item.<br />
Profit/(loss) from financial investments includes all realized<br />
and unrealized gains and losses on financial investments,<br />
securities classified as current financial assets<br />
and other financial instruments designated as at fair<br />
value through profit or loss using the fair value option.<br />
Consequently, to avoid any accounting mismatch, revaluation<br />
gains and losses on derivatives measured in<br />
the same way as securities classified as ‘other’ current<br />
financial assets using the fair value option as well as<br />
liabilities evidenced by paper and subordinated liabilities<br />
designated as at fair value through profit or loss were<br />
reported in this line item in the Income Statement. Revaluation<br />
gains and losses arising from an impairment or<br />
reversal of an impairment loss were likewise reported in<br />
this line item.
General administrative expenses includes staff costs,<br />
other administrative expenses and depreciation/amortization/write-offs<br />
of intangible assets and property and<br />
equipment.<br />
Other operating profit/(loss) includes all revaluation<br />
gains and losses on ‘other’ derivatives in the banking<br />
book as well as the Group’s other operating profit/(loss).<br />
REPO TRANSACTIONS<br />
During ‘genuine’ repurchase (repo) transactions, the<br />
Group sells assets to a counterparty and undertakes at<br />
the same time to repurchase the same assets on a<br />
specified date at a specified price. The assets remain<br />
on the Group’s Balance Sheet and are measured applying<br />
the rules governing the respective measurement<br />
category. At the same time, an obligation in the amount<br />
of the payments received is recognized as a liability.<br />
During reverse repo transactions, assets are acquired<br />
subject to a simultaneous undertaking to sell them in the<br />
future subject to payment. Such transactions were<br />
recognized on the Balance Sheet in the line item Loans<br />
and advances to other banks or Loans and advances to<br />
customers. Interest expenses arising from repos and<br />
interest income from reverse repos are deferred over the<br />
transaction’s term. They were recognized in the line<br />
item Net interest income.<br />
In the case of a ‘non-genuine’ or ‘pseudo’ repo (unechtes<br />
Pensionsgeschäft), the seller is obliged to repurchase<br />
the pledged asset but is not entitled to demand<br />
its sale. Retransfer is solely at the discretion of the<br />
purchaser. The right to retransfer the asset constitutes a<br />
put option for the purchaser in respect of which the<br />
seller acts as writer of the option. If the put option is<br />
deeply in the money, the securities will not be derecognized<br />
in the seller’s accounts because the associated<br />
rewards and risks are retained. If the put option is deeply<br />
out of the money, repurchase is very unlikely and the<br />
pledged security must be derecognized. If the put option<br />
is neither deeply out of the money nor deeply in the<br />
money, one must ascertain whether the transferring<br />
entity (seller) still has power of disposal over the asset.<br />
If the security is traded in an active market, one can<br />
assume that power of disposal will be transferred and<br />
the pledged security will be derecognized. In the case<br />
of a financial asset not traded in an active market, the<br />
pledged security must continue to be recognized on the<br />
seller’s balance sheet.<br />
TRUST ACTIVITIES<br />
Transactions undertaken in the management or placing<br />
of assets for account of third parties were not recognized<br />
on the Balance Sheet. Commission payments<br />
arising from such transactions were recognized in the<br />
line item Net fee and commission income.<br />
LEASING<br />
During the period under review, the Group did not carry<br />
on any active leasing business as lessor. Lease<br />
relationships only existed where the Group was lessee.<br />
The leases of material importance to the Group, namely<br />
vehicle leases, were operating leases for the purposes<br />
of IAS 17. The resulting lease instalments were<br />
recorded in the Income Statement as current<br />
expenditure in the line item General administrative<br />
expenses.<br />
FOREIGN CURRENCY TRANSLATIONS<br />
Foreign currency translations took place in accordance<br />
with the provisions of IAS 21. As a result, non-euro<br />
monetary assets and liabilities were translated at the<br />
market exchange rates (usually ECB reference rates)<br />
ruling at the balance sheet date. Non-monetary assets<br />
and liabilities not measured at fair value were measured<br />
applying the rates ruling at the dates of their initial acquisition.<br />
Non-monetary assets and liabilities measured<br />
at fair value were translated at the market exchange<br />
rates (usually ECB reference rates) ruling at the balance<br />
sheet date<br />
Items in the Income Statement were immediately translated<br />
into the functional currency as at the time they<br />
came into being applying the rates ruling at the date of<br />
the transaction.<br />
LATITUDE OF JUDGEMENT AND ESTIMATES<br />
In the Consolidated Financial Statements, latitude of<br />
judgement was employed when applying recognition and<br />
measurement policies and, to a certain extent, estimates<br />
and assumptions were made that affected the recognition<br />
of assets and liabilities, the statement of contingent<br />
liabilities at the balance sheet date and the reporting of<br />
income and expenses during the reporting period.<br />
When applying recognition and measurement policies,<br />
Management exercised its latitude of judgement in the<br />
light of the purpose of the <strong>Annual</strong> Financial Statements,<br />
which is to provide meaningful information about the<br />
enterprise’s assets, liabilities, financial position and<br />
profit or loss and about changes in its assets, liabilities<br />
and financial position.<br />
Assumptions and estimates were, above all, made when<br />
determining the fair values of some financial instruments,<br />
recognizing impairment allowances for future<br />
losses on loans and advances and interest rebates,<br />
creating provisions for post-employment benefits, termination<br />
benefits and similar obligations as well as other<br />
provisions, determining discounted cash flows during<br />
impairment testing and determining the useful lives of<br />
non-current assets. Actual results may differ from estimates.<br />
35
36<br />
NEW STANDARDS AND INTERPRETATIONS<br />
The following new and revised standards and interpretations were applicable to financial years ending on or before<br />
31 December 2010:<br />
Effective for <strong>Annual</strong><br />
Periods Beginning Already Adopted<br />
New Provisions<br />
Amendments to Standards<br />
On or After by the EU<br />
IAS 1 Presentation of Financial Statements (revised April 2009) 1 January 2010 Yes<br />
IAS 7 Statement of Cash Flows (revised April 2009) 1 January 2010 Yes<br />
IAS 17 Leases (revised April 2009)<br />
Consequential amendments arising from amendments to<br />
1 January 2010 Yes<br />
IAS 27 IFRS 3 (amended 2008) 1 July 2009 Yes<br />
IAS 36 Impairment of Assets (revised April 2009) 1 January 2010 Yes<br />
IAS 38 Intangible Assets (revised April 2009) 1 January 2010 Yes<br />
IAS 39 Amendment for eligible hedged items (revised July 2008)<br />
Amendments for embedded derivatives when reclassifying<br />
1 July 2009 Yes<br />
IAS 39 financial instruments (revised March 2009)<br />
Financial Instruments: Recognition and Measurement<br />
30 June 2009 Yes<br />
IAS 39 (revised April 2009)<br />
First-time Adoption of International Financial <strong>Report</strong>ing<br />
1 January 2010 Yes<br />
IFRS 1 Standards (revised November 2008)<br />
Amendments relating to oil and gas assets and determining<br />
1 July 2009 Yes<br />
IFRS 1 whether an arrangement contains a lease (revised July 2009) 1 January 2010 Yes<br />
IFRS 2 Share-based Payment (revised April 2009)<br />
Amendments relating to group cash-settled share-based<br />
1 July 2009 Yes<br />
IFRS 2 payment transactions (revised June 2009)<br />
Comprehensive revision on applying the acquisition method<br />
1 January 2010 Yes<br />
IFRS 3 (2008)<br />
Non-current Assets Held for Sale and Discontinued<br />
1 July 2009 Yes<br />
IFRS 5 Operations (revised May 2008)<br />
Non-current Assets Held for Sale and Discontinued<br />
1 July 2009 Yes<br />
IFRS 5 Operations (revised April 2009) 1 January 2010 Yes<br />
IFRS 8 Operating Segments (revised April 2009) 1 January 2010 Yes<br />
New Interpretations<br />
IFRIC 17 Distributions of Non-cash Assets to Owners 1 July 2009 Yes<br />
IFRIC 18 Transfers of Assets from Customers 1 July 2009 Yes<br />
Withdrawn Interpretations<br />
IFRIC 8 Scope of IFRS 2 1 January 2010 Yes<br />
IFRIC 11 IFRS 2: Group and Treasury Share Transactions 1 January 2010 Yes<br />
Amendments to Interpretations<br />
IFRIC 9 Reassessment of Embedded Derivatives (amended 2009)<br />
Hedges of a Net Investment in a Foreign Operation<br />
1 July 2009 Yes<br />
IFRIC 16 (amended 2009) 1 July 2009 Yes<br />
Essentially, the revised IFRS 3 gives the option of measuring<br />
goodwill using the full goodwill method. Using this<br />
option, when less than 100 per cent of the shares in an<br />
entity are acquired, the goodwill attributable to the<br />
shares held by other shareholders is also recognized. In<br />
future, if control is not lost, changes in ownership interests<br />
will not be recognized in profit or loss.<br />
The amendment to IAS 39 provides guidance on hedging<br />
inflation for certain hedged items and the designation<br />
of options by their intrinsic or time value.<br />
The changes to IFRS 2 stipulate that not just equitysettled<br />
group share-based payment transactions but<br />
also cash-settled ones must be disclosed in the separate<br />
IFRS-compliant financial statements of a subsidiary.<br />
IFRIC 8 and IFRIC 11 were integrated into IFRS 2 and<br />
withdrawn as interpretations.<br />
The <strong>Annual</strong> Improvements to the IFRSs in 2009 changed<br />
details in a number of standards and interpretations.<br />
The revisions of and amendments to financial reporting<br />
and accounting standards that we have listed did not<br />
have any material effects on the Consolidated Financial<br />
Statements of the RLB NÖ-<strong>Wien</strong> Group.
The following standards and interpretations already issued by the IASB or IFRIC but not yet in force were not applied<br />
ahead of schedule in these Consolidated Financial Statements:<br />
New Provisions<br />
New Standard<br />
IFRS 9<br />
Amendments to Standards<br />
IFRS 9 changes the classification and measurement of<br />
financial instruments. This standard is the conclusion of<br />
the first part of a three-phase project designed to replace<br />
IAS 39 in its present form. IFRS 9 only offers two<br />
categories of financial instrument: debt instruments<br />
measured at amortized cost and equity instruments<br />
measured at fair value through profit or loss (or, in part<br />
and as an option, through other comprehensive income).<br />
In the new stipulations regarding the recognition<br />
of financial liabilities, the fair value option is still available,<br />
but the amount of the change in fair value caused<br />
by a change in default risk is recorded in equity as other<br />
comprehensive income. The remaining amount is still<br />
recognized in profit or loss.<br />
A final assessment of the effects of this new standard<br />
will only be possible when Phase 2: Impairment Methodology<br />
and Phase 3: Hedge Accounting have been<br />
completed. Phases 2 and 3 are to be finalized in 2011.<br />
Effective for <strong>Annual</strong><br />
Periods Beginning<br />
On or After<br />
Already<br />
Adopted<br />
by the EU<br />
Financial Instruments: Classification and Measurement (November<br />
2009) 1 January 2013 No<br />
IAS 1 Presentation of Financial Statements (revised May 2010)<br />
Limited scope amendment: recovery of underlying assets<br />
1 January 2011 Yes<br />
IAS 12 (revised December 2010) 1 January 2012 No<br />
IAS 24 Revised definition of related parties (revised November 2009)<br />
Consolidated and Separate Financial Statements<br />
1 January 2011 Yes<br />
IAS 27 (revised May 2010)<br />
Amendments relating to classification of rights issues<br />
1 July 2010 Yes<br />
IAS 32 (revised 2009) 1 February 2010 Yes<br />
IAS 34 Interim Financial <strong>Report</strong>ing (revised May 2010)<br />
First-time Adoption of International Financial <strong>Report</strong>ing Standards<br />
1 January 2011 Yes<br />
IFRS 1 (revised May 2010)<br />
Replacement of ‘fixed dates’ for certain exceptions with ‘the date of<br />
1 January 2011 Yes<br />
IFRS 1 transition to IFRSs’ (revised December 2010)<br />
Additional exemption for entities ceasing to suffer from severe<br />
1 July 2011 No<br />
IFRS 1 hyperinflation (revised December 2010) 1 July 2011 No<br />
IFRS 3 Business Combinations (revised May 2010) 1 July 2010 Yes<br />
IFRS 7 Financial Instruments: Disclosures (revised May 2010)<br />
Amendments enhancing disclosures about transfers of financial<br />
1 January 2011 Yes<br />
IFRS 7 assets (revised October 2010) 1 July 2011 No<br />
New Interpretation<br />
IFRIC 19 Extinguishing Financial Liabilities with Equity Instruments 1 July 2010 Yes<br />
Amendments to Interpretations<br />
IFRIC 13 Customer Loyalty Programmes (amended 2010)<br />
IAS 19 – The Limit on a Defined Benefit Asset, Minimum Funding<br />
1 January 2011 Yes<br />
IFRIC 14 Requirements and their Interaction (amended November 2009) 1 January 2011 Yes<br />
In IAS 24, the definition of related party has been clarified.<br />
In IFRS 7, the disclosure requirements about transferred<br />
financial assets and liabilities have been changed to<br />
improve the reporting of liabilities. This has not changed<br />
the requirements regarding the derecognition of financial<br />
instruments.<br />
With the exception of IFRS 9, the amended and revised<br />
financial reporting and accounting standards described<br />
above will not materially affect the presentation of the<br />
Group’s assets, liabilities, financial position and profit or<br />
loss. The revisions and amendments, including in particular<br />
the changes to IAS 24 and IFRS 7, will result in<br />
corresponding adjustments in the Notes.<br />
37
38<br />
Details of the income statement<br />
(1) NET INTEREST INCOME<br />
€’000 2010 2009<br />
Interest income 685,964 738,485<br />
from loans and advances to other banks 185,695 214,794<br />
from loans and advances to customers 242,016 277,210<br />
from other current financial assets 65,179 64,763<br />
from trading assets and liabilities 4,239 4,571<br />
from financial investments 112,486 102,101<br />
from derivative financial instruments 76,345 75,040<br />
Other 4 6<br />
Current income 19,126 25,122<br />
from shares and other variable-yield securities 17,290 22,902<br />
from equity investments in subsidiaries 312 1,242<br />
from other equity investments 1,524 978<br />
Total interest income and similar income 705,090 763,607<br />
Interest expenses (481,551) (612,640)<br />
on deposits from other banks (192,983) (246,534)<br />
on deposits from customers (78,788) (136,965)<br />
on liabilities evidenced by paper (113,205) (143,343)<br />
on subordinated debt capital (30,195) (27,061)<br />
on derivative financial instruments (66,301) (58,664)<br />
Other (79) (73)<br />
Total interest expenses and similar charges (481,551) (612,640)<br />
Net interest income 223,539 150,967<br />
Interest and similar income and charges were measured on an accrual basis. The distribution of premiums and<br />
discounts on investment securities on the accrual basis of accounting is also reported in Interest income.<br />
Total interest income from and interest expenses on financial assets and liabilities not designated as at fair value<br />
through profit or loss requiring recognition using the effective interest rate method:<br />
€’000 2010 2009<br />
Interest income 540,201 594,111<br />
Interest expenses (380,857) (534,890)
(2) IMPAIRMENT CHARGE ON LOANS AND ADVANCES<br />
€’000 2010 2009<br />
Item-by-item allowances for impairment (27,540) (48,793)<br />
Impairment allowances (82,914) (95,752)<br />
Impairment reversals 54,737 46,379<br />
Direct write-offs (523) (590)<br />
Recoveries of loans and receivables previously written off 1,160 1,170<br />
Collective assessment of impairments of portfolios (2,192) (17,351)<br />
Impairment allowances (2,193) (17,389)<br />
Impairment reversals 1 38<br />
Total (29,732) (66,144)<br />
See Note (16) Impairment allowance balance for details of impairment allowances.<br />
(3) NET FEE AND COMMISSION INCOME<br />
€’000 2010 2009<br />
Payment services 16,036 13,556<br />
Credit and guarantee operations 8,827 5,448<br />
Securities operations 23,475 18,366<br />
Foreign exchange, notes-and-coin and precious-metals business 4,995 4,935<br />
Other banking services 12,381 12,135<br />
Total 65,714 54,440<br />
Fee and commission income came to €94,821 thousand (2009: €79,698 thousand). Fee and commission expenses<br />
came to €29,107 thousand (2009: €25,259 thousand). No fee and commission payments were received for trust<br />
activities.<br />
(4) NET TRADING INCOME<br />
Net trading income captures interest income from and interest expenses on derivatives held for trading and realized<br />
and unrealized changes in the fair values of trading portfolios. Interest and dividend income and the interest costs of<br />
funding securities held for trading were recognized in Net interest income.<br />
€’000 2010 2009<br />
Interest rate contracts 859 9,004<br />
Of which from securities 1,666 7,283<br />
Of which from derivative contracts (807) 1,721<br />
Currency contracts 14,938 8,349<br />
Equity and index contracts 5,504 4,611<br />
Of which from securities 5,228 4,360<br />
Of which from derivative contracts 276 251<br />
Other contracts 2,888 1,018<br />
Total 24,189 22,982<br />
39
40<br />
(5) PROFIT FROM INVESTMENTS IN ENTITIES ACCOUNTED FOR USING THE EQUITY METHOD<br />
€’000 2010 2009<br />
Group interest in annual profits or losses 255,580 125,321<br />
Revaluation gains and losses 850 3,969<br />
Total 256,430 129,290<br />
In 2009, this line item included a one-off effect of €13.3 million caused by an increase in the Group’s interest in RBI<br />
and by the first-time use of the equity method to account for the investment in Raiffeisen Informatik GmbH (stake<br />
held: 47.75 per cent) as a result of recognizing negative goodwill.<br />
(6) PROFIT/(LOSS) FROM FINANCIAL INVESTMENTS<br />
€’000 2010 2009<br />
Gains less losses from financial investments classified as held to maturity 2,537 3,051<br />
Of which revaluation gains and losses (2,221) (2,716)<br />
Of which gains and losses on disposal 4,758 5,767<br />
Gains less losses from financial investments classified as available for<br />
sale and measured at fair value (1,785) (8,831)<br />
Of which revaluation gains and losses 392 (10,937)<br />
Of which gains and losses on disposal<br />
Gains less losses from financial investments classified as available for<br />
(2,177) 2,106<br />
sale and measured at cost 246 389<br />
Of which revaluation gains and losses (270) 0<br />
Of which gains and losses on disposal<br />
Gains less losses from investments in entities accounted for using the<br />
516 389<br />
equity method 187 3,040<br />
Of which gains and losses on disposal<br />
Gains less losses from unlisted securities recognized as receivables and<br />
187 3,040<br />
classified as loans and receivables 953 (1,157)<br />
Of which revaluation gains and losses 0 (1,155)<br />
Of which gains and losses on disposal<br />
Gains less losses from financial instruments designated as at fair value<br />
953 (2)<br />
through profit or loss 1,205 29,008<br />
Of which revaluation gains and losses 2,460 20,789<br />
Of which gains and losses on disposal (1,255) 8,219<br />
Realized gains and losses from liabilities measured at cost 808 (977)<br />
Total 4,151 24,523<br />
Gains less losses from financial instruments designated as at fair value through profit or loss comprises gains and<br />
losses from securities classified as current financial assets and gains and losses from other financial instruments<br />
designated as at fair value through profit or loss under the fair value option. Consequently, to avoid any accounting<br />
mismatch, revaluation gains and losses on derivatives and on liabilities evidenced by paper and subordinated liabilities<br />
designated as at fair value through profit or loss that were measured in the same way using the fair value option<br />
were reported in this line item in the Income Statement. All changes in value in the other categories that were not<br />
recognized in profit or loss were due to impairments.<br />
Gains less losses from financial instruments designated as at fair value through profit or loss is the net result of fluctuations<br />
in value. Gains less losses from financial investments classified as available for sale and measured at fair<br />
value includes a write-up in the amount of €392 thousand. All changes in value in the other categories were due to<br />
impairments.
(7) GENERAL ADMINISTRATIVE EXPENSES<br />
€’000 2010 2009<br />
Staff costs (99,120) (95,470)<br />
Of which wages and salaries (72,505) (69,412)<br />
Of which social security costs (18,203) (17,529)<br />
Of which voluntary fringe benefits (1,808) (1,705)<br />
Of which expenditure on termination and post-employment benefits (6,604) (6,824)<br />
Other administrative expenses (77,468) (71,678)<br />
Of which building rental, maintenance and operating costs (18,024) (18,560)<br />
Of which IT costs (25,943) (21,858)<br />
Of which advertising and entertainment expenses (14,189) (12,851)<br />
Of which other items (19,312) (18,409)<br />
Depreciation/amortization/write-offs of property and equipment and<br />
intangible assets (4,155) (3,963)<br />
Of which of property and equipment (2,502) (2,519)<br />
Of which of intangible assets (1,653) (1,444)<br />
Total (180,743) (171,111)<br />
Other administrative expenses includes rental and leasing expenses in the amount of €15,529 thousand (2009:<br />
€16,162 thousand).<br />
The fees paid to the auditors of Group members contained in the line item Other administrative expenses broke<br />
down as follows:<br />
Financial Year 2010<br />
Österreichischer<br />
€'000<br />
Audit of the <strong>Annual</strong> Financial Statements and Consolidated Financial<br />
KPMG Austria GmbH Raiffeisenverband<br />
Statements 203 479<br />
Other auditing services 10 116<br />
Tax consulting services 9 0<br />
Other services 23 52<br />
Total 245 647<br />
Financial Year 2009<br />
Österreichischer<br />
€'000 KPMG Austria GmbH Raiffeisenverband<br />
Audit of the <strong>Annual</strong> Financial Statements and Consolidated Financial<br />
Statements<br />
180 462<br />
Other auditing services 29 127<br />
Tax consulting services 11 0<br />
Other services 29 27<br />
Total 249 616<br />
41
42<br />
(8) OTHER OPERATING PROFIT/(LOSS)<br />
Other operating profit/(loss) includes, inter alia, income<br />
and expenses arising from non-banking activities and<br />
from the disposal of property and equipment and intangible<br />
assets. Changes in the values of derivatives designated<br />
in a hedge accounting relationship that required<br />
recognition in profit or loss were recognized in this line<br />
item. Moreover, this line item also contains revaluation<br />
gains and losses on derivative financial instruments that<br />
were neither held in the trading portfolio nor hedging<br />
instruments within the meaning of IAS 39.<br />
€’000 2010 2009<br />
Effect of hedge accounting<br />
Of which revaluation gains and losses on hedging instruments in fair value<br />
(1,426) (952)<br />
hedges 55,392 (768)<br />
Of which revaluation gains and losses on hedged items in fair value hedges (56,818) (184)<br />
Gains less losses from other derivatives (57,359) 18,049<br />
Of which from interest rate derivatives (53,993) 9,646<br />
Of which from currency derivatives (1,267) (602)<br />
Of which from equity and index contracts 1,508 1,721<br />
Of which from credit derivatives (3,607) 7,284<br />
Other operating income 15,676 14,688<br />
Of which income from services and reimbursed costs 13,029 12,158<br />
Of which other items 2,647 2,327<br />
Other operating expenses (4,163) (1,699)<br />
Of which damages (3,353) (920)<br />
Of which arising from the solidarity association (Solidaritätsverein) (633) (619)<br />
Of which other items (177) (160)<br />
Total (47,272) 30,086<br />
(9) PROFIT/(LOSS) FROM FINANCIAL INSTRUMENTS<br />
€’000 2010 2009<br />
Gains less losses from financial instruments designated as at fair value<br />
through profit or loss 15,137 139,611<br />
Of which from financial instruments held for trading<br />
Of which from financial instruments designated as at fair value through profit<br />
(3,067) 67,844<br />
or loss<br />
Gains less losses from financial instruments classified as available for<br />
18,204 71,767<br />
sale<br />
Of which taken from other comprehensive income and recognized in profit or<br />
57,349 25,468<br />
loss for the financial year (2,177) (8,831)<br />
Of which taken directly to the Income Statement for the financial year 59,526 34,299<br />
Gains less losses from financial instruments classified as held to maturity 67,812 82,477<br />
Gains less losses from financial instruments classified as loans and<br />
receivables 398,936 424,709<br />
Gains less losses from liabilities measured at cost (380,049) (535,867)<br />
Total 159,185 136,398<br />
Gains and losses in each valuation category comprise realized and unrealized gains and losses, interest income,<br />
interest expenses, dividends and other distributions. These disclosures are made in accordance with the requirements<br />
of IFRS 7, para 20(a). Gains and losses on available-for-sale financial instruments recognized in Other comprehensive<br />
income are presented in C. Statement of Changes in Equity.
(10) INCOME TAX<br />
€’000 2010 2009<br />
Current income tax (7,002) (3,264)<br />
Of which tax attributed to the group parent (7,059) (3,100)<br />
Of which current domestic tax (60) (149)<br />
Of which current foreign tax 117 (15)<br />
Deferred tax (701) (820)<br />
Total (7,703) (4,084)<br />
The following reconciliation shows the relationship between profit for the year and actual tax expense:<br />
€’000 2010 2009<br />
Profit for the year before tax 316,276 175,033<br />
Theoretical income tax expense based on the income tax rate of 25 per cent (79,069) (43,758)<br />
Effect of the lower tax contribution rate 1 10,728 6,760<br />
Reduction in the tax burden because of tax-exempt income from equity<br />
participations and other tax-exempt income 66,250 36,925<br />
Increase in the tax burden because of non-tax deductible expenses (7,185) (4,001)<br />
Use of tax loss carryforwards and remeasurement of deferred tax items (181) (127)<br />
Other 1,754 117<br />
Actual tax burden (7,703) (4,084)<br />
1 The tax contribution rates agreed within the scope of the group taxation regime were lower than the Austrian corporate tax rate. This line item shows<br />
the resulting effect on the actual income tax burden.<br />
(11) EARNINGS PER SHARE<br />
€’000 2010 2009<br />
Consolidated net profit for the year<br />
Less distribution in respect of non-voting non-ownership capital<br />
308,565 170,936<br />
(Partizipationskapital) (3,825) (3,825)<br />
Adjusted consolidated net profit for the year 304,740 167,111<br />
Average number of ordinary shares in issue 2,145,201 2,145,201<br />
Undiluted earnings per share, € 142.06 77.90<br />
There were no conversion or option rights in circulation. Consequently, undiluted earnings per share were identical to<br />
diluted earnings per share.<br />
43
44<br />
(12) SEGMENTAL REPORTING<br />
Segmental reporting is based on the Group’s internal<br />
Management performance calculations, which take the<br />
form of a multi-stage contribution income statement.<br />
Income and expenses are allocated on a cost-by-cause<br />
basis. The income items are net interest income, net fee<br />
and commission income, net trading income and other<br />
operating profit/(loss). Net interest income is calculated<br />
on a market-interest rate basis.<br />
Interest earnings from equity are allocated to individual<br />
segments according to regulatory capital requirements<br />
on the basis of an assumed interest rate and reported in<br />
Net interest income. The Impairment charge on loans<br />
and advances captures the net impairment allowance<br />
for counterparty risks and direct write-offs less recoveries<br />
of loans and advances previously written off. General<br />
administrative expenses includes direct and indirect<br />
costs. Direct costs (Staff costs and Other administrative<br />
expenses) are incurred by individual business segments,<br />
whereas indirect costs are allocated on the basis<br />
of predefined ratios.<br />
Segments are presented as if they were autonomous<br />
enterprises with their own capital resources and with<br />
responsibility for their own results.<br />
Segments are defined according to the RLB NÖ-<strong>Wien</strong><br />
customers being serviced.<br />
Our segmental reports distinguish between the following<br />
segments:<br />
• The Retail Banking segment (personal and business<br />
banking customers) encompasses the<br />
Group’s retail operations in Vienna.<br />
This segment targets all private individuals, small businesses<br />
and self-employed customers. Branches and<br />
offices in Vienna are arranged into branches for retail<br />
banking customers, offices for high net worth personal<br />
banking customers (Private Banking <strong>Wien</strong>), special<br />
centres of excellence for trade and business (Gewerbe<br />
1 ) customers, and consulting offices. The consulting<br />
offices are also open for customers outside<br />
normal banking hours, and a customer can, in addition,<br />
choose where a consultation session should take<br />
place. This modern, pioneering approach reflects both<br />
RLB NÖ-<strong>Wien</strong>’s service-orientated advisory concept<br />
and its local roots.<br />
Offerings in the Retail Banking segment consist mainly<br />
of standardized products like Sparbuch passbook accounts,<br />
savings deposits, time deposits, current and<br />
salary accounts, personal loans, overdrafts and mortgages<br />
and other special purpose loans.<br />
1 As defined by Austria’s Gewerbeordnung (commercial code).<br />
RLB NÖ-<strong>Wien</strong> is the only entity in the Raiffeisen Group<br />
operating in this segment in Vienna. It also supports the<br />
activities of the other institutions in the Raiffeisen organization<br />
through its branch network.<br />
• The Corporate Customers segment encompasses<br />
business conducted with corporate customers<br />
in the Centrope region, the public sector<br />
and institutional clients and International Operations.<br />
This segment covers classical credit services for corporate<br />
customers, corporate finance (project and investment<br />
finance, acquisition finance, property finance),<br />
trade and export finance, documentary services and the<br />
financing of local authorities and financial institutions.<br />
Classical credit services include the provision of working<br />
capital, investment finance and trade finance using a<br />
wide variety of financing instruments (e.g. current account<br />
loans, cash advances, direct loans, factoring,<br />
venture capital finance).<br />
The International Department—a Head Office department—is<br />
responsible for export finance and foreign<br />
investments (e.g. export loans from export funds and<br />
OeKB and OeKB equity finance loans) as well as the<br />
structuring and settlement of letters of credit, collections<br />
and furnishing Austrian and foreign clients with guarantees;<br />
and in addition, the International Department handles<br />
relations with correspondents (Financial Institutions)<br />
and foreign corporate customers.<br />
The activities of the Corporate Finance Department<br />
include handling project and investment finance (specially<br />
tailored financing of specific business projects) in<br />
the Group’s core market and processing all subsidized<br />
credit products. In addition, they include handling<br />
transactions undertaken jointly with the European Investment<br />
Bank (EIB) and Kreditanstalt für Wiederaufbau<br />
(KfW).<br />
• The Financial Markets segment encompasses<br />
the Group’s treasury activities, including in particular<br />
its earnings from management of the<br />
banking book (profit from maturity transformation<br />
[Strukturbeitrag]) and from the trading book.<br />
The Treasury Department is responsible for the Group’s<br />
proprietary positions in on-balance sheet products (e.g.<br />
money-market deposits) and off-balance sheet interest<br />
rate and price products (forwards, futures and options).<br />
These include interest rate and currency contracts, and<br />
the Treasury Department is likewise responsible for<br />
liquidity management and asset liability management<br />
(maturity transformation).
Treasury operations also include the management of<br />
RLB NÖ-<strong>Wien</strong>’s portfolios of bonds, funds and shortterm<br />
and long-term alternative investments (combinations<br />
of securities products with derivatives).<br />
Trading in financial instruments takes place centrally and<br />
is subject to strictly enforced limits. Whereas all proprietary<br />
trading was reported in this segment, profit contributions<br />
made by customer treasury services were allocated<br />
to other segments. The portion of the contribution<br />
to profit made over and above market prices was allocated<br />
to customer segments.<br />
• The Investments segment encompasses RLB<br />
NÖ-<strong>Wien</strong>’s banking-related equity investments,<br />
including in particular its investment in RZB.<br />
This segment primarily encompasses RLB NÖ-<strong>Wien</strong>’s<br />
portfolio of equity investments in banks and other financial<br />
institutions. This also includes its stake in the RZB<br />
Group—which is accounted for using the equity method—and<br />
all of the RZB Group’s activities in Central<br />
and Eastern European countries as well as RLB NÖ-<br />
<strong>Wien</strong>’s equity investments in the Raiffeisen Banks in the<br />
Czech Republic, Slovakia and Hungary and its direct<br />
stakes in RBI and Raiffeisen Informatik GmbH.<br />
• The Management Services segment (which corresponds<br />
to the Raiffeisen Banks/Management<br />
Services and Risk Management/Organization divisions<br />
in the Group’s organizational chart).<br />
This segment encompasses any activities undertaken to<br />
support other segments in the marketplace. They consist,<br />
in particular, of appropriate marketing activities. All<br />
services rendered for Raiffeisenkasse banks within the<br />
scope of the Austrian Raiffeisen organization are included<br />
in this segment. In addition, this segment encompasses<br />
income and expenses that cannot, by their<br />
nature, be allocated to any other segment.<br />
The RLB NÖ-<strong>Wien</strong> Group uses two central steering<br />
benchmarks:<br />
Return on equity expresses the relationship between<br />
profit before tax and average equity employed in the<br />
respective segment.<br />
The cost:income ratio expresses a segment’s cost<br />
efficiency. It is the ratio of general administrative expenses<br />
to the sum of net interest income, net fee and<br />
commission income, net trading income, profit from<br />
investments in entities accounted for using the equity<br />
method and other operating profit/(loss) (i.e. without<br />
profit/(loss) from financial investments and the impairment<br />
charge on loans and advances)<br />
The RLB NÖ-<strong>Wien</strong> Group operates primarily in the Centrope<br />
region, and within that region, mainly in Austria in<br />
the Vienna area.<br />
Financial Year 2010<br />
Retail Corporate Financial<br />
Management<br />
€’000<br />
Banking Customers Markets Investments Services Total<br />
Net interest income 81,989 120,435 78,884 (57,978) 209 223,539<br />
Impairment charge on loans and advances (7,034) (22,230) (468) 0 0 (29,732)<br />
Net interest income after impairment charge 74,955 98,205 78,416 (57,978) 209 193,807<br />
Net fee and commission income 34,554 21,579 (585) 0 10,166 65,714<br />
Net trading income<br />
Profit from investments in entities accounted for<br />
4,886 3,172 11,735 0 4,396 24,189<br />
using the equity method 0 0 0 256,430 0 256,430<br />
Profit/(loss) from financial investments 0 1,584 2,464 103 0 4,151<br />
General administrative expenses (88,848) (33,680) (14,814) (1,727) (41,674) (180,743)<br />
Of which staff costs (53,921) (22,460) (7,211) (447) (15,081) (99,120)<br />
Of which other administrative expenses (32,702) (10,913) (6,334) (1,270) (26,250) (77,468)<br />
Of which depreciation/amortization/write-offs (2,225) (307) (1,269) (11) (343) (4,155)<br />
Other operating profit/(loss) (489) 3,231 (61,827) (36) 11,849 (47,272)<br />
Profit/(loss) for the year before tax 25,058 94,091 15,389 196,792 (15,054) 316,276<br />
Average risk-weighted assets, €m 1,529 7,476 3,277 1,346 487 14,115<br />
Average allocated equity, €m 145 709 311 1,000 47 2,212<br />
Return on equity before tax, % 17.3% 13.3% 4.9% 19.2% — 14.3%<br />
Cost:income ratio, % 73.5% 22.7% 52.5% 0.9% 156.6% 34.6%<br />
45
46<br />
Financial Year 2009<br />
Retail Corporate Financial<br />
Management<br />
€’000<br />
Banking Customers Markets Investments Services Total<br />
Net interest income 77,358 113,810 16,870 (57,918) 847 150,967<br />
Impairment charge on loans and advances (10,874) (55,357) 87 0 0 (66,144)<br />
Net interest income after impairment charge 66,484 58,453 16,957 (57,918) 847 84,823<br />
Net fee and commission income 29,171 17,135 (1,179) 0 9,313 54,440<br />
Net trading income<br />
Profit from investments in entities accounted for<br />
3,937 3,083 12,428 0 3,534 22,982<br />
using the equity method 0 0 0 129,290 0 129,290<br />
Profit/(loss) from financial investments 0 (4,296) 27,107 1,712 0 24,523<br />
General administrative expenses (84,719) (32,689) (13,347) (2,039) (38,317) (171,111)<br />
Of which staff costs (51,816) (21,870) (6,533) (553) (14,698) (95,470)<br />
Of which other administrative expenses (30,817) (10,530) (5,652) (1,467) (23,212) (71,678)<br />
Of which depreciation/amortization/write-offs (2,086) (289) (1,162) (19) (407) (3,963)<br />
Other operating profit 1,405 1,534 16,788 195 10,164 30,086<br />
Profit/(loss) for the year before tax 16,278 43,220 58,754 71,240 (14,460) 175,033<br />
Average risk-weighted assets, €m 1,415 7,088 2,842 1,427 483 13,255<br />
Average allocated equity, €m 132 662 265 914 45 2,018<br />
Return on equity before tax, % 12.3% 6.5% 22.1% 7.8% — 8.7%<br />
Cost:income ratio, % 75.7% 24.1% 29.7% 2.8% 160.6% 44.1%<br />
Profit from investments in entities accounted for using the equity method in the Investments segment included oneoff<br />
effects in the 2009 financial year. See Note (5) Profit from investments in entities accounted for using the equity<br />
method for details.
Details of the Balance Sheet<br />
(13) CASH AND BALANCES WITH THE CENTRAL BANK<br />
€’000 2010 2009<br />
Cash 42,837 47,420<br />
Total 42,837 47,420<br />
(14) LOANS AND ADVANCES TO OTHER BANKS<br />
€’000 2010 2009<br />
Demand deposits 1,161,530 855,838<br />
Time deposits 8,497,247 9,519,535<br />
Other loans and advances 2,446,658 2,273,067<br />
Debt instruments 23,784 39,936<br />
Other 59,294 69,846<br />
Total 12,188,513 12,758,222<br />
Loans and advances to other banks broke down by region as follows:<br />
€’000 2010 2009<br />
Austria 10,608,664 11,094,457<br />
Abroad 1,579,849 1,663,765<br />
Total 12,188,513 12,758,222<br />
With the exception of loans and advances hedged against the exposure to interest rate risks in a fair value hedge,<br />
the loans and advances accounted for here were classified as Loans and receivables.<br />
(15) LOANS AND ADVANCES TO CUSTOMERS<br />
Loans and advances to customers broke down as follows:<br />
€’000 2010 2009<br />
Current accounts 1,463,536 1,279,777<br />
Cash advances 744,955 990,913<br />
Loans 7,415,477 6,368,067<br />
Debt instruments 20,223 26,009<br />
Other 36,244 31,372<br />
Total 9,680,435 8,696,138<br />
47
48<br />
Applying Basel II definitions, Loans and advances to customers broke down as follows:<br />
€’000 2010 2009<br />
Public sector exposures 568,539 417,956<br />
Retail exposures 1,526,227 1,402,151<br />
Corporate customers 7,585,669 6,876,031<br />
Total 9,680,435 8,696,138<br />
In 2010, the allocation of Loans and advances to customers was changed. Having previously been classified as<br />
corporates, professionals are now classified as retail customers.<br />
Loans and advances to customers broke down by region as follows:<br />
€’000 2010 2009<br />
Austria 8,262,032 7,485,218<br />
Abroad 1,418,403 1,210,920<br />
Total 9,680,435 8,696,138<br />
With the exception of loans and advances hedged against the exposure to interest rate risks in a fair value hedge,<br />
the loans and advances accounted for here were classified as Loans and receivables.<br />
(16) IMPAIRMENT ALLOWANCE BALANCE<br />
2010<br />
At<br />
At<br />
€’000<br />
1 January Added Reversed Used 31 December<br />
Item-by-item allowances for impairment 258,611 74,896 (42,233) (16,768) 274,506<br />
Loans and advances to other banks 15,245 3,052 (954) (5,203) 12,140<br />
Of which abroad 15,245 3,052 (954) (5,203) 12,140<br />
Loans and advances to customers 243,366 71,844 (41,279) (11,565) 262,366<br />
Of which in Austria 230,723 54,739 (33,924) (11,558) 239,980<br />
Of which abroad<br />
Collective assessment of impairments of<br />
12,643 17,105 (7,355) (7) 22,386<br />
portfolios 22,424 2,193 (1) 0 24,616<br />
Loans and advances to other banks 2,811 10 0 0 2,821<br />
Loans and advances to customers<br />
Impairment allowance balance (loans and<br />
19,613 2,183 (1) 0 21,795<br />
advances) 1 Risks arising from off-balance sheet<br />
281,035 77,089 (42,234) (16,768) 299,122<br />
liabilities2 18,443 8,018 (12,504) (80) 13,877<br />
Total 299,478 85,107 (54,738) (16,848) 312,999
2009<br />
At<br />
At<br />
€’000<br />
1 January Added Reversed Used 31 December<br />
Item-by-item allowances for impairment 236,606 83,612 (33,385) (28,223) 258,611<br />
Loans and advances to other banks 12,230 8,444 (1,390) (4,039) 15,245<br />
Of which abroad 12,230 8,444 (1,390) (4,039) 15,245<br />
Loans and advances to customers 224,376 75,168 (31,995) (24,184) 243,366<br />
Of which in Austria 216,326 63,269 (29,721) (19,152) 230,723<br />
Of which abroad 8,050 11,899 (2,274) (5,032) 12,643<br />
Collective assessment of impairments of<br />
portfolios 5,073 17,389 (38) 0 22,424<br />
Loans and advances to other banks 1,941 878 (8) 0 2,811<br />
Loans and advances to customers<br />
Impairment allowance balance (loans and<br />
3,132 16,511 (30) 0 19,613<br />
advances) 1 Risks arising from off-balance sheet<br />
241,679 101,001 (33,423) (28,223) 281,035<br />
liabilities2 19,529 12,140 (12,994) (232) 18,443<br />
Total 261,208 113,141 (46,417) (28,455) 299,478<br />
1 The balance of impairment charges on loans and advances is recorded on the Balance Sheet in the line item Impairment allowance balance.<br />
2 Risks arising from off-balance sheet liabilities are recorded on the Balance Sheet in the line item Provisions.<br />
(17) TRADING ASSETS<br />
Trading assets contains the following held-for-trading securities and derivative financial instruments:<br />
€’000 2010 2009<br />
Bonds and other fixed-interest securities 340,026 325,028<br />
Of which public-sector debt instruments eligible for rediscounting 22,454 16,166<br />
Of which bonds and similar debt securities issued by other issuers 317,572 308,862<br />
Shares and other variable-yield securities 4,500 3,078<br />
Of which shares 4,053 2,609<br />
Of which other variable-yield securities 447 469<br />
Positive fair values of derivative contracts 181,954 56,111<br />
Of which of interest rate derivatives 54,611 14,313<br />
Of which of currency derivatives 127,308 41,798<br />
Of which of equity and index derivatives 35 0<br />
Accruals arising from derivatives 61,868 12,368<br />
Of which from interest rate derivatives 61,868 12,368<br />
Total 588,348 396,585<br />
(18) OTHER CURRENT FINANCIAL ASSETS<br />
€’000 2010 2009<br />
Bonds and other fixed-interest securities 1,930,522 2,136,848<br />
Designated as at fair value through profit or loss 1,930,522 2,136,848<br />
Of which public-sector debt instruments eligible for rediscounting 53,589 31,069<br />
Of which other debt instruments issued by the public sector 62,073 138,894<br />
Of which bonds and similar debt securities issued by other issuers 1,814,860 1,966,885<br />
Shares and other variable-yield securities 390,023 367,442<br />
Designated as at fair value through profit or loss 390,023 367,442<br />
Of which shares 27,108 29,427<br />
Of which units in investment funds 335,710 314,880<br />
Of which other variable-yield securities 27,205 23,135<br />
Total 2,320,545 2,504,290<br />
49
50<br />
(19) FINANCIAL INVESTMENTS<br />
€’000 2010 2009<br />
Bonds and other fixed-interest securities 3,145,506 2,870,275<br />
Classified as held to maturity 1,529,477 2,051,081<br />
Of which public-sector debt instruments eligible for rediscounting 135,691 420,094<br />
Of which other debt instruments issued by the public sector 38,312 59,024<br />
Of which bonds and similar debt securities issued by other issuers 1,355,474 1,571,963<br />
Classified as available for sale and measured at fair value 1,616,029 819,194<br />
Of which public-sector debt instruments eligible for rediscounting 863,670 308,376<br />
Of which other debt instruments issued by the public sector 0 41,377<br />
Of which bonds and similar debt securities issued by other issuers 752,359 469,441<br />
Shares and other variable-yield securities 354,123 359,700<br />
Classified as available for sale and measured at fair value 325,423 331,000<br />
Of which units in investment funds 184 181<br />
Of which other variable-yield securities 325,239 330,819<br />
Classified as available for sale and measured at cost 28,700 28,700<br />
Of which other variable-yield securities 28,700 28,700<br />
Equity investments 49,094 48,711<br />
Classified as available for sale and measured at cost 49,094 48,711<br />
Of which equity investments in non-consolidated subsidiaries1 Of which equity investments in associates not accounted for using the equity<br />
11,032 11,261<br />
method 3,302 2,642<br />
Of which other equity investments 34,760 34,808<br />
Total 3,548,723 3,278,686<br />
1<br />
This total includes non-voting non-ownership capital (Partizipationskapital) of Raiffeisen-Holding NÖ-<strong>Wien</strong> in the amount of €277 thousand (yearend<br />
2009: €277 thousand).<br />
No sales of available-for-sale financial instruments measured at cost were planned. During the financial year, such<br />
financial instruments with a carrying amount of €336 thousand (2009: €480 thousand) were derecognized, generating<br />
a gain on disposal of €516 thousand (2009: €389 thousand).<br />
In the fourth quarter of 2008, bonds issued by Austrian and foreign banks with a nominal value of €157,740 thousand<br />
and a fair value of €156,727 thousand were reclassified from the trading portfolio to the held-to-maturity portfolio. At<br />
31 December 2010, these reclassified financial instruments had a carrying amount of €35,597 thousand (year-end<br />
2009: €84,695 thousand) and a fair value of €36,091 thousand (year-end 2009: €85,040 thousand).<br />
On the date of their reclassification, the estimated effective interest rates on the reclassified financial instruments lay<br />
between 3.0 and 5.9 per cent. The estimated future cash flows came to €172,944 thousand.<br />
Until the time of their reclassification, valuation gains on the reclassified financial instruments recognized in Net trading<br />
income came to €378 thousand in 2008 (2007: negative €213 thousand). Had the financial instruments not been<br />
reclassified as the result of a change in RLB NÖ-<strong>Wien</strong>’s intentions with regard to holding them, valuation<br />
gains/(losses) of €225 thousand would have been recognized in Net trading income in the 2010 financial year (2009:<br />
€2,392 thousand).<br />
After the time of their reclassification, we registered interest income in the amount of €1,116 thousand in the 2010<br />
financial year (2009: €2,389 thousand) and gains on disposal in the amount of €0 thousand (2009: €5 thousand). At<br />
31 December 2010, the reclassified securities were unimpaired (31 December 2009: unimpaired).
(20) INTANGIBLE ASSETS<br />
€’000 2010 2009<br />
Acquisition costs<br />
At 1 January 41,438 39,679<br />
Additions 1,339 1,759<br />
Disposals 1 (246) 0<br />
At 31 December 42,531 41,438<br />
Amortization<br />
At 1 January (35,165) (33,721)<br />
Disposals 234 0<br />
Amortization during the financial year (1,653) (1,444)<br />
At 31 December (36,584) (35,165)<br />
Carrying amounts<br />
At 1 January 6,273 5,958<br />
At 31 December 5,947 6,273<br />
1 This figure includes subsequent adjustments to acquisition and conversion costs.<br />
The elimination of intragroup investments and equity upon consolidation did not give rise to any goodwill.<br />
(21) PROPERTY AND EQUIPMENT<br />
Land and Buildings used by the<br />
€’000<br />
Acquisition costs<br />
Group for its Own Operations Other Property and Equipment<br />
At 1 January 2010 2,903 27,390<br />
Additions 0 1,915<br />
Disposals1 (261) (1,203)<br />
Reclassifications 0 0<br />
At 31 December 2010 2,642 28,102<br />
Depreciation<br />
At 1 January 2010 (1,855) (18,899)<br />
Additions 0 0<br />
Disposals 248 1,145<br />
Depreciation during the financial year (255) (2,248)<br />
Reclassifications 0 0<br />
At 31 December 2010 (1,862) (20,002)<br />
Carrying amounts<br />
At 1 January 2010 1,048 8,489<br />
At 31 December 2010 779 8,100<br />
1 This figure includes subsequent adjustments to acquisition and conversion costs.<br />
51
52<br />
€’000<br />
Acquisition costs<br />
Land and Buildings used by the<br />
Group for its Own Operations Other Property and Equipment<br />
At 1 January 2009 2,838 26,570<br />
Additions 65 1,862<br />
Disposals1 0 (1,042)<br />
At 31 December 2009 2,903 27,390<br />
Amortization<br />
At 1 January 2009 (1,587) (17,551)<br />
Additions 0 0<br />
Disposals 0 903<br />
Depreciation during the financial year (268) (2,252)<br />
At 31 December 2009 (1,855) (18,900)<br />
Carrying amounts<br />
At 1 January 2009 1,251 9,019<br />
At 31 December 2009 1,048 8,490<br />
1 This figure includes subsequent adjustments to acquisition and conversion costs.<br />
The land and buildings used by the Group for its own operations consisted exclusively of investments (structural<br />
adaptations) in such properties that did not belong to the Group itself.<br />
Liabilities arising from the use of property and equipment not recognized on the Balance Sheet in the ensuing financial<br />
year came to €15,974 thousand (2009: €16,572 thousand). Such liabilities in the ensuing five financial years<br />
totaled €79,064 thousand (2009: €81,837 thousand).
(22) OTHER ASSETS<br />
€’000 2010 2009<br />
Tax assets 20,708 20,258<br />
Of which current tax assets 602 3,567<br />
Of which deferred tax assets 20,106 16,691<br />
Positive fair values of derivative hedging instruments in fair value hedges 145,163 84,788<br />
Of which of interest rate derivatives 142,311 77,962<br />
Of which of currency derivatives 2,436 0<br />
Of which of equity and index derivatives 416 6,826<br />
Positive fair values of derivative hedging instruments in cash flow hedges 21,414 27,331<br />
Of which of interest rate derivatives 21,414 27,331<br />
Positive fair values of derivative financial instruments designated as at fair<br />
value through profit or loss 23,291 13,039<br />
Of which of interest rate derivatives 21,533 12,729<br />
Of which of currency derivatives 43 14<br />
Of which of equity and index derivatives 155 1<br />
Of which of credit derivatives 1,560 295<br />
Positive fair values of other derivative financial instruments 1,333,145 1,299,162<br />
Of which of interest rate derivatives 1,309,486 1,269,531<br />
Of which of currency derivatives 18,488 19,616<br />
Of which of equity and index derivatives 63 763<br />
Of which of credit derivatives 5,108 9,252<br />
Interest accruals arising from derivative financial instruments 511,523 595,043<br />
Of which from interest rate derivatives 505,559 583,688<br />
Of which from currency derivatives 3,739 9,297<br />
Of which from equity and index derivatives 2,081 1,824<br />
Of which from credit derivatives 144 234<br />
Other items 158,167 157,857<br />
Total 2,213,411 2,197,478<br />
Insofar as they met the requirements for hedge accounting for the purposes of IAS 39, derivative financial instruments<br />
were designated as hedges. The fair values of derivatives were measured without accrued interest (giving<br />
clean prices).<br />
In accordance with IAS 39, this line item also includes the positive fair values of derivative financial instruments that<br />
were neither held for trading nor hedging instruments in a fair value or cash flow hedge for the purposes of IAS 39.<br />
The derivative financial instruments designated as at fair value through profit or loss were those derivatives that were<br />
measured in the same way as securities classified as Other current financial assets or liabilities evidenced by paper<br />
or subordinated liabilities using the fair value option.<br />
53
54<br />
DEFERRED TAX ASSETS<br />
Tax was deferred as follows:<br />
€’000 2010 2009<br />
Deferred tax assets 20,106 16,691<br />
Provisions for deferred taxes 0 0<br />
Net deferred tax assets 20,106 16,691<br />
Net deferred tax assets resulted from the following items on the Balance Sheet:<br />
€’000 2010 2009<br />
Impairment allowance balance 6,154 5,606<br />
Intangible assets 253 758<br />
Deposits from other banks 10,089 4,281<br />
Deposits from customers 3,847 3,784<br />
Liabilities evidenced by paper 14,569 11,115<br />
Other liabilities 375,332 366,233<br />
Provisions 954 693<br />
Other balance sheet items 10,382 4,303<br />
Deferred tax assets 421,580 396,773<br />
Loans and advances to other banks 5,080 7,172<br />
Other current financial assets 5,576 7,704<br />
Financial investments 10,037 10,037<br />
Other assets 373,974 349,810<br />
Other balance sheet items 5,077 5,359<br />
Deferred tax liabilities 399,744 380,082<br />
Revaluation of deferred tax assets 1,730 0<br />
Deferred tax assets net of deferred tax liabilities 20,106 16,691<br />
Assets in the amount of €11,682 thousand (year-end 2009: €10,998 thousand) arising from as yet unused tax loss<br />
carryforwards and deductible temporary differences were not capitalized in the Consolidated Financial Statements because,<br />
as things stood at the time, it seemed unlikely that it would be possible to realize them within a reasonable period.<br />
(23) DEPOSITS FROM OTHER BANKS<br />
Deposits from other banks broke down as follows:<br />
€’000 2010 2009<br />
Demand deposits 4,870,185 3,848,062<br />
Time deposits 9,884,838 10,661,748<br />
Borrowed funds 1,144,291 1,373,522<br />
Total 15,899,314 15,883,332<br />
€’000 2010 2009<br />
Austria 13,600,766 13,520,759<br />
Abroad 2,298,548 2,362,573<br />
Total 15,899,314 15,883,332<br />
With the exception of deposits hedged against the exposure to interest rate risks in a fair value hedge, the deposits<br />
accounted for here were measured at amortized cost.
(24) DEPOSITS FROM CUSTOMERS<br />
Deposits from customers broke down into product groups as follows:<br />
€’000 2010 2009<br />
Sight deposits 3,835,424 3,348,920<br />
Time deposits 975,593 1,144,907<br />
Savings deposits 2,260,143 2,376,669<br />
Total 7,071,160 6,870,496<br />
Applying Basel II definitions, Deposits from customers broke down as follows:<br />
€’000 2010 2009<br />
Public sector exposures 697,037 614,774<br />
Retail exposures 3,971,109 4,025,299<br />
Corporate customers 2,174,401 1,904,591<br />
Other 228,613 325,832<br />
Total 7,071,160 6,870,496<br />
In 2010, the allocation of Deposits from customers changed. Having previously been classified as corporates, professionals<br />
are now classified as retail customers.<br />
Deposits from customers broke down by region as follows:<br />
€’000 2010 2009<br />
Austria 6,293,811 6,182,041<br />
Abroad 777,349 688,455<br />
Total 7,071,160 6,870,496<br />
With the exception of deposits hedged against the exposure to interest rate risks in a fair value hedge, the deposits<br />
accounted for here were measured at amortized cost.<br />
.<br />
(25) LIABILITIES EVIDENCED BY PAPER<br />
€’000 2010 2009<br />
Measured at amortized cost 2,961,884 2,782,448<br />
Issued bonds 2,605,802 2,388,384<br />
Other liabilities evidenced by paper 356,082 394,064<br />
Designated as at fair value through profit or loss 882,069 882,356<br />
Issued bonds 828,783 828,916<br />
Other liabilities evidenced by paper 53,286 53,440<br />
Total 3,843,953 3,664,804<br />
To avoid any accounting mismatch, the liabilities evidenced by paper that were designated as at fair value through<br />
profit or loss were measured in the same way as interest rate derivative financial instruments using the fair value<br />
option. Negative €562 thousand of the change in the fair values of these liabilities was attributable to changes in<br />
default risk (2009: €12,801 thousand). The carrying amount of these liabilities was €19,429 thousand higher than the<br />
contractually agreed repayment amount (2009: 19,716 thousand).<br />
With the exception of liabilities hedged against the exposure to interest rate risks in a fair value hedge, the liabilities<br />
accounted for here were measured at amortized cost. They also included securities listed on the Vienna stock exchange.<br />
55
56<br />
(26) TRADING LIABILITIES<br />
Trading liabilities contains the following derivative instruments held for trading:<br />
€’000 2010 2009<br />
Negative fair values of derivative contracts 178,620 52,704<br />
Of which of interest rate derivatives 69,040 16,667<br />
Of which of currency derivatives 109,542 36,037<br />
Of which equity and index derivatives 38 0<br />
Accruals arising from derivatives 63,763 12,335<br />
Of which from interest rate derivatives 63,763 12,335<br />
Total 242,383 65,039<br />
(27) OTHER LIABILITIES<br />
€’000 2010 2009<br />
Tax liabilities 8,703 16,777<br />
Of which current tax liabilities 8,703 16,777<br />
Negative fair values of derivative hedging instruments in fair value hedges 88,694 83,708<br />
Of which of interest rate derivatives 85,845 78,178<br />
Of which of equity and index derivatives 2,849 5,530<br />
Negative fair values of derivative hedging instruments in cash flow hedges 55,412 57,377<br />
Of which of interest rate derivatives 55,412 57,377<br />
Negative fair values of derivative financial instruments designated as at<br />
fair value through profit or loss 44,866 52,044<br />
Of which of interest rate derivatives 44,780 51,974<br />
Of which of equity and index derivatives 53 0<br />
Of which of credit derivatives 33 70<br />
Negative fair values of other derivative financial instruments 1,384,459 1,330,814<br />
Of which of interest rate derivatives 1,364,553 1,308,805<br />
Of which of currency derivatives 17,638 17,629<br />
Of which of equity and index derivatives 974 2,551<br />
Of which of credit derivatives 1,294 1,829<br />
Interest accruals arising from derivative financial instruments 466,451 579,125<br />
Of which from interest rate derivatives 463,702 574,556<br />
Of which from currency derivatives 2,541 4,359<br />
Of which from equity and index derivatives 178 182<br />
Of which from credit derivatives 30 28<br />
Contractual profit transfer 56,500 53,700<br />
Other items 323,042 223,230<br />
Total 2,428,127 2,396,775<br />
Insofar as they met the requirements for hedge accounting for the purposes of IAS 39, derivative financial instruments<br />
were designated as hedges. The fair values of these derivatives are stated here without accrued interest<br />
(giving clean prices).<br />
In accordance with IAS 39, this line item also includes the negative fair values of derivative financial instruments that<br />
were neither held for trading nor hedging instruments in a fair value or cash flow hedge for the purposes of IAS 39.<br />
The derivative financial instruments designated as at fair value through profit or loss were those derivatives that were<br />
measured in the same way as securities classified as Other current financial assets or liabilities evidenced by paper<br />
or subordinated liabilities using the fair value option.
(28) PROVISIONS<br />
€’000 2010 2009<br />
Termination benefits 20,580 19,196<br />
Post-employment benefits 18,442 18,395<br />
Jubilee benefits and part-time work by older staff 4,557 4,099<br />
Taxes 43 118<br />
Of which current 43 118<br />
Of which deferred 0 0<br />
Other 17,283 20,322<br />
Total 60,905 62,130<br />
PROVISIONS FOR STAFF BENEFITS<br />
An interest rate of 4.0 per cent per annum (2009: 4.75 per cent) was applied when calculating provisions for termination<br />
and post-employment benefits as of the reporting date. Plan assets were measured on the basis of an expected<br />
return on investment of 5.8 per cent per annum (2009: 5.8 per cent). We assumed future increases in salaries of 3.0<br />
per cent per annum in the case of employees compensated outside the scope of collective agreements (2009: 3.0<br />
per cent), of 4.0 per cent per annum in the case of employees compensated under collective agreements (2009: 4.0<br />
per cent), and of 4.5 per cent per annum in the case of employees compensated under the transitional collective<br />
agreement (Überleitungskollektivvertrag) (2009: 4.5 per cent). We assumed an increase in pensioners’ postemployment<br />
benefits of 2.5 per cent per annum (2009: 2.5 per cent). Increases in the salaries of members of the<br />
Managing Board were calculated individually. The biometrical basis for the computation of all provisions for ‘social<br />
capital’ was provided by AVÖ 2008-P-Rechnungsgrundlagen für die Pensionsversicherung (computational framework<br />
for post-employment benefit insurance) – Pagler & Pagler using the variant for salaried employees. Calculations took<br />
place on the basis of the earliest possible retirement ages of men and women. Individual retirement ages were only<br />
taken into account when calculating the provision for part-time work by older staff.<br />
Termination benefit obligations changed as follows:<br />
€’000 2010 2009<br />
Present value of defined benefit obligations at 1 January 20,423 18,669<br />
Service cost 1,160 1,050<br />
Interest cost 946 1,050<br />
Termination benefit payments (653) (1,228)<br />
Actuarial (gain)/loss for the financial year 2,388 882<br />
Present value of defined benefit obligations at 31 December 24,264 20,423<br />
Accumulated unrecognized actuarial gains/(losses) (3,684) (1,296)<br />
Added for other termination benefit obligations 0 69<br />
Provision balance at 31 December 20,580 19,196<br />
Post-employment benefit obligations changed as follows:<br />
€’000 2010 2009<br />
Present value of defined benefit obligations at 1 January 63,303 58,981<br />
Service cost 1,537 1,425<br />
Interest cost 2,932 3,239<br />
Settlement payments and transfers 0 (727)<br />
Transferred to defined contribution plan (440) (883)<br />
Payments to beneficiaries (3,015) (2,944)<br />
Actuarial/(gain) loss for the financial year 7,051 4,212<br />
Present value of defined benefit obligations at 31 December 71,368 63,303<br />
57
58<br />
Plan assets changed as follows:<br />
€’000 2010 2009<br />
Fair value of plan assets at 1 January 35,523 33,112<br />
Expected return on the plan assets 2,035 1,907<br />
Transferred to defined contribution plan (412) (967)<br />
Contributions to plan assets 746 907<br />
Retirement benefits paid from plan assets (1,167) (1,116)<br />
Actuarial gain/(loss) for the financial year (2,245) 1,680<br />
Fair value of plan assets at 31 December 34,480 35,523<br />
Reconciliation of the present value of the post-employment benefit obligations and the fair value of the plan assets to<br />
recognized provisions:<br />
€’000 2010 2009<br />
Present value of defined benefit obligations at 31 December 71,368 63,303<br />
Fair value of plan assets at 31 December 34,480 35,523<br />
Net obligations 36,888 27,780<br />
Accumulated unrecognized actuarial gains/(losses) (18,446) (9,385)<br />
Provision balance at 31 December 18,442 18,395<br />
Breakdown of post-employment benefit obligations by source of financing:<br />
€’000 2010 2009<br />
Present value of the defined post-employment benefit obligations at<br />
31 December 71,368 63,303<br />
Of which directly financed obligations 57,135 48,664<br />
Of which financial obligations financed via pension funds and/or insurers 14,233 14,639<br />
The plan assets were structured as follows:<br />
Per cent 2010 2009<br />
Bonds and other fixed-interest securities 50.23 57.62<br />
Shares and other variable-yield securities 36.97 16.74<br />
Property 1.56 0.99<br />
Other 11.24 24.65<br />
Total 100.00 100.00<br />
The plan assets did not include any financial instruments issued by the RLB NÖ-<strong>Wien</strong> Group or other assets that<br />
were being utilized by the RLB NÖ-<strong>Wien</strong> Group.<br />
Return on the plan assets:<br />
€’000 2010* 2009<br />
Actual return on plan assets (210) 3,587<br />
* The final allocation of the income from the plan assets attributable to the RLB NÖ-<strong>Wien</strong> Group will not be known until the annual financial statements<br />
of Valida Pension AG have been prepared. Consequently, the figure presented here is provisional.
Provisions for jubilee benefits and part-time work by older staff changed as follows:<br />
€’000 2010 2009<br />
Present value of defined benefit obligations at 1 January 4,099 3,773<br />
Service cost 264 220<br />
Interest cost 188 208<br />
Payments (302) (359)<br />
Actuarial/(gain) loss for the financial year 308 257<br />
Present value of defined benefit obligations at 31 December 4,557 4,099<br />
Present values of the defined benefit obligations, fair values of the plan assets and experience adjustments:<br />
€’000 2010 2009 2008 2007 2006<br />
Termination benefits<br />
Obligations 24,264 20,423 18,669 19,311 17,548<br />
Experience adjustments on obligations (220) 978 508 (216) (812)<br />
Post-employment benefits<br />
Obligations 71,368 63,303 58,981 61,738 59,505<br />
Plan assets 34,480 35,523 33,112 32,412 36,956<br />
Net obligations 36,888 27,780 25,869 29,326 22,549<br />
Experience adjustments on obligations 728 1,844 1,638 (407) (425)<br />
Experience adjustments on plan assets 2,245 (1,680) 1,439 5,531 1,087<br />
Jubilees benefits and part-time work by older staff<br />
Obligations 4,557 4,099 3,773 4,267 4,330<br />
Experience adjustments on obligations 78 (5) 84 44 (881)<br />
Estimate of amounts that will be paid into the plan in the ensuing year:<br />
€’000 2011<br />
Post-employment benefits (423)<br />
Breakdown of expenditure on defined contribution plans:<br />
€’000 2010 2009<br />
Expenditure on defined contribution plans 1,317 1,170<br />
Of which on defined contribution plans (pension fund) 828 750<br />
Of which on the staff benefit fund (Mitarbeitervorsorgekasse) 489 420<br />
59
60<br />
OTHER PROVISIONS<br />
The other provisions changed as follows:<br />
€’000 2010 2009<br />
At 1 January 20,322 21,140<br />
Added 9,808 12,735<br />
Released (12,598) (7,163)<br />
Used (249) (6,390)<br />
At 31 December 17,283 20,322<br />
Other provisions includes provisions for guarantees in the amount of €12,712 thousand (year-end 2009: €9,483 thousand)<br />
and provisions for customer risks in the Ukraine in the amount of €0 thousand (year-end 2009: €8,000 thousand).<br />
(29) SUBORDINATED DEBT CAPITAL<br />
€’000 2010 2009<br />
Measured at amortized cost 666,384 638,030<br />
Subordinated debt 359,513 311,206<br />
Supplementary capital 306,871 326,824<br />
Designated as at fair value through profit or loss 87,355 77,860<br />
Subordinated debt 87,355 77,860<br />
Total 753,739 715,890<br />
Subordinated liabilities were designated as at fair value through profit or loss if such a designation eliminated or<br />
substantially reduced mismatches in measurement or approach (accounting mismatches).<br />
This applied to subordinated liabilities measured in the same way as interest rate derivative financial instruments<br />
using the fair value option. €554 thousand of the change in the fair values of these liabilities was attributable to<br />
changes in default risk (2009: €783 thousand). The carrying amount of these liabilities was €2,760 thousand higher<br />
than the contractually agreed repayment amount (2009: €757 thousand).<br />
Furthermore, profit-share certificates (Genussrecht) furnished for an indefinite term but with the possibility of termination<br />
were included in this line item as subordinated debt designated as at fair value through profit or loss. These<br />
profit-share certificates evidence a contractual right to a portion of the assets in a specially created portfolio that is<br />
likewise designated as at fair value through profit or loss and recognized in the line item Other current financial assets.<br />
In the event of termination, the repayment amount will be the fair value and, therefore, the carrying amount<br />
reported here. Changes in the fair value thereof are attributable in their entirety to changes in the fair value of the<br />
assets in the portfolio.<br />
With the exception of liabilities hedged against the exposure to interest rate risks in a fair value hedge, the other<br />
liabilities accounted for here were measured at amortized cost.
(30) EQUITY<br />
€’000 2010 2009<br />
Attributable to equity holders of the parent 2,383,165 2,040,043<br />
Subscribed capital 214,520 214,520<br />
Non-voting non-ownership capital (Partizipationskapital) 76,500 76,500<br />
Capital reserves 432,688 432,688<br />
Retained earnings 1,659,457 1,316,335<br />
Minorities 99 93<br />
Total 2,383,264 2,040,136<br />
In accordance with a decision made by the <strong>Annual</strong><br />
General Meeting held on 30 April 2008, the Managing<br />
Board was authorized, subject to the Supervisory<br />
Board’s approval, to raise the share capital of RLB NÖ-<br />
<strong>Wien</strong> AG in the period up to and including 30 April 2013<br />
by up to €25,000 thousand through the issuance of up<br />
to 250,000 new, registered no-par shares. By virtue of<br />
this authority, the Managing Board decided, in a decision<br />
dated 17 November 2008, to raise the share capital<br />
of RLB NÖ-<strong>Wien</strong> AG by €15,323 thousand through the<br />
issuance of 153,228 new, registered voting no-par<br />
shares (ordinary shares) with a nominal value of €100.00<br />
at an issue price of €1,738.00 per share. Under this<br />
authority, another 96,772 new registered no-par shares<br />
could be issued.<br />
In 2008, RLB NÖ-<strong>Wien</strong> AG issued 765,000 registered<br />
non-voting non-ownership ‘participation’ certificates<br />
(Partizipationsschein) within the meaning of § 23 Abs. 3<br />
Z. 8. in conjunction with Abs. 4 und Abs. 5 BWG. One<br />
such certificate has a nominal value of €100.00. The<br />
non-voting non-ownership capital has been furnished for<br />
the duration of the enterprise and rights of ordinary and<br />
extraordinary termination have been waived. This capital<br />
can only be reduced by virtue of the provisions of Austrian<br />
stock corporation law, applied mutatis mutandis, or<br />
in accordance with the provisions of § 102 BWG. Returns<br />
on the non-voting non-ownership capital will depend<br />
on profits. The distribution on the non-voting nonownership<br />
capital in respect of the year 2010 was<br />
€3,825 thousand.<br />
Because of the profit-transfer agreement in place with<br />
Raiffeisen-Holding NÖ-<strong>Wien</strong>, the principal equity holder<br />
of RLB NÖ-<strong>Wien</strong>, profit within the meaning of UGB/BWG<br />
(Austrian enterprises code and Austrian banking act)<br />
remaining after transfers to the contractually provided<br />
reserves and after making the fixed payment for the nonvoting<br />
non-ownership capital is transferred to Raiffeisen-<br />
Holding NÖ-<strong>Wien</strong>. The transferable amount is booked<br />
as a liability. At the moment, the minority shareholders<br />
of RLB NÖ-<strong>Wien</strong> receive a guaranteed minimum dividend<br />
from Raiffeisen-Holding NÖ-<strong>Wien</strong> as recompense.<br />
Equity management is an important component of the<br />
RLB NÖ-<strong>Wien</strong> Group’s medium-term planning. This<br />
process is regularly reviewed and updated. The goal of<br />
equity management is to ensure a sustained supply of<br />
own funds so as to give timely support to the RLB NÖ-<br />
<strong>Wien</strong> Group’s growth. The definition of equity is based<br />
on regulatory own funds requirements (see Note (50)<br />
Regulatory own funds). Pursuant to § 39a BWG, it is<br />
moreover still one of the legal duties of care imposed on<br />
banks to ensure that they have sufficient equity to protect<br />
themselves against all material banking and operational<br />
risks (see our remarks on Central risk management<br />
and risk-bearing capacity in Note (31) Risks arising<br />
from financial instruments [Risk <strong>Report</strong>]). There were no<br />
material changes in the equity management process<br />
during the financial year under review compared with the<br />
previous year. The legislative minimum own funds requirements<br />
as set out in BWG were adhered to throughout<br />
the financial year at both bank and Group level at<br />
Raiffeisen-Holding NÖ-<strong>Wien</strong>.<br />
61
62<br />
NOTES ON FINANCIAL<br />
INSTRUMENTS<br />
(31) RISKS ARISING FROM FINANCIAL<br />
INSTRUMENTS (RISK REPORT)<br />
The following notes on financial instruments contain<br />
disclosures of the nature and extent of risks arising from<br />
financial instruments in accordance with IFRS 7.B6.<br />
RISK POLICY AND RISK MANAGEMENT<br />
The integrated risk management process at RLB NÖ-<br />
<strong>Wien</strong> is based on the risk policy laid down by the Managing<br />
Board together with the accompanying strategies.<br />
Risk policy also includes the definition of risk management<br />
principles, the setting of limits for every material<br />
risk and risk monitoring procedures.<br />
The professional management of the risks arising from<br />
financial instruments is a core task and, therefore, a<br />
decisive competitive factor for every bank. The ability of<br />
a financial institution to capture and measure all material<br />
risks and to monitor and manage them close to real time<br />
is paramount. RLB NÖ-<strong>Wien</strong> therefore sees risk management<br />
as a proactive corporate function. The primary<br />
focus is on optimizing risk and returns; in other words,<br />
on managing opportunities and risks and not just on<br />
managing risks. Subject to the needs of customerorientated<br />
banking operations within the framework of<br />
RLB NÖ-<strong>Wien</strong>’s ‘advisor bank’ concept and subject to<br />
the requirements of the legislative environment, RLB NÖ-<br />
<strong>Wien</strong>’s risk policy and risk strategy mirror its conservative<br />
handling of banking risks and operational banking<br />
risks.<br />
RISK MANAGEMENT AND RISK CONTROLLING<br />
RLB NÖ-<strong>Wien</strong> employs well-established methods of risk<br />
management and risk controlling to ensure the bank’s<br />
profitability and security in the interests of its customers<br />
and its equity holders.<br />
RLB NÖ-<strong>Wien</strong>’s risk management activities are based on<br />
clear responsibilities. Risk policy is an integral part of<br />
the bank’s central management procedures, so earnings<br />
and risk management in all business divisions are<br />
systematically interlinked. All material risks in the Bank<br />
are captured and subjected to an optimized strategic<br />
management process taking account of the Bank’s own<br />
funds position (covering assets).<br />
Risk controlling and risk management units and special<br />
committees that act independently from front-office units<br />
support the Managing Board in the performance of its<br />
risk-related tasks. The Central Risk Committee<br />
(Gesamtbankrisikorunde) is the working committee that<br />
analyzes the Bank’s risk position and makes strategic<br />
risk decisions. The Bank’s overall risk position is evaluated<br />
on the basis of analysis of its risk-bearing capacity<br />
and detailed reports on individual categories of risk. The<br />
strategic risk decisions involve laying down the limit<br />
systems for the bank as a whole and for individual business<br />
divisions. The Central Risk Committee consists of<br />
the Managing Board member responsible for the Risk<br />
Management and Organization Division, the Head of<br />
Credit Risk Management, the Head of the Special Accounts<br />
Management Unit (SOG: Sondergestion), who<br />
reports directly to the Managing Board, the Head of<br />
Treasury Mid-office, the heads of the Head Office departments<br />
that take risks, the Head of Accounts and<br />
Controlling, the Head of Internal Audit, the Head of<br />
Country and Bank Analysis (to help obtain risk information<br />
relating to sovereign and bank exposures) and a<br />
representative of Raiffeisen-Holding NÖ-<strong>Wien</strong>. It works<br />
under the leadership of the Head of the Central Risk<br />
Department, who reports directly to the Managing<br />
Board. This committee meets quarterly. Final decisions<br />
are made during meetings of the Managing Board and<br />
presented to the Supervisory Board on a quarterly basis<br />
by the Managing Board member responsible for risk.<br />
The Central Risk Department (GBR: Gesamtbankrisiko)<br />
is part of the Risk Management and Organization Division.<br />
It reports directly to the responsible member of the<br />
Managing Board. This ensures that the Central Risk<br />
Department acts independently from front-office divisions.<br />
It is where all the pertinent risk analysis activities<br />
such as credit, market, liquidity, equity investment and<br />
operational risk analysis converge. Within the framework<br />
of the risk controlling process, the Treasury Mid-<br />
Office Department (TMO)—a Head Office department<br />
that is also a part of the Risk Management and Organization<br />
Division and, therefore, independent from the<br />
Treasury Department—carries out evaluations, monitors<br />
adherence to limits and analyzes and reports on trading<br />
books on a daily basis, passing the results on to the<br />
Managing Board. Adherence to market risk limits for the<br />
banking book is likewise monitored and analyzed on a<br />
daily basis. The continuous monitoring of risks is one of<br />
the core tasks of the Central Risk Department. Based<br />
on its monitoring activities, the different risks (including,<br />
in particular, credit, equity investment, market, liquidity<br />
and operational risks) are presented in an overall, aggregated<br />
view of the risk-bearing capacity analysis<br />
process.<br />
All the tasks, bodies, reports, procedures and organizational<br />
units involved in the risk management process are<br />
defined and described in detail in the Raiffeisen Holding<br />
Group’s Risk Management Manual (Handbuch Risikomanagement).<br />
It is updated annually by the Central Risk<br />
Department in collaboration with Credit Risk Management,<br />
the Treasury Mid-office Department, Country and<br />
Bank Analysis and the Group Controlling and Risk Management<br />
Department at Raiffeisen-Holding NÖ-<strong>Wien</strong><br />
and adopted by the Managing Board of RLB NÖ-<strong>Wien</strong><br />
and the management of Raiffeisen-Holding NÖ-<strong>Wien</strong>.
This ensures that a coordinated process is in place<br />
within the Bank to capture, limit, measure, report and<br />
document risks.<br />
As an integral part of the risk controlling and risk management<br />
system, the Internal Audit Department at RLB<br />
NÖ-<strong>Wien</strong> audits the effectiveness of RLB NÖ-<strong>Wien</strong>’s<br />
internal control system. The Internal Audit Department’s<br />
principal task is to audit and assess the effectiveness of<br />
workflows, processes and internal controls. The Internal<br />
Audit Department works without specific instructions,<br />
acting by order of RLB NÖ-<strong>Wien</strong>’s Managing Board.<br />
This means that this department’s audit procedures are<br />
performed by staff members who are not involved in<br />
operational workflows and, therefore, are not responsible<br />
for the results of the processes being monitored.<br />
This ensures that its evaluations and recommendations<br />
are objective.<br />
CENTRAL RISK MANAGEMENT AND RISK-BEARING<br />
CAPACITY<br />
During RLB NÖ-<strong>Wien</strong>’s central risk management procedures,<br />
the bank’s existing risk covering potential (profit,<br />
equity and hidden reserves) is compared with all its<br />
material risks (including, in particular, credit, market,<br />
liquidity, equity investment and operational risks). This<br />
comparison is carried out using well-established methods<br />
and employing appropriate systems. The Bank’s<br />
risks are subdivided into three scenarios (normal case,<br />
problem case and extreme case). Covering assets are<br />
divided into four pools, with covering assets in pools<br />
one to three earmarked to cover the risks assumed<br />
within the scope of the three risk scenarios. The ringfenced<br />
cover pool No. 4 is set aside to ensure RLB NÖ-<br />
<strong>Wien</strong>’s continued existence as a going concern in an<br />
extreme, crisis situation. The intention is to ensure that,<br />
given the assumptions that have been made, sufficient<br />
covering assets will be available even in an unlikely<br />
extreme situation. The Bank’s risk-bearing capacity sets<br />
a limit on its aggregated overall bank risk, and detailed<br />
risk limits are also laid down for individual risk categories<br />
and business segments. As is consistent with the main<br />
focuses of RLB NÖ-<strong>Wien</strong>’s business activities, credit<br />
risk, market risk and liquidity risk are at the forefront of<br />
the risk management process. Because of their materiality,<br />
due attention is also given to the equity investment<br />
risks associated with RLB NÖ-<strong>Wien</strong>’s equity investments<br />
in banking-related fields.<br />
Market risk in the trading and banking books is measured<br />
on the basis of value at risk (VaR: the potential loss<br />
with a given probability over a specified holding period).<br />
Unexpected credit risk losses are assessed and analyzed<br />
both on a value at risk basis (for problem cases)<br />
and using scenario analysis techniques (for extreme<br />
cases). Appropriate attention is also paid to settlement<br />
risk within the scope of credit risk by way of a suitable<br />
limits system, numerous netting agreements and the<br />
settlement of transactions using settlement platforms.<br />
Equity investment risks are measured on the basis of<br />
expert assessments that cover both problem cases and<br />
extreme cases.<br />
The central risk management process also captures<br />
liquidity and operational risks.<br />
As we have said, the central instrument that brings together<br />
and captures all risk-related information is the<br />
quarterly analysis of the Bank’s risk-bearing capacity.<br />
This analysis is the starting point for our risk policy,<br />
which limits risky activities to a level that is appropriate<br />
to the Bank.<br />
In the light of expectations regarding the future development<br />
of the markets, Risk Management again performed<br />
additional analyses during 2010. RLB NÖ-<strong>Wien</strong><br />
prepared a Contingency Plan within the scope of which<br />
simulation analyses were carried out taking a number of<br />
scenarios into consideration and developing concrete<br />
measures to reduce or limit risks.<br />
In addition, in conformity with ICAAP, we prepared a<br />
comprehensive risk profile of RLB NÖ-<strong>Wien</strong> that took<br />
into account every category of risk defined in the risk<br />
map.<br />
CREDIT RISK<br />
RLB NÖ-<strong>Wien</strong> defines credit risk as the risk that it might<br />
suffer a loss if a customer or counterparty fails to discharge<br />
a contractual obligation. On the one hand, credit<br />
risk results from traditional lending operations (loan<br />
losses with the consequent management of the loan<br />
exposure in response to any decline in creditworthiness).<br />
On the other, it results from trading in and acquiring<br />
market risk instruments (counterparty default risk in<br />
the case of derivatives).<br />
Country risk is also a part of credit risk. Country risk and<br />
transfer risk involve a debtor failing to discharge a contractual<br />
obligation as a result of sovereign action by a<br />
state. Transfer risk also includes the risk that debts of a<br />
country in financial difficulties could be rescheduled (i.e.<br />
deferred for several years) under an international<br />
agreement. This risk is limited separately. The counterparty<br />
default risk associated with derivatives operations<br />
is also included in this risk category. Counterparty risk is<br />
minimized by netting (offsetting receivables and payables).<br />
RLB NÖ-<strong>Wien</strong> sees itself as a financier operating in the<br />
Centrope region, which is also one focus of its business<br />
activities. RLB NÖ-<strong>Wien</strong> offers its customers all the<br />
usual credit products. As part of the strategic credit<br />
management process, the Managing Board formulates<br />
and implements all of the Bank’s strategic goals and<br />
actions according to the risks concerned within the<br />
scope of a credit risk strategy. This is an integral part of<br />
the Bank’s corporate and segmental strategies and<br />
63
64<br />
interacts with all other (sub-)strategies. Stipulation of the<br />
segments within the Bank where loans can be granted<br />
and specification of which products can be used to this<br />
end also take place here.<br />
Credit risk is a major component of risk at RLB NÖ-<br />
<strong>Wien</strong>. Consequently, sales units are assisted by Credit<br />
Risk Management (KRM), which is a Head Office department.<br />
Its tasks are to provide support and perform a<br />
controlling role during the measurement and management<br />
of credit risk and to take on the management and<br />
realization of problem loan assets. The Special Accounts<br />
Management Unit, which reports directly to the<br />
Managing Board and answers directly to the Managing<br />
Board member responsible for the Risk Management<br />
and Organization Division, supports the risk management<br />
process by resolving problem loans.<br />
Credit risk is handled by Credit Risk Management, which<br />
is a Head Office department. The activities this involves<br />
range from checking exposures before an application is<br />
made to minimizing damage in the event of an insolvency.<br />
If risky exposures need resolving, the job of<br />
processing them is transferred to the Special Accounts<br />
Management Unit, which reports directly to the Managing<br />
Board. Developing credit risk measurement systems<br />
(rating, scoring) is also the responsibility of Credit Risk<br />
Management.<br />
Credit risks at RLB NÖ-<strong>Wien</strong> are monitored and analyzed<br />
both loan-by-loan for each customer and on a<br />
portfolio basis. Credit risk management processes and<br />
credit decisions are based on the risk policy approved<br />
by the Managing Board of RLB NÖ-<strong>Wien</strong>. Lending<br />
principles are laid down in writing in our Risk Manual (in<br />
the sections on risk policy and in the Risk Management<br />
Manual) which, in particular, contains business policy<br />
statements regarding credit scoring, collateral and return<br />
and risk requirements.<br />
To safeguard its sustained market presence, RLB NÖ-<br />
<strong>Wien</strong> has an extensive credit limits system in place at<br />
the level of the Bank as a whole as well as spanning<br />
banks, countries and corporate customers. When looking<br />
at individual exposures, care is taken to ensure that<br />
the Bank’s approval ceilings are kept below regulatory<br />
limits.<br />
This means that an exposure greater than or equal to 7.5<br />
per cent of RLB NÖ-<strong>Wien</strong>’s own funds will already be<br />
submitted to the Supervisory Board for approval even if<br />
this is not a legislative requirement.<br />
The risk content of an exposure is captured using an<br />
extensive rating system. Various model variants are<br />
employed, depending on what is required in the customer<br />
segments in question. When assessing creditworthiness,<br />
RLB NÖ-<strong>Wien</strong> employs the nationally developed<br />
Raiffeisen rating system as well as an additional<br />
retail customer scoring model that classifies risks and<br />
gauges default risk. The rating models use ten credit<br />
quality classes and ten collateral classes, satisfying the<br />
requirements of Basel II.<br />
The credit process and the involvement of experts from<br />
Credit Risk Management and Credit Back Office, both of<br />
which are Head Office departments, encompass every<br />
necessary kind of monitoring measure. Monitoring<br />
measures are built directly or indirectly into the workflows<br />
being monitored. Before a loan involving a risky<br />
exposure is approved, the Material Credit Control Department<br />
and the Balance Sheet and Corporate Analysis<br />
Department will be involved in the exposure assessment<br />
procedure as part of the credit risk management process;<br />
and before a loan to a bank or a loan involving<br />
country risk is approved, Country and Bank Analysis, an<br />
organizational unit, will also be involved in the exposure<br />
assessment procedure.<br />
Alongside the determination of internal ratings within the<br />
framework of the loan approval process, collateral values<br />
are also checked based on a predetermined collateral<br />
assessment catalogue that lays down predefined<br />
risk charges. This catalogue is regularly reviewed and<br />
revised. Collateral is captured within the scope of a<br />
separate collateral management system and continuously<br />
reassessed. RLB NÖ-<strong>Wien</strong>’s derivatives operations<br />
are integrated into the existing limits system. The<br />
Financial Services Department (FIS) performs collateral<br />
management for these operations on a daily basis. In<br />
risk areas, assessments are subjected to institutionalized<br />
plausibility checks in the course of the loan application<br />
process. The updating of internal ratings and the<br />
examination and analysis of risk positions both take<br />
place at regular intervals.<br />
The periodic updating of ratings also includes regularly<br />
assessing the need to recognize impairment losses.<br />
Direct loan receivables that are highly unlikely to be<br />
recoverable require revaluation, taking assigned collateral<br />
into account, and provisions must be created for<br />
claims under guarantee credits. RLB NÖ-<strong>Wien</strong> has a<br />
default database that allows it to evaluate and analyze<br />
key risk parameters even more effectively.<br />
Where an impairment exists, RLB NÖ-<strong>Wien</strong> statistically<br />
captures credit exposures within the scope of a restructuring<br />
process and the associated redefinition of terms<br />
and conditions.<br />
Besides portfolio data, the Credit Risk <strong>Report</strong>s prepared<br />
by Credit Risk Management, a Head Office department,<br />
also show movements within the portfolio. Together with<br />
the results of risk-bearing capacity analysis, they provide<br />
the basis for appropriate steering and other measures.<br />
The expected loss and the available collateral are reflected<br />
by the Bank’s standard risk costs. Together with<br />
liquidity, own funds and unit costs, these are key variables<br />
in RLB NÖ-<strong>Wien</strong>’s management performance<br />
calculations, which are prepared employing the market<br />
interest rate method. Taking these factors into account
places the necessary emphasis on the relationship<br />
between risk and return. Various analyses of the Bank’s<br />
current risk profile are fixed components of its reporting<br />
activities.<br />
Against the backdrop of the financial markets crisis and<br />
its effects, RLB NÖ-<strong>Wien</strong> has set up a special Problem<br />
Exposures Task Force. This group operates under the<br />
Head of Credit Risk Management, which is a Head<br />
Office department. It is made up of members of both<br />
front-office and banking and back-office units. Its role is<br />
to ensure that crisis events are observed, managed and<br />
overcome and that debts are collected. The task force<br />
meets as required.<br />
Aggregated credit risk at the overall portfolio level is<br />
measured and managed on the basis of credit value at<br />
risk using a portfolio model. RLB NÖ-<strong>Wien</strong>’s credit value<br />
at risk is calculated using Monte Carlo simulations. The<br />
credit value at risk is brought into the Bank’s problem<br />
case risk-bearing capacity analysis process. When<br />
calculating credit value at risk within the scope of riskbearing<br />
capacity analysis, RLB NÖ-<strong>Wien</strong> bases its calculations<br />
on a risk horizon of one year and a problem<br />
case confidence interval of 95 per cent. In extreme<br />
cases, expert valuations are obtained<br />
The table below provides a breakdown of loans (credit exposures inclusive of guarantees and the positive fair values<br />
of derivatives) applying RLB NÖ-<strong>Wien</strong>’s internal ratings (in thousands of euros):<br />
Impairment<br />
Internal rating 2010 Per Cent<br />
Basis 2009 Per Cent Impairment<br />
0.5 Minimal risk 2,038,108 6.5 0 1,888,235 6.2 0<br />
1 Excellent credit standing 3,077,142 9.8 0 4,274,145 14.0 0<br />
1.5 Very good credit standing 17,012,351 54.1 67 15,458,688 50.7 4,085<br />
2 Good credit standing 2,618,587 8.3 252 2,353,589 7.7 412<br />
2.5 Average credit standing 2,083,162 6.6 158 1,859,881 6.1 239<br />
3 Mediocre credit standing 1,981,361 6.3 2,398 2,212,250 7.3 2,207<br />
3.5 Weak credit standing 1,003,965 3.2 9,478 1,081,631 3.6 14,515<br />
4 Very weak credit standing 903,977 2.9 49,903 623,675 2.0 39,116<br />
4.5 Doubtful/high default risk 264,651 0.9 78,515 235,136 0.8 80,371<br />
5 Default 197,536 0.6 132,932 177,200 0.6 117,066<br />
Unrated 251,466 0.8 803 315,685 1.0 600<br />
Total 31,432,306 100.0 274,506 30,480,115 100.0 258,611<br />
Charge<br />
Recognized on<br />
Item-by-item<br />
Item-by-item<br />
Allowances for<br />
The charge for impairment of the portfolio came to €24,616 thousand in 2010, compared with €22,424 thousand in<br />
2009.<br />
The following table presents RLB NÖ-<strong>Wien</strong>’s loan exposure net of impaired and past due accounts (in thousands of<br />
euros):<br />
Internal rating 2010 Per Cent 2009 Per Cent<br />
0.5 Minimal risk 2,038,108 6.6 1,888,235 6.3<br />
1 Excellent credit standing 3,077,132 9.9 4,267,524 14.3<br />
1.5 Very good credit standing 17,010,619 55.0 15,424,116 51.5<br />
2 Good credit standing 2,616,260 8.5 2,346,215 7.8<br />
2.5 Average credit standing 2,081,025 6.7 1,850,992 6.2<br />
3 Mediocre credit standing 1,966,980 6.4 2,181,546 7.3<br />
3.5 Weak credit standing 980,079 3.2 1,038,964 3.5<br />
4 Very weak credit standing 779,225 2.5 545,025 1.8<br />
4.5 Doubtful/high default risk 105,798 0.3 69,114 0.2<br />
5 Default 24,226 0.1 25,727 0.1<br />
Unrated 246,835 0.8 310,764 1<br />
Total 30,926,287 100.0 29,948,222 100.0<br />
65
66<br />
The following table presents total loans and advances and financial investments that entailed credit risk:<br />
Loans and Advances<br />
Loans and Advances<br />
€’000<br />
to Customers<br />
to Other Banks Financial Investments<br />
2010 2009 2010 2009 2010 2009<br />
Loan exposure 9,680,435 8,696,138 12,188,513 12,758,222 3,499,629 3,229,975<br />
Appropriate impairment losses were also recognized on problem exposures (non-performing loans 2 ). 2 )By region,<br />
customer exposures thus broke down as follows:<br />
Austria CENTROPE Region Rest of EU Other<br />
€’000 2010 2009 2010 2009 2010 2009 2010 2009<br />
Financial Institutions 10,194,655 10,292,773 161,174 167,675 1,113,206 1,250,882 305,340 247,593<br />
Non-performing<br />
Impairment charge on<br />
0 0 0 0 630 1,019 11,115 18,162<br />
loans and advances 0 0 0 0 630 745 11,115 14,500<br />
Corporate Customers 6,137,158 5,635,578 532,793 409,992 620,030 511,319 229,782 254,648<br />
Non-performing<br />
Impairment charge on<br />
311,260 346487 170 262 38,129 6,880 7,889 13,457<br />
loans and advances 151,811 144,974 35 0 17,634 2,900 3,320 7,594<br />
Retail Customers 1,439,163 1,319,442 2,826 2,821 14,997 13,533 16,001 14,872<br />
Non-performing<br />
Impairment charge on<br />
138,166 141,398 10 19 583 1,827 1,425 1,076<br />
loans and advances 88,169 85,749 5 5 377 1,306 1,015 839<br />
Sovereigns 1,016,763 1,232,110 0 0 0 0 165 184<br />
Non-performing<br />
Impairment charge on<br />
0 4,992 0 0 0 0 0 0<br />
loans and advances 0 0 0 0 0 0 0 0<br />
Other 82,957 100,094 0 1 1,010 24 928 33<br />
Non-performing<br />
Impairment charge on<br />
1 1 0 0 0 0 0 0<br />
loans and advances 0 0 0 0 0 0 0 0<br />
2<br />
Non-performing loans were defined applying the definition of past due contained in Basel II (i.e. inclusive of loans past due for more than 90 days).<br />
The figures for 2009 have been restated accordingly.
The following table presents RLB NÖ-<strong>Wien</strong>’s past due customer balances (in thousands of euros):<br />
Internal Rating 2010 Per Cent 2009 Per Cent<br />
0.5 Minimal risk 0 0.0 0 0.0<br />
1 Excellent credit standing 10 0.0 6,621 2.4<br />
1.5 Very good credit standing 968 0.4 29,978 11.1<br />
2 Good credit standing 2,072 1.0 6,966 2.6<br />
2.5 Average credit standing 1,834 0.9 8,592 3.2<br />
3 Mediocre credit standing 8,804 4.1 26,674 9.8<br />
3.5 Weak credit standing 7,876 3.6 17,312 6.4<br />
4 Very weak credit standing 30,612 14.2 18,862 7.0<br />
4.5 Doubtful/high default risk 11,647 5.4 32,696 12.1<br />
5 Default 151,536 70.3 122,745 45.3<br />
Unrated 172 0.1 198 0.1<br />
Total 215,531 100.0 270,644 100.0<br />
At the end of the 2010 financial year, impairment losses had not been recognized on past due customer balances<br />
totalling €54,200 thousand (year-end 2009: €106,539 thousand).<br />
Past Due 2010 Per Cent 2009 Per Cent<br />
Up to 30 days 31,146 57.5 38,940 36.5<br />
31 – 60 days 3,644 6.7 8,427 8.0<br />
61 – 90 days 1,319 2.4 5,045 4.7<br />
> 90 days 18,091 33.4 54,127 50.8<br />
Total 54,200 100.0 106,539 100.0<br />
At year-end 2010, the proportion of real estate loans in RLB NÖ-<strong>Wien</strong>’s total loan portfolio came to €3,210,932 thousand<br />
(year-end 2009: €2,539,767 thousand).<br />
2010 2009<br />
Category<br />
Residential<br />
Austria Per Cent Abroad Per Cent Austria Per Cent Abroad Per Cent<br />
(subsidized)<br />
Residential (financed<br />
537,996 21.0 0 0.0 330,194 16.4 0 0.0<br />
without subsidies) 719,896 28.1 37,440 5.8 655,046 32.6 36,185 6.8<br />
Commercial (tourism)<br />
Commercial<br />
173,049 6.8 135,076 20.7 118,796 5.9 115,799 21.8<br />
(shopping centres) 274,637 10.7 152,657 23.4 162,869 8.1 123,962 23.3<br />
Commercial (offices) 443,826 17.4 122,037 18.7 358,765 17.9 86,460 16.3<br />
Other 409,911 16.0 204,407 31.4 382,919 19.1 168,772 31.8<br />
Total 2,559,315 100.0 651,617 100.0 2,008,589 100.0 531,178 100.0<br />
67
68<br />
At year-end 2010, most of the real estate loan exposure, namely 79.7 per cent, was Austrian (year-end 2009: 79.1 per<br />
cent). Just 20.3 per cent of the real estate loan portfolio was foreign (year-end 2009: 20.9 per cent). A breakdown of<br />
this foreign real estate loan exposure by country shows a strong predominance of the Centrope region.<br />
The chart below depicts the percentage distribution of country limits based on internal ratings in the 2010 financial<br />
year and, by way of comparison, in the 2009 financial year:<br />
Internal Rating<br />
Cyprus<br />
Romania<br />
Netherlands<br />
0.5<br />
1.0<br />
1.5<br />
2.0<br />
2.5<br />
3.0<br />
3.5<br />
4.0<br />
Poland<br />
Germany<br />
Italy Italy<br />
Canada<br />
Switzerland<br />
Hungary<br />
Slovakia<br />
Slovakia<br />
Czech Republic<br />
0 50,000 100,000 150,000 200,000 250,000<br />
Risk concentrations at RLB NÖ-<strong>Wien</strong> are also monitored within the scope of country risk measurements and limited<br />
by way of special country limits. At the end of 2010, 94.0 per cent of the approved country exposures were in investment<br />
grade classes and a total of 87.2 per cent were assigned to one of the three best rating classes (0.5 to 1.5).<br />
2010<br />
2009<br />
2010<br />
2009<br />
0.0% 10.0% 20.0% 30.0% 40.0% 50.0% 60.0%<br />
Centrope<br />
= 76.8% (2009: 76.2%)<br />
Investment Grade<br />
= 94.0% (2009: 95.9%)
We will now look at the regional distribution of country limits. The charts below depict the percentage distributions of<br />
country limits in 2009 and 2010. Best-rated non-EU countries includes countries like the United States, Japan and<br />
Singapore that have Moody’s ratings of at least Aa3.<br />
We monitor branch and industry concentrations with the help of regular sector and industry analyses.The following<br />
charts provide breakdowns of the Bank’s loan exposure by sector and industry group (in per cent):<br />
54.5<br />
65.1<br />
Banks<br />
Other corporate customers<br />
2010 2009<br />
16.0<br />
2010 2009<br />
18.1<br />
EU 15<br />
Centrope<br />
Non-EU Eastern Europe and CIS<br />
Best-rated non-EU countries<br />
New EU countries Middle East<br />
5.7<br />
7.6<br />
4.2<br />
3.3<br />
3.2<br />
1.9<br />
1.7<br />
1.6<br />
0.9<br />
3.0<br />
13.3<br />
58.2<br />
14,2<br />
Federal government/provinces<br />
Jobholders<br />
Gewerbe3 Federal government/provinces<br />
Jobholders<br />
Gewerbe Trade<br />
3 Trade<br />
4.4<br />
Asia<br />
Other regions<br />
3.9<br />
3.0<br />
3.1<br />
13.2<br />
Other sectors and industries<br />
Gewerbe 3<br />
When analyzing the country risks captured by credit risk evaluations, RLB NÖ-<strong>Wien</strong> draws, inter alia, upon the professional<br />
support of the Financial Institutions, Country Risk and Portfolio Management Department at RBI. Among<br />
other things, the resulting internal country ratings provide the basis for RLB’s own country limits system, which applies<br />
in every organizational unit within the enterprise. RLB NÖ-<strong>Wien</strong> also cooperates closely with RBI’s Financial<br />
Institutions Analysis Department when analyzing banking risks. Moreover, RLB NÖ-<strong>Wien</strong> has access to RBI’s country<br />
and bank rating pool through a database. Since the financial markets crisis in 2008, exposures to other banks have<br />
undergone additional detailed scrutiny. The resulting risks are also brought into the assessment of overall bank risk<br />
within the framework of the risk-bearing capacity analysis process.<br />
67.2<br />
3 Within the meaning of Austria’s Gewerbeordnung (commercial code). Given the specific nature of some of the terms used in this breakdown, the<br />
reader is advised to refer to the German original if greater precision is desired<br />
18.6<br />
5.6<br />
3.0<br />
1.9<br />
1.7<br />
1.3<br />
0.7<br />
69
70<br />
RLB NÖ-<strong>Wien</strong> has reached contractual agreements with its customers in the corporate customers and retail banking<br />
segments regarding collateral, which takes the form of guarantees and other assets. When assessing collateral, the<br />
Bank makes allowance for its type, quality and realizability and the time needed for realization by carrying out appropriate<br />
collateral write-downs.<br />
The following table presents the structure of collateral given to RLB NÖ-<strong>Wien</strong> (in thousands of euros):<br />
Category of Collateral 2010 Per Cent 2009 Per Cent<br />
Land register 3,475,958 36.3 2,812,041 36.9<br />
Securities 309,626 3.2 241,800 3.2<br />
Financial products 701,948 7.3 896,039 11.7<br />
Insurance 185,760 2.0 167,753 2.2<br />
Other rights and claims 695,744 7.3 495,877 6.5<br />
Guarantees 4,204,461 43.9 3,017,142 39.5<br />
Total 9,573,497 100.0 7,630,652 100.0<br />
RLB NÖ-<strong>Wien</strong> does not directly purchase any collateral<br />
provided by customers. If collateral cannot immediately<br />
be realized, the Bank has subsidiaries through which<br />
such transactions take place. Any proceeds from the<br />
realization of collateral are netted off against the corresponding<br />
loan accounts when the collateral is realized.<br />
The corresponding parts of a loan are treated as having<br />
been secured prior to realization.<br />
MARKET RISK<br />
Market risk results from movements in market prices.<br />
These lead to fluctuations in the fair values of or future<br />
cash flows from financial instruments. RLB NÖ-<strong>Wien</strong><br />
defines interest rate risks, currency risks, other price<br />
risks and volatility risks as market risks.<br />
RLB NÖ-<strong>Wien</strong> has a trading book of short-term interest<br />
rate and currency transactions. Medium-term to longterm<br />
transactions are classified as part of the banking<br />
book.<br />
Market risk in the trading and banking books is measured<br />
using the customary value at risk approach (VaR:<br />
the potential loss with a given probability over a specified<br />
holding period). In addition, the banking book<br />
undergoes gap analysis, and basis point values (BPVs)<br />
are calculated for each currency.<br />
RLB NÖ-<strong>Wien</strong> has an extensive system of lines and<br />
limits for all trading and banking book portfolios made<br />
up of the Treasury Limits Framework and the Products,<br />
Services, Limits and Markets Catalogue. These regulatory<br />
tools limit market risk for each type of transaction<br />
and for each portfolio. In this risk category, value at risk<br />
and sensitivity limits have been defined to mitigate risks<br />
and stop-loss limits have been defined to limit the risk of<br />
losses.<br />
The limits system is updated annually by the Managing<br />
Board on the basis of recommendations made by Treasury<br />
Mid-office, which is a Head Office department.<br />
Adherence to this limits system is monitored daily by<br />
Treasury Mid-office to ensure that limits are observed.
MARKET RISK IN THE TRADING BOOK<br />
The Managing Board of RLB NÖ-<strong>Wien</strong> receives daily value at risk (VaR) reports containing information about current<br />
limit utilization in the trading book as a whole and in the individual portfolios within the trading book.<br />
€k<br />
1,400<br />
1,200<br />
1,000<br />
800<br />
600<br />
400<br />
200<br />
Jan 10 Feb 10 Mar 10 Apr 10 May 10 Jun 10 Jul 10 Aug 10 Sep 10 Oct 10 Nov 10 Dec 10<br />
The chart shows risk in the trading book and in its various<br />
sub-portfolios (interest rate trading, proprietary<br />
trading, flow, securities and currency sales) on a daily<br />
basis in terms of 99 per cent one-day value at risk. Daily<br />
worst-case analyses are also carried out, providing<br />
information about losses in extreme cases and showing<br />
how big the risk of losses on interest rate, currency and<br />
securities trading was in the course of 2010. To take an<br />
example, a value at risk of €200,000 means that, on the<br />
particular day of trading, the Bank would, with a probability<br />
of 99 per cent, not have been able to lose more<br />
than €200,000 on trading operations. This figure says<br />
nothing about the amount of the Bank’s actual gain or<br />
loss on the day in question.<br />
To keep risk in the trading book as small as possible,<br />
very narrow limits were set at the beginning of the year.<br />
Value at risk in the trading book arises primarily from the<br />
value at risk associated with interest rate trading.<br />
Trading by the Securities and Currency Sales<br />
Department consists mainly of trading as an<br />
intermediary, so it does not contribute to risk. There<br />
were sharp peaks in value at risk in the trading book in<br />
May and October. These were linked to the crisis in the<br />
so-called peripheral countries.<br />
The reliability of the VaR approach, which is based on<br />
historical data, is verified by daily backtesting and added<br />
to and continuously improved by weekly stress tests.<br />
The table below presents the Bank’s VaR at 31 December 2010 (99%, 1-day) and the comparative figures for<br />
31 December 2009 as shown in the chart above:<br />
€’000 VaR at 31/12/2010 VaR at 31/12/2009<br />
Trading book (total) 345 484<br />
Interest rate trading 296 488<br />
Currency trading 124 95<br />
Securities trading 1 50<br />
The value-at-risk figures that we obtain forecast maximum<br />
losses under normal market conditions but do not<br />
provide any information about the effects of exceptional,<br />
extreme market movements. Such events are taken<br />
account of using stress tests that capture the biggest<br />
VALUE AT RISK IN THE TRADING BOOK IN 2010<br />
TRADING BOOK INTEREST RATE TRADING (APM)<br />
CURRENCY TRADING (DHS) SECURITIES TRADING (WHS)<br />
daily market movements in the preceding six years. This<br />
allows the simulation of crisis situations and major fluctuations<br />
in market parameters. The simulations are then<br />
applied to portfolio positions.<br />
71
72<br />
The table below shows the Bank’s VaR (99%, 10-day) for market risk in the trading book:<br />
€’000 VaR at 31/12/2010 Average VaR Minimum VaR Maximum VaR<br />
Interest rate risk 982 2,005 39 4,272<br />
Currency risk 21 254 21 1,278<br />
Price risk 392 304 48 922<br />
€’000 VaR at 31/12/2009 Average VaR Minimum VaR Maximum VaR<br />
Interest rate risk 1,986 1,207 311 2,664<br />
Currency risk 134 384 23 1,894<br />
Price risk 592 427 81 810<br />
MARKET RISK IN THE BANKING BOOK<br />
Interest rate risk is managed centrally by Treasury, a<br />
Head Office department, which systematically aggregates<br />
and manages all interest rate positions. They are<br />
captured on the basis of internal contracts. In the case<br />
of large exposures, these are specifically agreed between<br />
customer account managers and the Treasury<br />
Department. Retail business is captured by the Bank’s<br />
internal systems.<br />
Interest rate risk is managed using gap analysis. Treasury<br />
Mid-office, a Head Office department, carries out<br />
VaR and scenario analyses on the basis of this gap<br />
analysis. The scenarios are based on the recommendations<br />
of the Finanzmarktaufsicht (Austrian Financial<br />
Market Authority) and OeNB (Austrian Nationalbank) as<br />
well as the Basel Committee on Banking Supervision.<br />
The Asset Liability Committee meets once a month.<br />
During its meetings, market risks in the banking book<br />
are reported and it decides on the Bank’s interest rates<br />
projection and interest rates policy.<br />
The following interest rate gaps mirror the structure of the Bank’s interest rate dependent operations, which are a<br />
product of the Asset Liability Committee’s interest rates projection. (Positive numbers mean that RLB NÖ-<strong>Wien</strong> receives<br />
fixed rates, whereas negative numbers mean that it pays them.)<br />
RLB NÖ-<strong>Wien</strong>’s interest rate gaps at 31 December 2010 (in thousands of euros):<br />
Interest Rate Gap 6 –12 Months 1 – 2 Years 2 – 5 Years > 5 Years<br />
EUR 510,319 (273,909) 620,899 (220,892)<br />
USD (16,466) (196,425) (52,080) 129,459<br />
JPY 75,216 (238) (713) 0<br />
CHF (24,118) 20,364 (1,938) 8,544<br />
Other 781 (1,629) (4,939) 0<br />
RLB NÖ-<strong>Wien</strong>’s interest rate gaps at 31 December 2009 (in thousands of euros):<br />
Interest Rate Gap 6 –12 Months 1 – 2 Years 2 – 5 Years > 5 Years<br />
EUR 194,444 (355,311) 198,338 426,052<br />
USD (23,029) (6,072) (17,728) 14,604<br />
JPY (117,617) (12) (35) 0<br />
CHF (712,166) 132,084 (1,647) 32,322<br />
Other (4,820) (451) (1,319) 0
Market risk is managed in line with the Bank’s interest<br />
rates projection. Banking book performance and risk<br />
analyses take place on a total return basis. In other<br />
words, they also look at changes in the present value of<br />
RLB NÖ-<strong>Wien</strong>’s banking book alongside the profit from<br />
maturity transformation (Strukturbeitrag), ensuring the<br />
sustained flexibility and profitability of its maturity trans-<br />
formation activities. To capture present value risk, interest<br />
rate gaps are recognized and measured like fixedinterest<br />
bonds or fixed-rate funding: positive values are<br />
treated like bonds, and negative values are treated like<br />
funding. Present value risk is calculated using a value at<br />
risk model to gauge the possible impact of a change in<br />
interest rates on the enterprise’s profit or loss.<br />
31/12/2010 Holding Period Confidence interval: 95%<br />
Portfolio Banking Book Trading Book<br />
RLB NÖ-<strong>Wien</strong> 180 days 18,912 1,876<br />
31/12/2009 Holding Period Confidence interval: 95%<br />
Portfolio Banking Book Trading Book<br />
RLB NÖ-<strong>Wien</strong> 180 days 27,807 4,310<br />
Changes in present value in RLB NÖ-<strong>Wien</strong>’s banking book at 31 December 2010 given a parallel, one-basis-point<br />
rise in interest rates: a positive number means that a rise in interest rates will cause an increase in present value; a<br />
negative number shows the loss in present value caused by a one-basis-point rise in interest rates (in thousands of<br />
euros). This change in present value mirrored the basis point value:<br />
Interest Rate Gap 6 –12 Months 1 – 2 Years 2 – 5 Years > 5 Years<br />
EUR (49.16) 52.97 (234.80) 162.63<br />
USD 38.08 5.09 16.92 (110.12)<br />
JPY (7.19) 0.05 0.28 0.00<br />
CHF 2.31 (3.96) 0.31 (2.30)<br />
Other (0.07) 0.31 1.88 (0.02)<br />
Changes in present value in RLB NÖ-<strong>Wien</strong>’s banking book at 31 December 2009 given a parallel, one-basis-point<br />
rise in interest rates (in thousands of euros):<br />
Interest Rate Gap 6 –12 Months 1 – 2 Years 2 – 5 Years > 5 Years<br />
EUR (16.90) 66.18 4.09 (564.14)<br />
USD 1.12 1.64 4.67 (15.76)<br />
JPY 10.09 0.00 0.01 0.00<br />
CHF 61.29 (24.42) 0.58 (37.85)<br />
Other 0.42 0.08 0.50 0.11<br />
Regulatory standards require the monthly simulation of<br />
the effects of interest rate shocks on the economic capital<br />
requirements for the banking book and trading book.<br />
The stress test used is a sudden and unexpected parallel<br />
shift in interest rates of plus 200 basis points. The<br />
maximum effect of this change in interest rates at<br />
31 December 2010 would have been €16,913 thousand,<br />
implying a decline of 1.01 per cent in our regulatory own<br />
funds in 2010.<br />
Derivative positions are a major cause of market risk.<br />
The risk content of derivative contracts is analyzed daily<br />
and the results are included in daily reports to the Managing<br />
Board. This ensures that the Managing Board too<br />
is kept informed about these transactions on a real-time<br />
basis. Note (32) Derivative financial instruments provides<br />
a detailed overview of their structure.<br />
73
74<br />
CURRENCY RISK<br />
RLB NÖ-<strong>Wien</strong>’s currency risks are managed centrally<br />
within the Treasury Department, a Head Office department,<br />
by the Proprietary and Flow Trading Department.<br />
Currency risks are limited by a system of limits (VaR<br />
limit, sensitivity limits and a stop-loss limit) detailed in<br />
the Treasury Limits Framework.<br />
As a result, all foreign currency positions are constantly<br />
monitored, controlled and managed.<br />
LIQUIDITY RISK<br />
Liquidity risk is the risk that the Bank may not be able to<br />
meet its current and future financial obligations in full or<br />
in time and that, if the market is not sufficiently liquid,<br />
transactions may not be possible or may only be possible<br />
on less favourable terms.<br />
Liquidity risk includes insolvency risk (liquidity risk in the<br />
narrow sense of the term), liquidity maturity transformation<br />
risk and the risk of regulatory sanctions and penalties<br />
for failure to observe minimum requirements (e.g.<br />
the minimum reserve requirement). Insolvency risk<br />
(liquidity risk in the narrow sense of the term) includes<br />
maturity risk (the risk of an unplanned lengthening of the<br />
period for which capital items treated as assets are tied<br />
up) and withdrawal risk (the risk of premature withdrawals<br />
of deposits, unexpected drawdowns on promised<br />
lines of credit). Liquidity maturity transformation risk<br />
includes market liquidity risk (balance sheet assets<br />
cannot be sold or can only be sold on poorer terms) and<br />
funding cost risk (follow-up funding is impossible or is<br />
only possible on poorer terms).<br />
Since 2007, funding cost risks have been captured on a<br />
scenario analysis basis within the scope of the riskbearing<br />
capacity analysis process.<br />
Being solvent at all times is a central focus at RLB NÖ-<br />
<strong>Wien</strong>. To achieve this, RLB NÖ-<strong>Wien</strong>, Raiffeisen-Holding<br />
NÖ-<strong>Wien</strong> and the Raiffeisen Banks in Lower Austria have<br />
had an appropriate joint limits system in place since<br />
2007. RLB NÖ-<strong>Wien</strong> has assumed responsibility for<br />
liquidity management for the NÖ-<strong>Wien</strong> Raiffeisen Banking<br />
Group (Raiffeisen-Holding NÖ-<strong>Wien</strong>, RLB NÖ-<strong>Wien</strong><br />
and the Raiffeisen Banks in Lower Austria) and prepares<br />
regular liquidity profiles. Liquidity risk is measured on<br />
the basis of the aggregated data for the NÖ-<strong>Wien</strong> Raiffeisen<br />
Banking Group (RBG NÖ-<strong>Wien</strong>) and the appropriate<br />
shares are applied in the appropriate amounts<br />
within the scope of risk-bearing capacity analysis processes<br />
at the Raiffeisen-Holding NÖ-<strong>Wien</strong> Group, Raiffeisen-Holding<br />
NÖ-<strong>Wien</strong> and RLB NÖ-<strong>Wien</strong>. Taking into<br />
account recommendations 1 – 18 of the CEBS Liquidity<br />
Risk Management Papers (CEBS 2008 147) and FMA’s<br />
liquidity risk management directive, which entered into<br />
force on 31 December 2010, the liquidity risk manage<br />
ment agreement in place within RBG NÖ-<strong>Wien</strong> and the<br />
liquidity risk model based upon it were already amended<br />
as of 31 March 2010.<br />
RBG NÖ-<strong>Wien</strong>’s liquidity position is observed under<br />
various scenarios, differentiating between normal case,<br />
crises of reputation, systemic crises and combined crisis<br />
scenarios. All the scenarios assume that no new business<br />
will be done in the present situation. The scenarios<br />
that are applied to each of the assumed stress situations<br />
differ in their effects on the cash flow balance sheet<br />
(including both on-balance sheet and off-balance sheet<br />
positions).<br />
When looking at risks, the existing liquidity gaps (surplus<br />
inflows and outflows of funds) in each of the defined<br />
maturity bands are compared with the liquidity buffer<br />
available at the time—comprising a pool of highly liquid<br />
assets (tenderable securities, credit claims, etc.)—in the<br />
light of the defined scenarios.<br />
In general, there is a strong focus on safeguarding liquidity<br />
within a defined survival period. It must be ensured<br />
by RLB NÖ-<strong>Wien</strong>’s available liquidity buffer and<br />
will be founded on the existing limits system. The survival<br />
period has been set at three months.<br />
The measurement model is regularly revised and<br />
adapted to changing conditions. RLB NÖ-<strong>Wien</strong> is currently<br />
working on the implementation of early-warning<br />
indicators that will allow the early recognition of possible<br />
future liquidity risks and liquidity bottlenecks.<br />
RLB NÖ-<strong>Wien</strong> has a detailed limits system in place to<br />
mitigate liquidity risk. In line with CEBS guidelines, it<br />
differentiates between three liquidity indicators: ‘shortterm<br />
liquidity transformation’, ‘structural liquidity<br />
transformation’ and ‘gap over assets’.<br />
‘Short-term liquidity transformation’ (known internally<br />
as O-LFT) describes short-term liquidity from one to 18<br />
months. It is the quotient of assets to liabilities in the<br />
accumulated maturity bands within this period. When<br />
calculating O-LFT, off-balance sheet items and the liquidity<br />
buffer are also taken into account on the assets<br />
side of the equation. This indicator shows whether a<br />
bank will be able to meet its short-term financial obligations<br />
without new business (funding rollovers).<br />
The second model, ‘structural liquidity transformation’<br />
(known internally as S-LFT), presents the long-term<br />
liquidity position of all participants at RBG NÖ-<strong>Wien</strong> for<br />
maturities from 18 months. It is the quotient of assets to<br />
liabilities for maturity bands from 18 months to more<br />
than 15 years on a band-by-band basis and presented<br />
in an aggregated form. When calculating the S-LFT<br />
indicator, off-balance sheet items and the liquidity buffer<br />
are also taken into account on the assets side of the<br />
equation. This indicator presents the matched maturity<br />
funding of long-term assets.
The third indicator used to monitor liquidity risk is the<br />
‘GBS quotient’ or ‘gap over assets’. Gap over assets<br />
is the quotient of net positions in each maturity band to<br />
balance sheet assets. It exposes any excessive funding<br />
risk in a specific maturity band.<br />
In addition to the system of indicators we have described,<br />
the Central Risk Department calculates and<br />
reports RLB NÖ-<strong>Wien</strong>’s short-term funding limit on a<br />
daily basis, comparing the current daily need to raise<br />
funds in the interbank market with the available tenderable<br />
securities.<br />
Account is also taken of the stronger focus on RLB NÖ-<br />
<strong>Wien</strong>’s short-term liquidity by way of the weekly liquidity<br />
reports to OeNB, which are also reported to the ensuing<br />
Managing Board meeting. Expected incoming payments<br />
are compared with expected outgoing payments<br />
and with the available liquidity buffer (dynamic approach).<br />
In addition, an appropriate emergency plan has been<br />
put in place to deal with any crises. If necessary, it will<br />
be put into effect by the Liquidity Management (LIMA)<br />
Committee. Liquidity is managed centrally by RLB NÖ-<br />
<strong>Wien</strong>’s Treasury Department, which is a Head Office<br />
department.<br />
The tables below present RLB NÖ-<strong>Wien</strong>’s structural liquidity in 2010 compared with 2009:<br />
€’000 31/12/2010<br />
Maturity Band Gap (Absolute) GBS GBS Limit<br />
Accumulated from<br />
Behind S-LFT S-LFT Limit<br />
18 months 147,705.02 0.49% (10%) 482,042.61<br />
2 years (550,611.17) (1.83%) (10%) 334,337.59 96.54% > 80%<br />
3 years 550,109.75 1.82% (10%) 884,948.76 93.02% > 70%<br />
5 years 668,690.23 2.22% (10%) 334,839.01<br />
7 years (913,594.68) (3.03%) (10%) (333,851.22) 96.81% > 60%<br />
10 years (963,704.69) 579,743.46<br />
15 years 630,124.07 1,543,448.15<br />
20 years 55,171.23 913,324.08<br />
30 years 390,095.51 858,152.85<br />
> 30 years 468,057.34 468,057.34 88.45% > 50%<br />
€’000 31/12/2009<br />
Maturity Band Gap (Absolute) GBS GBS Limit<br />
Accumulated from<br />
Behind S-LFT S-LFT Limit<br />
18 months 868,287.08 2.95% (10%) 470,943.92<br />
2 years (610,855.52) (2.07%) (10%) (397,343.15) 96.34% > 80%<br />
3 years 646,172.79 2.19% (10%) 213,512.37 98.09% > 70%<br />
5 years 48,004.38 0.16% (10%) (432,660.42)<br />
7 years (590,792.61) (2.01%) (10%) (480,664.80) 104.75% > 60%<br />
10 years (1,177,804.69) 110,127.80<br />
15 years 477,208.28 1,287,932.50<br />
20 years 187,037.90 810,724.22<br />
30 years 310,105.62 623,686.32<br />
> 30 years 313,580.70 313,580.70 97.56% > 50%<br />
75
76<br />
The table below provides a breakdown of RLB NÖ-<strong>Wien</strong>’s sources of funds compared with 2009:<br />
Repurchase agreements<br />
Subordinated debt capital<br />
and equity<br />
Tenders<br />
Savings deposit balances<br />
Issuances<br />
Raiffeisenkasse banks<br />
Other customers<br />
RZB and other banks<br />
Note (34) contains a supplementary breakdown of maturities<br />
at RLB NÖ-<strong>Wien</strong> that provides an overview of the<br />
Bank’s liquidity structure.<br />
EQUITY INVESTMENT RISK<br />
0% 5% 10% 15% 20% 25% 30% 35%<br />
Because of its focus on operating as a so-called universal<br />
bank, RLB NÖ-<strong>Wien</strong> holds equity investments within<br />
the Austrian Raiffeisen organization, all of which are<br />
strategic, as well as other equity investments that<br />
support its banking activities.<br />
Equity investment risk can affect RLB NÖ-<strong>Wien</strong> by way<br />
of losses caused by lost dividends, write-downs of carrying<br />
amounts, realized losses, transferred losses and<br />
declines in hidden reserves.<br />
The management and control of equity investments and<br />
the management of equity investment risk are carried<br />
out by Raiffeisen-Holding NÖ-<strong>Wien</strong> under a function<br />
allocation agreement (Geschäftsbesorgungsvertrag).<br />
2010<br />
2009<br />
The equity investment risk management process begins<br />
with a due diligence audit as soon as a new investment<br />
is acquired. As a rule, it is supported by external experts<br />
(management consultants, auditors, lawyers). In addition,<br />
in the case of big projects and poorly rated equity<br />
investments, the Risk Management/Group Control Department<br />
at Raiffeisen Holding carries out a risk assessment<br />
of the asset being acquired based on the<br />
opinions of front-office departments<br />
RLB NÖ-<strong>Wien</strong> exercises a significant influence over the<br />
business operations of the entities in which equity investments<br />
are held by appointing officers of RLB NÖ-<br />
<strong>Wien</strong> to serve in the managements and as members of<br />
the supervisory and advisory boards of such entities.<br />
The analysis and auditing of figures in financial statements<br />
and budgets and the assessment of strategic<br />
positions using SWOT (Strengths, Weaknesses, Opportunities<br />
and Threats) analyses are important means and<br />
measures used in the course of the Bank’s regular equity<br />
investment and risk control activities.
The following table presents the carrying amounts of RLB NÖ-<strong>Wien</strong>’s equity investments and their ratings at<br />
31 December 2010 and 31 December 2009:<br />
Carrying Amount<br />
Carrying Amount<br />
€’000<br />
31/12/2010 Per Cent Rating 31/12/2009 Per Cent Rating<br />
Investments in other banks<br />
Investments in banking-<br />
2,373,509 97.5 1.5 2,077,400 97.4% 1.5<br />
related fields 59,914 2.5 2.0 56,318 2.6% 2.0<br />
Total equity investments 2,433,423 100.0 1.5 2,133,718 100.0% 1.5<br />
Investments in other banks had the same risk rating of<br />
1.5 as in 2009. As for the economic climate, both Western<br />
and Eastern Europe saw a return to growth during<br />
the financial year under review. The improvement in the<br />
risk situation compared with the previous year was reflected<br />
by a substantial reduction in the impairment<br />
charge on loans and advances. Economic forecasts for<br />
2011 are also very positive, although there are still<br />
doubts about the sustainability of the uptrend.<br />
Similarly, there were no significant changes in the risks<br />
associated with RLB NÖ-<strong>Wien</strong>’s investments in bankingrelated<br />
fields. As a result, the overall rating of RLB NÖ-<br />
<strong>Wien</strong>’s equity investments was unchanged.<br />
Each quarter, the potential risks as assessed (for both<br />
problem cases and extreme cases) by experts and the<br />
covering assets arising from entities in which equity<br />
investments are held are brought into the periodic riskbearing<br />
capacity analyses carried out at the overall bank<br />
level.<br />
OPERATIONAL RISKS<br />
RLB NÖ-<strong>Wien</strong> defines operational risk as the risk of<br />
losses resulting from failures of systems and processes<br />
or caused by staff or external risks. This definition includes<br />
legal risks.<br />
Operational risks at RLB NÖ-<strong>Wien</strong> are constantly monitored<br />
and action is taken to mitigate them. This process<br />
is supported by continuous staff training, emergency<br />
plans, backup systems and unremitting process quality<br />
enhancement. Rules of procedure are implemented and<br />
instructions issued to minimize these risks. All action<br />
taken to mitigate operational risks must also take costbenefit<br />
considerations into account.<br />
RLB NÖ-<strong>Wien</strong> has a loss database containing historical<br />
data from 1999 onward as well as all current cases from<br />
2001. This has created the foundations for an operational<br />
risk management approach that goes beyond the<br />
basic indicator approach. The Managing Board is given<br />
quarterly reports on the course of recorded loss events.<br />
RLB NÖ-<strong>Wien</strong> is a participant in projects to refine various<br />
risk management systems being carried out within the<br />
Austrian Raiffeisen organization.<br />
RLB NÖ-<strong>Wien</strong> carries out risk self-assessments at divisional<br />
and departmental level that span the entire Group<br />
to identify potentially serious but infrequent risks. Consciously<br />
studying loss events also has learning effects<br />
that make it possible to mitigate risks.<br />
During both the risk self-assessment process and the<br />
capturing of loss events, classifications take place using<br />
internationally accepted methods. In 2010, we began an<br />
early-warning key risk indicators pilot project in the payment<br />
services and investment and private pension and<br />
saving products fields as an additional instrument for<br />
identifying operational risks alongside self-assessment<br />
and the loss database. This represents a consistent<br />
continuation of the measures being taken on our path<br />
towards the proactive management of operational risk.<br />
Operational risk is currently recognized using the earnings<br />
volatility method and taken account of during the<br />
risk-bearing capacity analysis process.<br />
To safeguard against operational risk within the meaning<br />
of § 22i BWG, RLB NÖ-<strong>Wien</strong> has undertaken to use the<br />
basic indicator approach within the meaning of § 22j<br />
BWG to calculate its minimum own funds requirement<br />
and to make the requisite disclosures to the regulators.<br />
The basic indicator approach does not impose any<br />
further obligations on the Bank to quantify its operational<br />
risks.<br />
CUSTOMER DEPOSIT GUARANTEE ASSOCIATION<br />
(KUNDENGARANTIEGEMEINSCHAFT) OF THE<br />
AUSTRIAN RAIFFEISEN ORGANIZATION<br />
Supplementing internal measures to capture, measure<br />
and manage risk, RLB NÖ-<strong>Wien</strong> is a member of the<br />
Raiffeisen customer deposit guarantee association<br />
(Kundengarantiegemeinschaft). This association of<br />
Raiffeisen Banks, Regional Raiffeisen Banks (<strong>Raiffeisenlandesbank</strong>en),<br />
RZB and RBI guarantees on a mutual<br />
basis up to 100 per cent of all customer deposit balances<br />
with those entities as well as securities issued by<br />
those entities. The customer deposit guarantee association<br />
is a two-tiered organization. It functions at a<br />
regional level, with, for instance, Raiffeisen Banks in<br />
Lower Austria mutually guaranteeing customer deposit<br />
77
78<br />
balances, and a second level of security is provided by<br />
the federal customer deposit guarantee association<br />
(Bundeskundengarantiegemeinschaft), which comes<br />
into play when any regional guarantee system proves<br />
insufficient. The customer deposit guarantee association<br />
of the Raiffeisen Banks, Regional Raiffeisen Banks,<br />
RZB and RBI thus provides a double safety net to secure<br />
customer deposits.<br />
THE SOLIDARITY ASSOCIATION<br />
(SOLIDARITÄTSVEREIN) OF RAIFFEISEN-<br />
BANKENGRUPPE NIEDERÖSTERREICH-WIEN<br />
RLB NÖ-<strong>Wien</strong> and the Raiffeisen Banks in Lower Austria<br />
have jointly set up this solidarity association to ensure<br />
that members in financial difficulties can be given suitable<br />
help. The solidarity association thus provides<br />
added security alongside the Austrian and Lower Austrian<br />
Raiffeisen deposit guarantee system described<br />
below.<br />
DEPOSIT GUARANTEE FACILITIES OF THE<br />
AUSTRIAN RAIFFEISEN ORGANIZATION<br />
RLB NÖ-<strong>Wien</strong> and the Raiffeisen Banks in Lower Austria<br />
are members of Österreichische Raiffeisen-<br />
Einlagensicherung reg. Gen. mbH. by way of Raiffeisen-<br />
Einlagensicherung <strong>Niederösterreich</strong>-<strong>Wien</strong> reg. Gen.<br />
mbH. This deposit guarantee cooperative is the ‘liability<br />
facility’ (Haftungseinrichtung) for the whole of the Austrian<br />
Raiffeisen Banking Group for the purposes of § 93,<br />
§ 93a and § 93b BWG. The early-warning system used<br />
to safeguard deposits within the Austrian Raiffeisen<br />
organization provides a high level of security for savers<br />
and investors that goes far beyond the legislative requirements.<br />
This early-warning system is based on<br />
extensive income and risk performance reporting by all<br />
the Regional Raiffeisen Banks (including all the Raiffeisen<br />
Banks within a particular province) to Österreichische<br />
Raiffeisen-Einlagensicherung reg. Gen. mbH<br />
combined with appropriate continuous analysis and<br />
monitoring processes.<br />
THE AUSTRIAN RAIFFEISEN BANKING GROUP<br />
The Austrian Raiffeisen Banking Group (Österreichische<br />
Raiffeisen-Bankengruppe) is the country’s largest private<br />
banking group. It consists of some 540 locally active<br />
Raiffeisen Banks, eight Regional Raiffeisen Banks and<br />
RZB in Vienna, making up the country’s densest banking<br />
network with a total of 1,684 banking outlets. Roughly<br />
1.7 million Austrians are members—and therefore also<br />
co-owners—of a Raiffeisen bank.<br />
GOVERNMENT DEPOSIT GUARANTEES<br />
To boost saver confidence, the Austrian government<br />
reacted to the uncertainty among savers caused by the<br />
financial markets crisis by guaranteeing 100 per cent of<br />
personal deposits. This guarantee was put in place until<br />
31 December 2009. Since 1 January 2010, the guaranteed<br />
amount of personal deposits has been limited to<br />
€100,000 per customer and bank, and the deposits of<br />
small and medium-sized enterprises have been guaranteed<br />
up to a maximum of €50,000 per customer and<br />
bank. From 1 January 2011, there will be one ceiling of<br />
€100,000. There is an exhaustive list of exceptions to<br />
these deposit guarantees that includes the deposit<br />
balances of large corporations.
(32) DERIVATIVE FINANCIAL INSTRUMENTS<br />
The following tables present the derivative financial products outstanding on the balance sheet date, broken down by<br />
maturity.<br />
• Derivative financial products not held for trading and recorded on the Balance Sheet in the line items Other<br />
assets or Other liabilities:<br />
2010 NOMINAL AMOUNTS FAIR VALUES<br />
€’000 Term to Maturity<br />
Total<br />
a) Interest rate contracts<br />
Up to<br />
1 Year<br />
17,547,417<br />
14,973,300<br />
From 1 to<br />
5 Years<br />
22,779,297<br />
22,258,010<br />
From 5 Years<br />
and Over Total Positive Negative<br />
21,325,404<br />
20,646,486<br />
61,652,118<br />
57,877,796<br />
1,935,279 (2,040,310)<br />
1,897,297 (1,919,237)<br />
(contracts traded on a stock<br />
exchange)<br />
Interest rate futures 151,000 0 0 151,000 247 (156)<br />
(OTC products)<br />
Interest rate swaps 14,211,537 21,024,348 19,677,457 54,913,342 1,876,319 (1,895,405)<br />
FRAs – calls 100,000 0 0 100,000 10 (31)<br />
FRAs – puts 100,000 0 0 100,000 37 (7)<br />
Interest rate options – calls 154,280 555,661 428,624 1,138,565 20,529 (11)<br />
Interest rate options – puts 256,183 646,301 540,405 1,442,889 0 (23,318)<br />
Bond options – calls 11,500 11,500 155 0<br />
Bond options – puts 300 20,200 20,500 0 (309)<br />
b) Exchange rate contracts<br />
(OTC products)<br />
2,554,520 87,708 184,126 2,826,354 28,575 (115,608)<br />
Currency forwards<br />
Cross currency and cross currency<br />
52,092 0 0 52,092 811 (910)<br />
interest rate swaps 2,486,032 67,550 184,126 2,737,708 25,850 (112,784)<br />
Currency options – calls 8,198 10,079 0 18,277 1,914 0<br />
Currency options – puts 8,198 10,079 0 18,277 0 (1,914)<br />
c) Securities contracts<br />
19,597<br />
46,439<br />
494,792<br />
560,828<br />
2,609 (4,122)<br />
(contracts traded on a stock<br />
exchange)<br />
Equity and index futures 3,186 0 0 3,186 0 (41)<br />
(OTC products)<br />
Equity and index options – calls 1,000 4,400 223,211 228,611 407 0<br />
Equity and index options – puts 15,411 4,401 223,376 243,188 0 (1,317)<br />
Other securities contracts 37,638 48,205 85,843 2,202 (2,764)<br />
d) Credit derivatives<br />
(OTC products)<br />
Credit default swaps – secured<br />
0 387,140 0 387,140 6,798 (1,343)<br />
party<br />
Credit default swaps – securing<br />
0 64,300 0 64,300 1,804 (1,138)<br />
party 0 322,840 0 322,840 4,994 (205)<br />
79
80<br />
2009 NOMINAL AMOUNTS FAIR VALUES<br />
€’000 Term to Maturity<br />
Up to From 1 to From 5 Years<br />
1 Year 5 Years and Over Total Positive Negative<br />
Total 16,428,556 28,412,522 21,303,342 66,144,420 1,914,704 (2,047,626)<br />
a) Interest rate contracts<br />
(contracts traded on a stock<br />
exchange)<br />
12,634,377 27,960,223 20,789,111 61,383,711 1,860,362 (1,968,639)<br />
Interest rate futures<br />
(OTC products)<br />
269,300 0 0 269,300 1,082 (132)<br />
Interest rate swaps 9,504,253 26,612,194 20,410,377 56,526,824 1,850,649 (1,953,319)<br />
FRAs – calls 520,846 138,831 0 659,677 192 (211)<br />
FRAs – puts 520,846 138,831 0 659,677 220 (136)<br />
Interest rate options – calls 471,700 380,788 133,834 986,322 7,960 0<br />
Interest rate options – puts 1,347,432 657,579 244,900 2,249,911 0 (14,342)<br />
Bond options – calls 0 11,500 0 11,500 259 0<br />
Bond options – puts 0 20,500 0 20,500 0 (499)<br />
b) Exchange rate contracts<br />
(OTC products)<br />
3,586,285 45,873 231,578 3,863,736 36,895 (68,813)<br />
Currency forwards<br />
Cross currency and cross currency<br />
37,454 0 0 37,454 240 (587)<br />
interest rate swaps 3,410,193 22,877 225,578 3,658,648 32,964 (64,535)<br />
Currency options – calls 69,319 11,498 3,000 83,817 3,691 0<br />
Currency options – puts 69,319 11,498 3,000 83,817 0 (3,691)<br />
c) Securities contracts 14,011 19,711 282,653 316,375 7,677 (8,259)<br />
(contracts traded on a stock<br />
exchange)<br />
Equity and index futures<br />
(OTC products)<br />
4,458 0 0 4,458 0 (49)<br />
Equity and index options – calls 0 4,400 91,900 96,300 763 0<br />
Equity and index options – puts 9,553 4,401 92,900 106,854 0 (2,551)<br />
Other securities contracts 0 10,910 97,853 108,763 6,914 (5,659)<br />
d) Credit derivatives<br />
(OTC products)<br />
Credit default swaps – secured<br />
193,883 386,715 0 580,598 9,770 (1,915)<br />
party<br />
Credit default swaps – securing<br />
0 69,300 0 69,300 605 (1,659)<br />
party 193,883 317,415 0 511,298 9,165 (256)
• Derivative financial products held for trading and recognized on the Balance Sheet in the line items Trading assets<br />
or Trading liabilities:<br />
2010 NOMINAL AMOUNTS FAIR VALUES<br />
€’000 Term to Maturity<br />
Total<br />
Up to<br />
1 Year<br />
2,934,003<br />
From 1 to<br />
5 Years<br />
5,328,720<br />
From 5 Years<br />
and Over Total Positive Negative<br />
3,017,806<br />
11,280,529<br />
227,486 (225,600)<br />
a) Interest rate contracts<br />
(contracts traded on a stock<br />
exchange)<br />
730,980 4,972,816 3,017,806 8,721,602 100,057 (116,019)<br />
Interest rate futures<br />
(OTC products)<br />
80,000 0 0 80,000 35 (76)<br />
Interest rate swaps 519,980 4,916,576 2,936,768 8,373,324 99,391 (113,241)<br />
Interest rate options – calls 0 3,000 40,519 43,519 631 0<br />
Interest rate options – puts 131,000 53,240 40,519 224,759 0 (2,702)<br />
b) Exchange rate contracts<br />
(OTC products)<br />
2,188,200 355,904 0 2,544,104 127,309 (109,542)<br />
Currency options – calls 1,111,004 180,704 0 1,291,708 126,947 0<br />
Currency options – puts<br />
Other exchange rate contracts –<br />
1,072,863 175,200 0 1,248,063 0 (109,153)<br />
calls<br />
Other exchange rate contracts –<br />
1,797 0 0 1,797 362 0<br />
puts 2,536 0 0 2,536 0 (389)<br />
c) Securities contracts<br />
(OTC products)<br />
14,823 0 0 14,823 120 (39)<br />
Index futures 1,369 0 0 1,369 85 0<br />
Equity and index options – calls 2,977 0 0 2,977 35 0<br />
Equity and index options – puts 10,477 0 0 10,477 0 (39)<br />
d) Credit derivatives 0 0 0 0 0 0<br />
81
82<br />
2009 NOMINAL AMOUNTS FAIR VALUES<br />
€’000 Term to Maturity<br />
Up to From 1 to From 5 Years<br />
1 Year 5 Years and Over Total Positive Negative<br />
Total 1,827,283 3,683,681 393,964 5,904,928 60,811 (57,751)<br />
a) Interest rate contracts<br />
(contracts traded on a stock<br />
exchange)<br />
631,612 3,345,767 393,964 4,371,343 19,013 (21,714)<br />
Interest rate futures<br />
(OTC products)<br />
9,000 0 0 9,000 66 0<br />
Interest rate swaps 352,452 2,901,073 301,620 3,555,145 15,718 (15,845)<br />
Interest rate options – calls 55,372 222,347 21,172 298,891 3,229 0<br />
Interest rate options – puts 214,788 222,347 71,172 508,307 0 (5,869)<br />
b) Exchange rate contracts<br />
(OTC products)<br />
1,195,671 337,914 0 1,533,585 41,798 (36,037)<br />
Currency options – calls 600,880 169,243 0 770,123 41,057 0<br />
Currency options – puts<br />
Other exchange rate contracts –<br />
587,135 168,671 0 755,806 0 (35,363)<br />
calls<br />
Other exchange rate contracts –<br />
3,828 0 0 3,828 741 0<br />
puts 3,828 0 0 3,828 0 (674)<br />
c) Securities contracts 0 0 0 0 0 0<br />
d) Credit derivatives 0 0 0 0 0 0<br />
These nominal and fair values are derived from the (non-netted) totals of all calls and puts. Fair values are stated<br />
here at dirty prices (fair value inclusive of accrued interest).<br />
Derivative interest rate instruments and derivatives on securities were mainly acquired within the scope of proprietary<br />
trading. Exchange rate derivatives were acquired within the scope of both proprietary and customer business. Credit<br />
derivatives were only acquired within the scope of proprietary trading.
(33) FAIR VALUES OF FINANCIAL INSTRUMENTS<br />
FINANCIAL INSTRUMENTS RECOGNIZED AT FAIR VALUE<br />
Fair value is the amount for which a financial instrument<br />
could be exchanged between knowledgeable, willing<br />
parties in an arm’s length transaction. One distinguishes<br />
between different valuation ‘levels’: At Level I,<br />
available market prices are used (applies mainly to<br />
securities and derivatives traded on exchanges and in<br />
liquid markets). All other financial instruments are<br />
measured using valuation models. These are mainly<br />
present value and generally accepted option price models.<br />
At Level II, use is made of input data based directly<br />
or indirectly on observable market data. At Level III,<br />
valuation takes place using models that estimate fair<br />
value based on the bank’s own internal assumptions.<br />
2010<br />
€’000 Level I Level II Level III<br />
Assets<br />
Trading assets 106,355 465,656 0<br />
Other current financial assets<br />
designated as at fair value through profit or loss 1,156,261 1,156,663 7,622<br />
Financial investments<br />
classified as available for sale and measured at fair value 1,549,650 391,801 0<br />
Other assets<br />
(positive fair values of derivative financial instruments) 230 1,930,264 155<br />
Liabilities<br />
Liabilities evidenced by paper<br />
designated as at fair value through profit or loss 0 882,069 0<br />
Trading liabilities 115 225,453 0<br />
Other liabilities<br />
(negative fair values of derivative financial instruments) 156 2,034,205 304<br />
Subordinated debt capital<br />
designated as at fair value through profit or loss 0 87,355 0<br />
2009<br />
€’000 Level I Level II Level III<br />
Assets<br />
Trading assets 20,366 346,501 22,050<br />
Other current financial assets<br />
designated as at fair value through profit or loss 967,510 1,528,253 8,527<br />
Financial investments<br />
classified as available for sale and measured at fair value 570,740 547,424 32,029<br />
Other assets<br />
(positive fair values of derivative financial instruments) 1,058 1,924,531 259<br />
Liabilities<br />
Liabilities evidenced by paper<br />
designated as at fair value through profit or loss 0 882,356 0<br />
Trading liabilities 0 56,938 0<br />
Other liabilities<br />
(negative fair values of derivative financial instruments) 132 2,053,951 487<br />
Subordinated debt capital<br />
designated as at fair value through profit or loss 0 77,860 0<br />
The fair values of derivatives are stated here at dirty prices (fair value inclusive of accrued interest).<br />
83
84<br />
Reclassifications between Level I and Level II:<br />
2010<br />
€’000<br />
Assets<br />
From Level I<br />
to Level II<br />
From Level II<br />
to Level I<br />
Trading assets 0 55,937<br />
Other current financial assets<br />
designated as at fair value through profit or loss 15,527 252,081<br />
Other current financial assets<br />
classified as available for sale and measured at fair value 3,863 334,009<br />
2009<br />
€’000<br />
Assets<br />
From Level I<br />
to Level II<br />
From Level II<br />
to Level I<br />
Trading assets 19,648 0<br />
Other current financial assets<br />
designated as at fair value through profit or loss 642,390 0<br />
Other current financial assets<br />
classified as available for sale and measured at fair value 916 0<br />
For each financial instrument, we checked whether prices were listed in an active market (Level I). If listed market<br />
prices were not available for a financial instrument, observable market data like yield curves were used to calculate a<br />
fair value (Level II). If our assessment of the situation changed, reclassification took place.<br />
Reconciliation<br />
Financial instruments allocated to Level III:<br />
2010<br />
€’000<br />
Trading<br />
Assets<br />
Current<br />
Financial<br />
Assets<br />
Financial<br />
Investments<br />
Other<br />
Assets Other Liabilities<br />
At 1 January 22,050 8,527 32,029 259 (487)<br />
Reclassification to Level III 0 118 0 0 0<br />
Purchases<br />
Revaluation gains and losses (profit/(loss) from financial<br />
0 55 0 0 0<br />
investments)<br />
Revaluation gains and losses (other operating<br />
0 (693) 0 0 0<br />
profit/(loss)) 0 0 0 (104) 183<br />
Reclassification from level III (22,050) 0 (32,029) 0 0<br />
Sales 0 (385) 0 0 0<br />
At 31 December<br />
Revaluation gains and losses on financial instruments<br />
recognized in the Consolidated Income Statement at<br />
0 7,622 0 155 (304)<br />
31 December 0 (693) 0 (104) 183<br />
2009<br />
€’000<br />
Trading<br />
Assets<br />
Current<br />
Financial<br />
Assets<br />
Financial<br />
Investments<br />
Other<br />
Assets Other Liabilities<br />
At 1 January 0 9,580 0 7 (273)<br />
Reclassification to Level III 22,050 0 29,339 0 0<br />
Purchases<br />
Revaluation gains and losses (other operating<br />
0 953 2,400 259 (450)<br />
profit/(loss)) 0 0 0 (7) 236<br />
Interest accruals 0 (6) 291 0 0<br />
Sales 0 (2,000) 0 0 0<br />
At 31 December<br />
Revaluation gains and losses on financial instruments<br />
recognized in the Consolidated Income Statement at<br />
22,050 8,527 32,030 259 (487)<br />
31 December 0 0 0 (7) 236
FINANCIAL INSTRUMENTS NOT RECOGNIZED AT FAIR VALUE<br />
Fixed-interest loans and advances to and deposits from<br />
customers and other banks were only measured to fair<br />
values different from their carrying amounts on the Balance<br />
Sheet if they had a term to maturity of more than<br />
one year. Variable-rate loans and advances and deposits<br />
were only included if they had an interest rate adjustment<br />
period of more than one year; only in such<br />
cases does discounting based on an assumed interest<br />
rate in line with market rates have a material effect. The<br />
table below presents the fair values and carrying<br />
amounts of balance sheet items that are, as a rule, not<br />
measured at fair value. Loans and advances to other<br />
banks and Loans and advances to customers are reported<br />
net of impairment allowance balances.<br />
2010<br />
€’000 Fair Value Carrying Amount Difference<br />
Assets<br />
Loans and advances to other banks 12,295,891 12,176,373 119,518<br />
Loans and advances to customers 9,431,266 9,418,069 13,197<br />
Financial investments 3,553,349 3,548,723 4,626<br />
Of which classified as held to maturity 1,534,102 1,529,477 4,626<br />
Of which classified as available for sale and measured at<br />
cost 77,794 77,794 0<br />
Of which classified as available for sale and measured at<br />
fair value 1,941,452 1,941,452 0<br />
Liabilities<br />
Deposits from other banks 16,076,933 15,899,314 177,618<br />
Deposits from customers 7,075,506 7,071,160 4,346<br />
Liabilities evidenced by paper 3,781,437 3,843,953 (62,516)<br />
Of which classified at amortized cost 2,899,368 2,961,884 (62,516)<br />
Of which designated as at fair value through profit or loss 882,069 882,069 0<br />
Subordinated debt capital 724,651 753,739 (29,088)<br />
Of which classified at amortized cost 637,296 666,384 (29,088)<br />
Of which designated as at fair value through profit or loss 87,355 87,355 0<br />
2009<br />
€’000 Fair Value Carrying Amount Difference<br />
Assets<br />
Loans and advances to other banks 12,903,235 12,742,977 160,258<br />
Loans and advances to customers 8,473,330 8,452,772 20,557<br />
Financial investments 3,276,911 3,278,686 (1,775)<br />
Of which classified as held to maturity 2,049,306 2,051,081 (1,775)<br />
Of which classified as available for sale and measured at<br />
cost 77,411 77,411 0<br />
Of which classified as available for sale and measured at<br />
fair value 1,150,193 1,150,193 0<br />
Liabilities<br />
Deposits from other banks 16,083,277 15,883,332 199,945<br />
Deposits from customers 6,870,845 6,870,496 349<br />
Liabilities evidenced by paper 3,653,369 3,664,804 (11,435)<br />
Of which classified at amortized cost 2,771,013 2,782,448 (11,435)<br />
Of which designated as at fair value through profit or loss 882,356 882,356 0<br />
Subordinated debt capital 697,270 715,890 (18,620)<br />
Of which classified at amortized cost 619,410 638,030 (18,620)<br />
Of which designated as at fair value through profit or loss 77,860 77,860 0<br />
85
86<br />
If no reliable market values were available for equity<br />
instruments reported in the line item Financial investments,<br />
they were measured at cost. If the volume or<br />
frequency of trades gave reason to doubt a price’s<br />
validity, listed equity instruments were measured at cost.<br />
In the case of unlisted equity instruments, there were no<br />
observable market transactions in identical or similar<br />
equity instruments on the basis of which reliable fair<br />
values could be deduced. Estimation of a reliable fair<br />
value or its determination within a range of fluctuation<br />
weighted on the basis of specific occurrence probabilities<br />
by means of a discounted cash flow measurement<br />
or similar method was not productive in that fair values<br />
can only be calculated on the basis of an entity’s internal<br />
data, from which, however, no market relevance can be<br />
reliably deduced.
Additional Information<br />
(34) BREAKDOWN OF TERMS TO MATURITY<br />
Breakdown of terms to maturity at 31 December 2010:<br />
On Demand or<br />
of Unspecified Up to From 3 Months From 1 to From 5 Years<br />
€’000<br />
Maturity 3 Months to 1 Year 5 Years and Over Total<br />
Loans and advances to other banks 1,160,752 6,191,408 1,411,569 2,748,487 676,297 12,188,513<br />
Loans and advances to customers 192,094 2,038,596 917,219 3,457,207 3,075,319 9,680,435<br />
Trading assets 4,053 29,114 101,552 183,168 270,461 588,348<br />
Other current financial assets 365,582 116,071 185,286 1,159,335 494,271 2,320,545<br />
Financial investments 200,705 210,354 171,932 1,521,695 1,444,037 3,548,723<br />
Deposits from other banks 4,927,671 7,747,923 370,717 1,694,690 1,158,313 15,899,314<br />
Deposits from customers 3,862,344 474,514 1,342,811 855,997 535,494 7,071,160<br />
Liabilities evidenced by paper 0 78,538 484,080 2,491,268 790,067 3,843,953<br />
Trading liabilities 0 19,936 64,917 91,714 65,816 242,383<br />
Subordinated debt capital 49,426 35,687 0 65,117 603,509 753,739<br />
Breakdown of terms to maturity at 31 December 2009:<br />
On Demand or<br />
of Unspecified Up to From 3 Months From 1 to From 5 Years<br />
€’000<br />
Maturity 3 Months to 1 Year 5 Years and Over Total<br />
Loans and advances to other banks 855,399 6,876,570 1,154,713 2,886,123 985,417 12,758,222<br />
Loans and advances to customers 308,776 2,002,981 1,048,768 2,532,337 2,803,276 8,696,138<br />
Trading assets 2,609 29,172 50,350 116,664 197,790 396,585<br />
Other current financial assets 350,315 68,432 159,978 1,365,450 560,115 2,504,290<br />
Financial investments 199,426 82,596 476,537 1,619,553 900,574 3,278,686<br />
Deposits from other banks 4,005,241 6,793,468 2,188,398 1,607,526 1,288,699 15,883,332<br />
Deposits from customers 3,406,765 773,330 969,275 1,173,247 547,879 6,870,496<br />
Liabilities evidenced by paper 0 273,503 538,451 1,883,949 968,901 3,664,804<br />
Trading liabilities 0 10,894 28,594 19,641 5,910 65,039<br />
Subordinated debt capital 44,934 36,664 0 83,275 551,017 715,890<br />
87
88<br />
(35) RELATED PARTY DISCLOSURES<br />
€’000 2010 2009<br />
Loans and advances to other banks<br />
Parent 1,471,960 1,363,262<br />
Entities accounted for using the equity method 5,889,286 5,714,835<br />
Associates (not accounted for using the equity method) 1,827 2,561<br />
Loans and advances to customers<br />
Entities related via the parent 381,731 291,506<br />
Non-consolidated subsidiaries 31,592 9,759<br />
Entities accounted for using the equity method 95 120<br />
Associates (not accounted for using the equity method) 10,328 9,798<br />
Impairment allowance balance<br />
Non-consolidated subsidiaries (5,140) (1,583)<br />
Trading assets<br />
Parent 0 2,487<br />
Entities accounted for using the equity method 20,527 21,656<br />
Other current financial assets<br />
Entities accounted for using the equity method 85,528 105,833<br />
Financial investments<br />
Parent 277 277<br />
Entities accounted for using the equity method 144,306 168,550<br />
Other assets<br />
Parent 111,208 91,514<br />
Entities related via the parent 233 249<br />
Entities accounted for using the equity method 58,111 54,094<br />
Associates (not accounted for using the equity method) 352 203<br />
€’000 2010 2009<br />
Deposits from other banks<br />
Entities accounted for using the equity method 4,584,161 4,056,443<br />
Deposits from customers<br />
Entities related via the parent 276,560 283,119<br />
Non-consolidated subsidiaries 6,235 9,104<br />
Associates (not accounted for using the equity method) 4,158 7,460<br />
Liabilities evidenced by paper<br />
Non-consolidated subsidiaries 3,407 155<br />
Entities accounted for using the equity method 9,180 9,193<br />
Trading liabilities<br />
Entities accounted for using the equity method 387 283<br />
Other liabilities<br />
Parent 82,415 73,880<br />
Entities accounted for using the equity method 59,707 56,416<br />
Provisions<br />
Entities related via the parent 0 2<br />
Subordinated debt capital<br />
Parent 19,312 25,436<br />
Entities accounted for using the equity method 5,619 12,481
€’000<br />
Contingent liabilities<br />
2010 2009<br />
Parent 5,814 6,123<br />
Entities related via the parent 17,509 10,729<br />
Non-consolidated subsidiaries 51 14,398<br />
Entities accounted for using the equity method 334,944 159,221<br />
Associates (not accounted for using the equity method) 22 22<br />
RLB NÖ-<strong>Wien</strong>’s parent is Raiffeisen-Holding NÖ-<strong>Wien</strong>. Business relationships between RLB NÖ-<strong>Wien</strong> and Raiffeisen-<br />
Holding NÖ-<strong>Wien</strong> primarily involved the funding of Raiffeisen-Holding NÖ-<strong>Wien</strong> and the use of derivative financial<br />
instruments.<br />
Business relationships with related parties were conducted on arm’s length terms and conditions.<br />
In view of the immaterial amounts involved, receivables from and payables to members of the Managing Board and<br />
members of the Supervisory Board of RLB NÖ-<strong>Wien</strong>, management personnel, members of the managing and supervisory<br />
boards of Raiffeisen-Holding NÖ-<strong>Wien</strong> and members of their families as related parties for the purposes of IAS<br />
24 were not disclosed. Those business relationships did not have any material effects on the Consolidated Financial<br />
Statements.<br />
(36) REMUNERATION OF BOARD MEMBERS<br />
Expenditure on the members of the Managing Board of RLB NÖ-<strong>Wien</strong> broke down as follows:<br />
€’000 2010 2009<br />
Expenditure on<br />
Short-term benefits 2,143 1,507<br />
Post-employment benefits 1,080 531<br />
Other long-term benefits 15 0<br />
Termination benefits 0 727<br />
€55 thousand was paid to the members of the Supervisory Board during 2010 (2009: €55 thousand).<br />
Remuneration paid to erstwhile Managing Board members (including erstwhile members of the managing board of<br />
the former RLB reg. Gen.m.b.H.) and their surviving dependents came to €1,097 thousand (2009: €2,102 thousand).<br />
(37) DISCLOSURE OF LOANS AND ADVANCES TO MEMBERS OF THE MANAGING BOARD AND<br />
MEMBERS OF THE SUPERVISORY BOARD IN ACCORDANCE WITH § 266 Z. 5 UGB<br />
On the balance sheet date, loans outstanding to the<br />
members of the Managing Board came to €1,969 thousand<br />
(2009: €1,560 thousand). Loans and advances to<br />
members of the Supervisory Board came to €31 thousand<br />
(2008: €109 thousand).<br />
No guarantees were in place on behalf of this group of<br />
persons. Loans and advances to the members of the<br />
Supervisory Board also included loans and advances to<br />
employees appointed to the Supervisory Board by the<br />
Staff Council.<br />
Durations and interest rates were those generally available<br />
from banks. During the financial year, €20 thousand<br />
was repaid by members of the Managing Board<br />
(2009: €59 thousand), and €7 thousand was repaid by<br />
members of the Supervisory Board (2009:<br />
€185 thousand).<br />
89
90<br />
(38) FOREIGN CURRENCY BALANCES<br />
The following balances of assets and liabilities denominated in a foreign currency were recognized in the Consolidated<br />
Financial Statements:<br />
€’000 2010 2009<br />
Assets 2,805,643 2,598,318<br />
Liabilities 1,309,917 968,030<br />
(39) ASSETS AND LIABILITES ABROAD<br />
Assets and liabilities arising from transactions with counterparties outside Austria broke down as follows:<br />
€’000 2010 2009<br />
Assets 6,075,962 6,369,582<br />
Liabilities 3,405,062 3,559,076<br />
(40) SUBORDINATED ASSETS<br />
Assets included the following subordinated assets:<br />
€’000 2010 2009<br />
Loans and advances to other banks 40,609 40,609<br />
Loans and advances to customers 4,368 6,937<br />
Trading assets 2,677 5,076<br />
Other current financial assets 37,398 31,378<br />
Financial investments 302,490 301,996<br />
Total 387,541 385,996<br />
(41) SUBORDINATED BORROWINGS<br />
SUBORDINATED DEBT CAPITAL<br />
The following subordinated debt instruments were issued during the financial year:<br />
Currency<br />
Amount<br />
(€’000)<br />
Interest<br />
Rate Maturing on<br />
Extraordinary<br />
Right of<br />
Termination<br />
Nachrangiger Raiffeisen Best Zins Garant<br />
2010-2022/61 (private placement) EUR 28,752 1 28 February 2022 None<br />
1 No periodic interest payments will be made on these notes during their term. Instead, a positive difference will develop between their initial issue<br />
price or issue price from time to time and their redemption price. The redemption price will be 100 per cent of their nominal value plus the<br />
performance of the Dow Jones EURO STOXX 50 (R) Index expressed in percentage terms. The redemption price will be at least 185 per cent of the<br />
notes’ nominal value and not more than 235 per cent of their nominal value.<br />
This is subordinated debt capital within the meaning of § 23 Abs. 8 BWG.<br />
These notes are securities issued in a continuous manner.
SUPPLEMENTARY CAPITAL<br />
The following supplementary capital instruments were issued during the 2010 financial year:<br />
Amount Interest<br />
Extraordinary<br />
Right of<br />
Currency<br />
(€’000) Rate Maturing on Termination<br />
1<br />
Raiffeisen Ergänzungskapital Stufenzins-<br />
Obligation 2010-2018/9<br />
Raiffeisen Ergänzungskapital<br />
EUR 32,240 1 26 March 2018 None<br />
2 Schuldverschreibungen 2010-2020/15 EUR 25,015 5% 3 September 2020 None<br />
1 During the first coupon period (26 March 2010 – 25 March 2011) and the second coupon period (26 March 2011 – 25 March 2012), the coupon is<br />
3.00 per cent per annum; during the third coupon period (26 March 2012 – 25 March 2013) and the fourth coupon period (26 March 2013 –<br />
25 March 2014), the coupon is 4.00 per cent per annum; during the fifth coupon period (26 March 2014 – 25 March 2015) and the sixth coupon<br />
period (26 March 2015 – 25 March 2016), the coupon is 5.00 per cent per annum; during the seventh coupon period (26 March 2016 – 25 March<br />
2017), the coupon period is 6.00 per cent per annum; and during the eighth coupon period (26 March 2017 – 25 March 2018), the coupon is 8.00<br />
per cent per annum. Interest is calculated using the Actual/Actual (ICMA) method.<br />
This is subordinated debt capital within the meaning of § 23 Abs. 7 BWG.<br />
These notes are securities issued in a continuous manner.<br />
(42) CONTINGENT LIABILITIES AND OTHER OFF-BALANCE SHEET LIABILITIES AND COMMITMENTS<br />
The following off-balance sheet liabilities and commitments existed at year-end:<br />
€’000 2010 2009<br />
Contingent liabilities 1,175,532 917,488<br />
Of which arising from other guarantees 1,082,541 837,024<br />
Of which arising from letters of credit 92,879 80,352<br />
Of which other contingent liabilities 112 112<br />
Commitments 6,004,913 5,600,372<br />
Of which arising from revocable loan promises<br />
(stand-by facilities) 6,004,913 5,600,372<br />
Up to 1 year 3,845,783 4,037,451<br />
More than 1 year 2,159,130 1,562,921<br />
Of which arising from ‘non-genuine’ or ‘pseudo’ repurchase agreements 0 0<br />
RLB NÖ-<strong>Wien</strong> is a member of Raiffeisen-Kundengarantiegemeinschaft NÖ-<strong>Wien</strong> (Raiffeisen customer deposit guarantee<br />
association in Lower Austria and Vienna). Under the provisions of the association’s memorandum and articles<br />
(Vereinssatzung), the joint and several settlement of payables to customers (Deposits from customers as per line<br />
item 2 of Equity and liabilities on the Balance Sheet) and payables to other banks (as per line item 1 of Equity and<br />
liabilities on the Balance Sheet) and securities issued by any insolvent member of the association are guaranteed up<br />
to the limit of the sum of the individual capacities of the other members of the association.<br />
The capacity of any one member of the association will depend on its freely available reserves subject to the pertinent<br />
provisions of BWG.<br />
Raiffeisen-Kundengarantiegemeinschaft NÖ-<strong>Wien</strong> is, in turn, a member of Raiffeisen-Kundengarantiegemeinschaft<br />
Österreich (Raiffeisen customer deposit guarantee association in Austria), whose members are RZB, RBI and other<br />
Landeskundengarantiegemeinschaften (regional Raiffeisen customer deposit guarantee associations). The purpose<br />
of the association is the same as that of Raiffeisen-Kundengarantiegemeinschaft NÖ-<strong>Wien</strong> with respect to RZB, RBI<br />
and the members of the regional Raiffeisen customer deposit guarantee associations that have joined it (see also<br />
Note (31) Risk <strong>Report</strong>).<br />
91
92<br />
(43) REPURCHASE AGREEMENTS<br />
The following repurchase and redelivery commitments existed at 31 December:<br />
€’000 2010 2009<br />
Genuine repurchase agreements as seller<br />
Deposits from other banks 563,228 708,288<br />
Total 563,228 708,288<br />
At the end of the financial year, the carrying amount of the securities sold subject to a sale and repurchase agreement<br />
came to €550,656 thousand (2009: €712,713 thousand). No securities were purchased within the scope of a<br />
sale and repurchase agreement.<br />
(44) ASSETS PLEDGED AS COLLATERAL<br />
The following assets recognized on the Balance Sheet were pledged as collateral for the liabilities listed below:<br />
€’000 2010 2009<br />
Securities lodged in connection with ECB tenders 1,697,825 2,200,388<br />
Collateral for derivative contracts 885,110 989,353<br />
Receivables assigned to OeNB 811,895 621,176<br />
Cover pool for issued covered partial debentures 684,858 657,112<br />
Receivables assigned to OeKB 491,367 578,688<br />
Bonds lodged with OeKB in connection with EIB loans 127,090 126,914<br />
Receivables assigned to the EIB 86,780 91,454<br />
Receivables in the RZB cover pool 55,100 0<br />
Collateral for securities transactions with OeKB (securities) 29,000 29,000<br />
Cover pool for fiduciary savings deposit balances 13,401 12,983<br />
Receivables assigned to KfW 11,128 7,960<br />
Bonds lodged with OeKB as a clearing link for the Deutsche Börse<br />
(Xetrahandel) 8,918 8,754<br />
Other receivables assigned 6,903 6,903<br />
Government bond pledged in favour of Raiffeisen Wohnbaubank AG 6,495 6,154<br />
Deposit for ‘HOAM.AT’ (Home Accounting Module Austria, formerly ‘ARTIS’)<br />
lodged with OeNB 5,320 5,153<br />
Collateral for securities transactions lodged with OeKB (cash deposit) 55 54<br />
Total 4,921,245 5,341,992<br />
The following liabilities were collateralized by the assets recognized on the Balance Sheet:<br />
€’000 2010 2009<br />
Deposits from other banks 2,185,684 2,941,530<br />
Deposits from customers 9,043 8,497<br />
Liabilities evidenced by paper 375,764 570,663<br />
Other liabilities 885,110 989,353<br />
Total 3,455,601 4,510,043
(45) TRUST ACTIVITIES<br />
Fiduciary balances on the balance sheet date that were not included on the Balance Sheet changed as follows:<br />
€’000 2010 2009<br />
Loans and advances to customers 18,422 22,834<br />
Fiduciary assets 18,422 22,834<br />
Deposits from customers 18,422 22,834<br />
Fiduciary liabilities 18,422 22,834<br />
(46) DISCLOSURE OF BONDS AND OTHER FIXED-INTEREST SECURITIES AND OF BONDS ISSUED BY<br />
THE GROUP IN ACCORDANCE WITH § 64 BWG ABS. 1 Z. 7 BWG<br />
Bonds and other fixed-interest securities and bonds issued by the Group maturing in the year following the balance<br />
sheet date broke down as follows:<br />
€’000 2010 2009<br />
a) Receivables arising from bonds and other fixed-interest securities 629,307 487,066<br />
b) Payables arising from bonds issued by the Group 478,399 710,061<br />
(47) DISCLOSURE OF SECURITIES ADMITTED FOR TRADING ON AN EXCHANGE IN ACCORDANCE<br />
WITH § 64 ABS. 1 Z. 10 BWG<br />
Listed Unlisted<br />
€’000 2010 2009 2010 2009<br />
Bonds and other fixed-interest securities 4,255,088 4,446,636 0 0<br />
Shares and other variable-yield securities 237,724 236,247 0 0<br />
(48) DISCLOSURE OF FINANCIAL INVESTMENTS IN ACCORDANCE WITH § 64 ABS. 1 Z. 11 BWG<br />
The securities included in the line items Bonds and other fixed-interest securities and Shares and other variable-yield<br />
securities that were admitted for trading on an exchange and were classified as investments broke down as follows:<br />
€’000 2010 2009<br />
a) Bonds and other fixed-interest securities 2,132,528 2,136,166<br />
b) Shares and other variable-yield securities 179,405 186,772<br />
Classification as a Financial investment or Current financial asset was decided on a case-by-case basis by the<br />
responsible committees.<br />
93
94<br />
(49) DISCLOSURE OF (NOMINAL) HOLDINGS IN THE TRADING BOOK IN ACCORDANCE<br />
WITH § 22 BWG<br />
€’000 2010 2009<br />
Fixed-interest securities, nominal values 216,329 190,959<br />
Supplementary capital bonds (Ergänzungskapitalanleihe), nominal values<br />
Shares, investment certificates, participation notes (Genussrecht), market<br />
450 450<br />
prices 4,052 2,609<br />
Other financial instruments (derivatives), nominal values 11,290,529 5,904,928<br />
(50) REGULATORY OWN FUNDS<br />
The RLB NÖ-<strong>Wien</strong> Group is a subgroup of the Raiffeisen-Holding NÖ-<strong>Wien</strong> Group. The calculation of regulatory own<br />
funds in accordance with § 24 BWG in conjunction with § 30 BWG is geared to the superordinate institution in the<br />
credit institution group (Kreditinstitutsgruppe). Consequently, regulatory own funds are presented in the consolidated<br />
financial statements of the Raiffeisen-Holding NÖ-<strong>Wien</strong> Group. BWG does not govern the regulatory own<br />
funds of subsidiaries that make up a subgroup. The following presentation of RLB NÖ-<strong>Wien</strong>’s own funds (partially<br />
consolidated) within the meaning of BWG is therefore provided for informational purposes only. Calculations were<br />
carried out in accordance with the applicable provisions of BWG 1993 as amended in 2006 (Basel II).<br />
€’000 2010 2009<br />
Paid-in capital 290,743 290,743<br />
Earned capital 1,116,686 1,008,973<br />
Minorities 59 75<br />
Hybrid capital 0 0<br />
Intangible assets (5,947) (6,272)<br />
Tier 1 capital 1,401,541 1,293,519<br />
Deductions from Tier 1 capital (147,286) (154,103)<br />
Eligible Tier 1 capital (after deductions) 1,254,255 1,139,416<br />
Supplementary capital within the meaning of § 23 (1). 5 BWG 272,151 271,232<br />
Hidden reserves 50,700 20,700<br />
Supplement in respect of amounts guaranteed 0 0<br />
Long-term subordinated debt capital 377,968 371,140<br />
Additional own funds 700,819 663,072<br />
Deductions from additional own funds (147,286) (154,102)<br />
Additional own funds (after deductions) 553,533 508,970<br />
Eligible own funds 1,807,788 1,648,386<br />
Tier 2 capital available to be reclassified as Tier 3 capital 18,665 12,665<br />
Total own funds 1,826,453 1,661,051<br />
Surplus own funds 724,615 597,645<br />
Surplus own funds ratio 65.76% 56.20%<br />
Tier 1 ratio (credit risk) 9.70% 9.07%<br />
Total Tier 1 ratio 9.11% 8.57%<br />
Own funds ratio (credit risk) 13.98% 13.12%<br />
Total own funds ratio 13.26% 12.50%<br />
The Tier 1 ratio and own funds ratio are stated in relation to the risk-weighted basis of assessment pursuant to<br />
§ 22 BWG.
The total own funds requirement was made up as follows:<br />
€’000<br />
Own funds requirement<br />
2010 2009<br />
Credit risk pursuant to § 22 (2) BWG 1,034,423 1,005,352<br />
Trading book pursuant to § 22o (2) BWG 18,665 12,665<br />
Operational risk pursuant to § 22i BWG 48,750 45,389<br />
Qualifying equity investments pursuant to § 29 Abs. 4 BWG 0 0<br />
Total own funds requirement 1,101,838 1,063,406<br />
Basis of assessment (credit risk) pursuant to § 22 (2) BWG 12,930,288 12,566,900<br />
Basis of assessment (total risk) 13,772,975 13,292,575<br />
Information required to be disclosed pursuant to § 26 und § 26a BWG and the Offenlegungsverordnung (Austrian<br />
disclosures directive) is published by the superordinate credit institution, Raiffeisen-Holding NÖ-<strong>Wien</strong>, on its website<br />
at www.rhnoew.at. The relevant information pertaining to RLB NÖ-<strong>Wien</strong> is published on its website at<br />
www.rlbnoew.at.<br />
(51) AVERAGE NUMBER OF STAFF<br />
The average number of staff employed during the financial year (full time equivalents) broke down as follows:<br />
2010 2009<br />
White collar 1,231 1,196<br />
Blue collar 0 0<br />
Total 1,231 1,196<br />
(52) EVENTS AFTER THE BALANCE SHEET DATE AND APPROVAL OF THE CONSOLIDATED FINANCIAL<br />
STATEMENTS<br />
To date, there have been no business transactions or<br />
other occurrences that could be of particular public<br />
interest or that could materially affect the <strong>Annual</strong> Financial<br />
Statements for 2011. The Consolidated Financial<br />
Statements were completed by the Managing Board<br />
during the Managing Board meeting on 21 March 2011,<br />
are being examined by the Supervisory Board and will<br />
be presented for approval during the Supervisory Board<br />
meeting on 12 April 2011.<br />
95
96<br />
Overview of Equity Investments (pursuant to § 265 Abs. 2 UGB)<br />
The tables below present the RLB NÖ-<strong>Wien</strong> Group’s equity investments.<br />
(53) CONSOLIDATED SUBSIDIARIES<br />
Subscribed<br />
Percentage<br />
Entity<br />
Capital Currency<br />
Held Type 1<br />
‘ARSIS’ Beteiligungs GmbH, Vienna 140,000 € 100% OT<br />
‘BARIBAL’ Holding GmbH, Vienna 105,000 € 100% OT<br />
‘EXEDRA’ Holding GmbH, Vienna 70,000 € 100% OT<br />
‘FIBULA’ Beteiligungs GmbH, Vienna 70,000 € 100% OT<br />
Acceptia Holding GmbH, Vienna<br />
Raiffeisen Centropa Invest Verwaltungs- und Beteiligungs<br />
35,000 € 100% OT<br />
AG, Vienna 250,000 € 80% OT<br />
RLB NÖ-<strong>Wien</strong> Holding GmbH, Vienna 70,000 € 100% OT<br />
RLB NÖ-<strong>Wien</strong> Sektorbeteiligungs GmbH, Vienna 35,000 € 100% OT<br />
RLB Ostbankenholding GmbH, Vienna 37,000 € 100% OT<br />
Tatra Holding GmbH, Vienna 37,000 € 100% OT<br />
VAKS - Veranstaltungskartenservice Ges.m.b.H., Vienna 37,000 € 100% OT<br />
(54) ENTITIES ACCOUNTED FOR IN THE CONSOLIDATED FINANCIAL STATEMENTS USING THE<br />
EQUITY METHOD<br />
Entity Subscribed Capital Currency<br />
Percentage<br />
Held Type 1<br />
Raiffeisenbank a.s., Prague (CZ) 6,564,000,000 Kč 24.00% BA<br />
Raiffeisen Informatik GmbH, Vienna 1,460,000 € 47.75% OT<br />
Raiffeisen Bank International AG, Vienna 596,290,628 € 0.54% BA<br />
Raiffeisen Bank Zrt., Budapest (H)<br />
Raiffeisen Zentralbank Österreich Aktiengesellschaft,<br />
45,129,140,000 Ft 16.23% BA<br />
Vienna 443,713,864 € 31.41% BA<br />
Tatra banka a.s., Bratislava (SK) 54,554,928 € 12.62% BA<br />
Stock market prices of entities accounted for using the equity method:<br />
€ per share 31 December 2010<br />
Raiffeisen Bank International AG, Vienna 41.00<br />
Summary of financial information about entities accounted for using the equity method:<br />
€’000 2010 2009<br />
Assets 292,978,465 249,806,166<br />
Liabilities 269,300,376 230,566,600<br />
Revenues (non-banking) 1,302,210 1,164,682<br />
Net interest income (banking) 8,091,225 7,213,403<br />
Profit for the year 1,948,512 809,266
(55) NON-CONSOLIDATED SUBSIDIARIES<br />
Subscribed<br />
Percentage<br />
Entity<br />
Capital Currency<br />
Held Type 1<br />
‘AKTUELL’ Raiffeisen Versicherungs-Maklerdienst<br />
Gesellschaft m.b.H., Vienna<br />
‘PRONEPOS’ Immobilienentwicklungs- und Beteiligungs<br />
73,000 € 100.00% OT<br />
GmbH, Vienna 35,000 € 100.00% OT<br />
‘PRUBOS’ Beteiligungs GmbH, Vienna 35,000 € 100.00% OT<br />
‘TEMISTO’ Beteiligungs GmbH, Vienna 35,000 € 100.00% OT<br />
‘TOJON’ Beteiligungs GmbH, Vienna 70,000 € 100.00% OT<br />
Baureo Projektentwicklungs GmbH, Vienna 35,000 € 100.00% OT<br />
B&E Projektmanagement GmbH, Vienna 41,176 € 85.00% OT<br />
KREBEG Finanzierungsberatungs GmbH, Vienna<br />
MODAL-Gesellschaft für betriebsorientierte Bildung und<br />
35,000 € 95.00% OT<br />
Management GmbH, Vienna 400,000 € 75.00% OT<br />
NÖ Raiffeisen Kommunalservice Holding GmbH, Vienna 35,000 € 100.00% OT<br />
Raiffeisen Beratung direkt GmbH, Vienna<br />
Raiffeisen-Einlagensicherung <strong>Niederösterreich</strong>-Vienna<br />
registrierte Genossenschaft mit beschränkter Haftung,<br />
37,000 € 100.00% BR<br />
Vienna<br />
Raiffeisen Liegenschafts- und Projektentwicklungs GmbH,<br />
41,936 € 98.40% OT<br />
<strong>Wien</strong>er Neudorf<br />
Raiffeisen Versicherungs- und Bauspar-Agentur GmbH,<br />
35,000 € 100.00% OT<br />
Vienna 70,000 € 100.00% OT<br />
RALV Holding GmbH, Vienna 37,000 € 100.00% OT<br />
RLB Businessconsulting GmbH, Vienna 35,000 € 100.00% OT<br />
RLB NÖ-W Factoring Beteiligungs GmbH, Vienna 70,000 € 100.00% OT<br />
RLB NÖ-<strong>Wien</strong> Leasingbeteiligungs GmbH, Vienna 35,000 € 100.00% OT<br />
TIONE Altbau-Entwicklung GmbH, Vienna<br />
Veritas Treuhandgesellschaft für Versicherungsüberprüfung<br />
37,000 € 100.00% OT<br />
und -vermittlung m.b.H., Graz 50,000 € 100.00% OT<br />
97
98<br />
(56) OTHER EQUITY INVESTMENTS<br />
Associates not accounted for using the equity method:<br />
Subscribed<br />
Percentage<br />
Entity<br />
Capital Currency<br />
Held Type 1<br />
‘SALUTANS’ Holding GmbH, Vienna<br />
Central Danube Region Marketing & Development GmbH,<br />
35,000 € 50.00% OT<br />
Vienna<br />
Die <strong>Niederösterreich</strong>ische Leasing Gesellschaft m.b.H.,<br />
200,000 € 50.00% OT<br />
Vienna<br />
Die <strong>Niederösterreich</strong>ische Leasing Gesellschaft m.b.H. &<br />
36,400 € 40.00% OT<br />
CO KG, Vienna2 — — — FI<br />
ecoplus International GmbH, Vienna 35,000 € 30.00% OT<br />
e-force Internet-Entwicklungen für e-business GmbH, Linz 39,375 € 20.28% OT<br />
NÖ Beteiligungsfinanzierungen GmbH, Vienna<br />
NÖ Raiffeisen Kommunalprojekte Service Gesellschaft<br />
1,816,821 € 29.00% BA<br />
m.b.H., Vienna 50,000 € 74.00% FI<br />
Raiffeisen Factoring Holding GmbH, Vienna 35,000 € 35.77% OT<br />
Raiffeisen Software Solution und Service GmbH, Vienna 773,000 € 37.83% OT<br />
RSC Raiffeisen Daten Service Center GmbH, Vienna 2,000,000 € 25.01% OT<br />
KEY:<br />
1<br />
Entity type<br />
BA Bank<br />
BR Entity rendering banking-related ancillary services<br />
FH Financial holding company<br />
FI Other financial institution<br />
OT Other<br />
2<br />
Partner with unlimited liability.<br />
As a result of contractual agreements, NÖ Raiffeisen Kommunalprojekte Service Gesellschaft m.b.H. and Die <strong>Niederösterreich</strong>ische<br />
Leasing Gesellschaft m.b.H. & Co. KG were not controlled.
(57) ENTITIES RELATED VIA PARENT RAIFFEISEN-HOLDING NÖ-WIEN<br />
Of which consolidated subsidiaries of Raiffeisen-Holding NÖ-<strong>Wien</strong>:<br />
‘ADELANTE’ Holding GmbH, Vienna<br />
‘ALDOS’ Beteiligungs GmbH, Vienna<br />
‘ALMARA’ Holding GmbH, Vienna<br />
AMPA s.r.o., Pardubice (CZ)<br />
AURORA Kamionka Sp. z o.o., Kamień Krajeński (PL)<br />
AURORA MÜHLE HAMBURG GmbH, Hamburg (D)<br />
AURORA MÜHLEN GMBH, Hamburg (D)<br />
AURORA POLSKA Sp. z o.o., Kutno (PL)<br />
‘BALURA’ Holding GmbH, Vienna<br />
‘BASCO’ Beteiligungs GmbH, Vienna<br />
‘BELLAGIO’ Holding GmbH, Vienna<br />
BLR-Baubeteiligungs GmbH., Vienna<br />
‘BORTA’ Holding GmbH, Vienna<br />
Botrus Beteiligungs GmbH, Vienna<br />
cafe+co International Holding GmbH, Vienna<br />
café+co Ital- és Ételautomata Kft., Alsónémedi (H)<br />
‘CRIOLLA’ Beteiligungs GmbH, Vienna<br />
Delikomat Betriebsverpflegung Gesellschaft m.b.H., Vienna<br />
Delikomat Deutschland Automaten Catering GmbH, Regensburg (D)<br />
DELIKOMAT d.o.o., Maribor (SI)<br />
Delikomat Polska Sp. z o.o., Bielsko-Biała (PL)<br />
Delikomat s.r.o., Brno (CZ)<br />
DELTA MLÝNY s.r.o., Kyjov (CZ)<br />
DEVELOP Baudurchführungs- und Stadtentwicklungs-Gesellschaft m.b.H., St. Pölten<br />
DEVON GRUNDSTÜCKSVERWALTUNGS-GESELLSCHAFT MBH & Co. Mühlenobjekte KG, Eschborn (D)<br />
Diamant International Malom Kft., Baja (H)<br />
Diamant International Polska Mlyny Stanislawa Grygiera Sp. z o.o., Grodzisk Wielkopolski (PL)<br />
DIAMANT STRADUNIA Sp. z o.o., Stradunia (PL)<br />
‘DIMALO’ Beteiligungs GmbH, Vienna<br />
DZR Immobilien und Beteiligungs GmbH, Vienna<br />
Eidermühle GmbH, Hamburg (D)<br />
‘EMERIA’ Beteiligungs GmbH, Vienna<br />
‘ERCOM’ Beteiligungs GmbH, Vienna<br />
Erste <strong>Wien</strong>er Walzmühle Vonwiller Gesellschaft m.b.H., Schwechat<br />
‘ESTELEC’ Beteiligungs GmbH, Vienna<br />
Estezet Beteiligungsgesellschaft m.b.H., Vienna<br />
Eudamonia Projektentwicklungs GmbH, Vienna<br />
FARINA Mühlen GmbH, Raaba<br />
‘FILIUS’ Holding GmbH, Vienna<br />
Frischlogistik und Handel GmbH, Baden bei <strong>Wien</strong><br />
‘GINAWE’ Beteiligungs GmbH, Vienna<br />
Gloria Mühlenwerke GmbH, Hamburg (D)<br />
KAMPFFMEYER Food Innovation GmbH, Hamburg (D)<br />
Kampffmeyer Mühlen GmbH, Hamburg (D)<br />
Kremser Landstraße Projektentwicklung GmbH, Vienna<br />
‘Küche & Kantine’ Betrieb GmbH, Vienna<br />
‘LAREDO’ Beteiligungs GmbH, Vienna<br />
LBD Lebensmittel Beratungsdienst GmbH, Mannheim (D)<br />
99
100<br />
LEIPNIK-LUNDENBURGER INVEST Beteiligungs Aktiengesellschaft, Vienna<br />
LLI EUROMILLS GmbH, Vienna<br />
‘LOMBA’ Beteiligungs GmbH, Vienna<br />
Marchfelder Zuckerfabriken Gesellschaft m.b.H., Vienna<br />
‘MARMARIS’ Holding GmbH, Vienna<br />
MAZ Beteiligungs GmbH, Vienna<br />
Mecklenburger Elde-Mühlen GmbH , Parchim (D)<br />
Mona Hungary Kft., Budapest (H)<br />
‘MORUS’ Beteiligungs GmbH, Vienna<br />
Müller´s Mühle GmbH, Gelsenkirchen (D)<br />
NBV Beteiligungs- und Vermögensverwaltungsgesellschaft m.b.H., Vienna<br />
‘NESSOS’ Beteiligungs GmbH, Vienna<br />
<strong>Niederösterreich</strong>ische Milch Holding GmbH, Vienna<br />
NOBE Grundstücksverwaltung GmbH, Hamburg (D)<br />
NÖM AG, Baden bei <strong>Wien</strong><br />
NOM DAIRY UK LIMITED, London (UK)<br />
NÖM International AG, Baden<br />
Nordland Mühlen GmbH, Jarmen (D)<br />
Obere Donaustraße Liegenschaftsbesitz GmbH, Vienna<br />
‘Octavia’ Holding GmbH, Vienna<br />
‘OLIGO’ Holding GmbH, Vienna<br />
PANNONMILL Malomipari Zrt., Komárom (H)<br />
‘PIANS’ Beteiligungs GmbH, Vienna<br />
‘PROCAS’ Holding GmbH, Vienna<br />
‘PROKAP’ Beteiligungs GmbH, Vienna<br />
Raiffeisen Agrar Holding GmbH, Vienna<br />
Raiffeisen Agrar Invest GmbH, Vienna<br />
RAIFFEISEN-HOLDING NÖ-<strong>Wien</strong> Beteiligungs GmbH, Vienna<br />
Rannersdorfer Bio Mühlen GmbH, Schwechat<br />
RARITAS Holding GmbH, Vienna<br />
‘RASKIA’ Beteiligungs GmbH, Vienna<br />
R-FMZ Immobilienholding GmbH, Vienna<br />
RFT Beteiligungs GmbH, Vienna<br />
RH Anteilsverwaltungs GmbH, Vienna<br />
RH Finanzberatung und Treuhandverwaltung Gesellschaft m.b.H., Vienna<br />
RH Finanzbeteiligungs GmbH, Vienna<br />
RHG Holding GmbH, Vienna<br />
RHG Management GmbH, Vienna<br />
RH Versicherungsholding GmbH, Vienna<br />
RH WEL Beteiligungs GmbH, Vienna<br />
Rosenmühle GmbH, Ergolding (D)<br />
Rossauer Lände 3 Immobilienprojektentwicklung GmbH, Vienna<br />
‘RUMOR’ Holding GmbH, Vienna<br />
Schüttmühle Berlin GmbH, Berlin (D)<br />
‘SEPTO’ Beteiligungs GmbH, Vienna<br />
Sofia Mel EAD, Sofia (BG)<br />
St. Leopold Liegenschaftsverwaltungs- und Beteiligungsgesellschaft m.b.H., Vienna<br />
‘TALIS’ Holding GmbH, Vienna<br />
TITAN S.A., Pantelimon (RO)<br />
TOP-CUP Office-Coffee-Service Vertriebsgesellschaft m.b.H., Klagenfurt<br />
TOV Regionprodukt, Gnidin (UA)<br />
UNIMILLS a.s., Prague (CZ)
‘URUBU’ Holding GmbH, Vienna<br />
Vendare Warenhandelsgesellschaft m.b.H., Vienna<br />
VK Mühlen Aktiengesellschaft, Hamburg (D)<br />
VK MÜHLEN POLSKA Sp. z o.o., Grodzisk Wielkopolski (PL)<br />
VK ‘Polen’ GmbH, Hamburg (D)<br />
Zucker-Beteiligungsgesellschaft m.b.H., Vienna<br />
Zucker Invest GmbH, Vienna<br />
Zuckermarkt - Studiengesellschaft m.b.H., Vienna<br />
Zucker Vermögensverwaltungs GmbH, Vienna<br />
Of which non-consolidated entities in the Raiffeisen Holding NÖ-<strong>Wien</strong> Group:<br />
ABC Reiseservice GmbH, Vienna<br />
‘ARAGOS’ Beteiligungs GmbH, Vienna<br />
‘ARANJA’ Beteiligungs GmbH, Vienna<br />
‘BANUS’ Beteiligungs GmbH, Vienna<br />
‘BENEFICIO’ Holding GmbH, Vienna<br />
Beteiligungsgesellschaft Diamant Mühle Hamburg GmbH, Hamburg (D)<br />
Big Push Vertrieb GmbH in Liqu., Vienna<br />
Bioenergie Orth a.d. Donau GmbH, Vienna<br />
‘BONADEA’ Immobilien GmbH, Vienna<br />
Café+co Rus, ZAO, Moscow (RU)<br />
CAFE+CO Timisoara S.R.L, Timisoara (RO)<br />
C - Holding s.r.o., Modřice (CZ)<br />
Conrad GmbH Mehlgroßhandel, Neunkirchen (D)<br />
‘CREMBS’ Hotelbetriebsgesellschaft m.b.H., Krems<br />
DELIKOMAT d.o.o., Belgrade (RS)<br />
DELIKOMAT d.o.o., Tomislavgrad (BA)<br />
DELIKOMAT d.o.o., Zagreb (HR)<br />
Delikomat Slovensko spol. s.r.o., Bratislava (SK)<br />
Diana Slovakia spol. s.r.o., Bratislava (SK)<br />
Dritte Biogas Falkenhagen Betriebs GmbH & Co. KG, Regensburg (D)<br />
Echion Projektentwicklungs GmbH, Vienna<br />
‘ELIGIUS’ Holding GmbH, Vienna<br />
Erste Biogas Falkenhagen Betriebs GmbH & Co. KG, Regensburg (D)<br />
‘EUSEBIO’ Beteiligungs GmbH, Vienna<br />
Farina Marketing d.o.o., Ljubljana (SI)<br />
Fünfte Biogas Falkenhagen Betriebs GmbH & Co. KG, Regensburg (D)<br />
Gesundheitspark St. Pölten Errichtungs- und Betriebs GmbH, Vienna<br />
‘GULBIS’ Beteiligungs GmbH, Vienna<br />
Haldenhof Liegenschaftsverwaltungs- und -verwertungsges.m.b.H., Vienna<br />
HEFRA solarpark development s.r.o., Lipová (CZ)<br />
‘HELANE’ Beteiligungs GmbH, Vienna<br />
Holz- und Energiepark Vitis GmbH, Vienna<br />
Intech Vertriebsgesellschaft mbH, Hamburg (D)<br />
Internationales Reisebüro Primus-GmbH in Liqu., Vienna<br />
Kampffmeyer Food Innovation Polska Sp. z.o.o., Poznań (PL)<br />
Kasernen Immobilienerrichtungsgesellschaft mbH, Vienna<br />
KASERNEN Projektentwicklungs- und Beteiligungs GmbH, Vienna<br />
‘MAURA’ Immobilien GmbH, Vienna<br />
MID 5 Holding GmbH, Vienna<br />
Müfa Mehl und Backbedarf Handelsgesellschaft mbH, Hamburg (D)<br />
101
102<br />
Neue Marktgasse Einkaufspassage Stockerau GmbH, Vienna<br />
Neuß & Wilke GmbH, Gelsenkirchen (D)<br />
PBS Immobilienholding GmbH, Vienna<br />
PBS Immobilienprojektentwicklungs GmbH, Vienna<br />
‘PINUS’ Liegenschaftsverwaltungs GmbH, Vienna<br />
Raiffeisen Analytik GmbH, Vienna<br />
Raiffeisen-Fachmarktzentrum SIEBEN GmbH, Vienna<br />
Raiffeisen-Fachmarktzentrum VIER GmbH, Vienna<br />
Raiffeisen-Fachmarktzentrum ZWEI GmbH, Vienna<br />
RAIFFEISEN IMMOBILIEN VERMITTLUNG GES.M.B.H., Vienna<br />
Raiffeisen-Reisebüro Gesellschaft m.b.H., Vienna<br />
Raiffeisen Vorsorgewohnungserrichtungs GmbH, Vienna<br />
RENERGIE Bad Schmiedeberg GmbH & Co. KG, Wetterzeube OT Trebnitz (D)<br />
RÉNERGIE Bioplyn Slusovice spol. s.r.o., Slušovice (CZ)<br />
RENERGIE Carbex Trade GmbH, Vienna<br />
RENERGIE Carbon GmbH, Vienna<br />
RENERGIE Dorf Mecklenburg GmbH & Co. KG, Wetterzeube OT Trebnitz (D)<br />
RENERGIE Elsterwerda GmbH & Co. KG, Wetterzeube OT Trebnitz (D)<br />
RENERGIE green solutions GmbH, Wetterzeube (D)<br />
RENERGIE green solutions Management GmbH, Wetterzeube, OT Trebnitz (D)<br />
RENERGIE Korgau GmbH, Wetterzeube OT Trebnitz (D)<br />
RENERGIE Lübars GmbH & Co. KG, Wetterzeube OT Trebnitz (D)<br />
RENERGIE Raiffeisen Managementgesellschaft für erneuerbare Energie GmbH, Vienna<br />
RENERGIE Trebnitz GmbH & Co. KG, Wetterzeube OT Trebnitz (D)<br />
RENERGIE Vehlgast GmbH & Co. KG, Wetterzeube OT Trebnitz (D)<br />
R-FMZ ‘MERCATUS’ Holding GmbH, Vienna<br />
RLB Businessconsulting GmbH, Vienna<br />
ROLLEGG Liegenschaftsverwaltungs GmbH, Vienna<br />
‘RUFUS’ Beteiligungs GmbH, Vienna<br />
‘SANSARA’ Holding GmbH, Vienna<br />
Schöpferstrasse Projektentwicklung GmbH, Vienna<br />
‘SERET’ Beteiligungs GmbH, Vienna<br />
‘SEVERUS’ Beteiligungs GmbH, Vienna<br />
snack+co GmbH, Vienna<br />
Steinmetz-Mehl Vertriebsgesellschaft Süd GmbH, Aalen (D)<br />
St. Hippolyt Beteiligungs-GmbH, Vienna<br />
TECHBASE Science Park Vienna GmbH, Vienna<br />
Techno-Park Tulln GmbH, <strong>Wien</strong>er Neudorf<br />
THE AUTHENTIC ETHNIC FOOD COMPANY GmbH, Gelsenkirchen (D)<br />
Theranda Entwicklungsgenossenschaft für den Kosovo registrierte Genossenschaft mit beschränkter Haftung, Vienna<br />
TIONE Altbau-Entwicklung GmbH, Vienna<br />
TOP-CUP Deutschland office-coffee Service GmbH, Regensburg (D)<br />
Vierte Biogas Falkenhagen Betriebs GmbH & Co. KG, Regensburg (D)<br />
VivaNatur Mühle West GmbH, Grevenbroich (D)<br />
WALDSANATORIUM PERCHTOLDSDORF GmbH, Salzburg<br />
Waldviertel Immobilien-Vermittlung GmbH, Zwettl<br />
wertCorn GmbH Getreidespezialitäten, Hameln (D)<br />
ZEG Immobilien- und Beteiligungs registrierte Genossenschaft mit beschränkter Haftung, Vienna<br />
Zweite Biogas Falkenhagen Betriebs GmbH & Co. KG, Regensburg (D)
Boards and Officers<br />
MANAGING BOARD:<br />
Chairman:<br />
Erwin HAMESEDER<br />
Deputy Chairman:<br />
Georg KRAFT-KINZ<br />
(since 1 May 2010; previously an ordinary member of<br />
the Managing Board)<br />
Members:<br />
Reinhard KARL<br />
Michael RAB<br />
Gerhard REHOR<br />
SUPERVISORY BOARD:<br />
Chairman:<br />
Christian KONRAD<br />
Deputy Chairman:<br />
Johann VIEGHOFER<br />
Members:<br />
Anton BODENSTEIN<br />
Franz HUBINGER (to 7 May 2010)<br />
Alfons NEUMAYER<br />
Johann PLACHWITZ<br />
Gerhard PREISS<br />
Christian RESCH<br />
Brigitte SOMMERBAUER (since 7 May 2010)<br />
Staff Council delegates:<br />
Johann AMON<br />
Anton HECHTL<br />
Michael HOFER<br />
Sibylla WACHSLER<br />
State commissioners:<br />
Alfred LEJSEK<br />
Silvia ZENDRON (to 28 February 2010)<br />
Bernhard MAZEGGER (since 1 March 2010)<br />
103
104<br />
The Managing Board of RLB NÖ-<strong>Wien</strong> completed these Consolidated Financial Statements on 21 March 2011 in<br />
accordance with the provisions of the International Financial <strong>Report</strong>ing Standards (IFRSs) as adopted by the European<br />
Union. The provisions of enterprise law that were, in addition, applicable under § 245a UGB in conjunction with<br />
§ 59a BWG were taken into account. The Group Management <strong>Report</strong> was prepared in accordance with the provisions<br />
of Austrian enterprise law and is consistent with the Consolidated Financial Statements.<br />
Deputy CEO<br />
Georg KRAFT-KINZ<br />
Member<br />
Gerhard REHOR<br />
The Managing Board<br />
CEO<br />
Erwin HAMESEDER<br />
Member<br />
Reinhard KARL<br />
Member<br />
Michael RAB<br />
The Managing Board released the Consolidated Financial Statements for submission to the Supervisory Board on<br />
21 March 2011.
DECLARATION BY THE MANAGING BAORD<br />
We declare that, to the best of our knowledge, the Consolidated Financial Statements prepared in accordance with<br />
the applicable financial reporting standards present fairly, in all material respects, the assets, liabilities, financial position<br />
and profit or loss of the RLB NÖ-<strong>Wien</strong> Group; the Group Management <strong>Report</strong> presents the business performance,<br />
business results and position of the RLB NÖ-<strong>Wien</strong> Group in such a way that it presents fairly, in all material<br />
respects, the assets, liabilities, financial position and profit or loss of the Group; and the Group Management <strong>Report</strong><br />
describes the material risks and uncertainties to which the Group is exposed.<br />
Vienna<br />
21 March 2011<br />
The Managing Board<br />
Erwin HAMESEDER<br />
CEO<br />
Responsible for Raiffeisen Banks and Management Services<br />
Georg KRAFT-KINZ<br />
Deputy CEO<br />
Responsible for<br />
Personal and Business Banking Customers<br />
Gerhard REHOR<br />
Member<br />
Responsible for<br />
Financial Markets<br />
Reinhard KARL<br />
Member<br />
Responsible for<br />
Corporate Customers<br />
Michael RAB<br />
Member<br />
Responsible for<br />
Risk Management and Organization<br />
105
106<br />
AUDITOR’S REPORT<br />
<strong>Report</strong> on the Consolidated Financial Statements<br />
We have audited the accompanying consolidated financial statements of<br />
RAIFFEISENLANDESBANK NIEDERÖSTERREICH-WIEN AG,<br />
Vienna, Austria,<br />
for the year from 1 January to 31 December 2010. These consolidated financial statements comprise the consolidated balance sheet<br />
as of 31 December 2010, the consolidated statement of comprehensive income, the consolidated cash flow statement and the consolidated<br />
statement of changes in equity for the year ended 31 December 2010 and a summery of significant accounting policies and<br />
other explanatory notes.<br />
MANAGEMENT’S RESPONSIBILITY FOR THE CONSOLIDATED FINANCIAL STATEMENTS AND FOR THE<br />
ACCOUNTING SYSTEM<br />
The Company’s management is responsible for the group accounting system and for the preparation and fair presentation of these<br />
consolidated financial statements in accordance with the International Financial <strong>Report</strong>ing Standards (IFRSs) as adopted by the<br />
EU. This responsibility includes: designing, implementing and maintaining internal control relevant to the preparation and fair<br />
presentation of the consolidated financial statements that are free from material misstatement, whether due to fraud or error;<br />
selecting and applying appropriate accounting policies; and making accounting estimates that are reasonable in the circumstances.<br />
AUDITOR'S RESPONSIBILITY AND DESCRIPTION OF TYPE AND SCOPE OF THE STATUTORY AUDIT<br />
Our responsibility is to express an opinion on these consolidated financial statements based on our audit. We conducted our audit<br />
in accordance with laws and regulations applicable in Austria as well as in accordance with International Standards on Auditing,<br />
issued by the International Auditing and Assurance Standards Board (IAASB) of the International Federation of Accountants<br />
(IFAC). Those standards require that we comply with professional guidelines and that we plan and perform the audit to obtain<br />
reasonable assurance about whether the consolidated financial statements are free from material misstatement.<br />
An audit involves performing procedures to obtain audit evidence about the amounts and disclosures in the consolidated financial<br />
statements. The procedures selected depend on the auditor's judgment, including the assessment of the risks of material misstatement<br />
of the consolidated financial statements, whether due to fraud or error. In making those risk assessments, the auditor considers<br />
internal control relevant to the Group’s preparation and fair presentation of the consolidated financial statements in order to<br />
design audit procedures that are appropriate in the circumstances, but not for the purpose of expressing an opinion on the effectiveness<br />
of the Group’s internal control. An audit also includes evaluating the appropriateness of accounting policies used and the<br />
reasonableness of accounting estimates made by management, as well as evaluating the overall presentation of the consolidated<br />
financial statements.<br />
We believe that the audit evidence we have obtained is sufficient and appropriate to provide a basis for our audit opinion.
OPINION<br />
Our audit did not give rise to any objections. In our opinion, which is based on the results of our audit, the consolidated financial<br />
statements comply with legal requirements and give a true and fair view of the financial position of the Group as of 31 December<br />
2010 and of its financial performance and its cash flows for the year from 1 January to 31 December 2010 in accordance with International<br />
Financial <strong>Report</strong>ing Standards (IFRSs) as adopted by the EU.<br />
REPORT ON THE MANAGEMENT REPORT FOR THE GROUP<br />
Pursuant to statutory provisions, the management report for the Group is to be audited as to whether it is consistent with the<br />
consolidated financial statements and as to whether the other disclosures are not misleading with respect to the Company’s position.<br />
The auditor’s report also has to contain a statement as to whether the management report for the Group is consistent with<br />
the consolidated financial statements and whether the disclosures pursuant to § 243a UGB (Austrian Commercial Code) are appropriate<br />
In our opinion, the management report for the Group is consistent with the consolidated financial statements. The disclosures<br />
pursuant to § 243a UGB (Austrian Commercial Code) are appropriate.<br />
Vienna<br />
21 March 2011<br />
As the Auditors appointed by Österreichischer Raiffeisenverband:<br />
Verband Auditor KPMG Austria GmbH<br />
Wirtschaftsprüfungs- und Steuerberatungsgesellschaft<br />
Christian Loicht<br />
Wirtschaftsprüfer<br />
Signed by:<br />
Wilhelm Kovsca<br />
Wirtschaftsprüfer<br />
(Austrian Chartered Accountants)<br />
This report is a translation of the original report in German, which is solely valid.<br />
Franz Frauwallner<br />
Wirtschaftsprüfer<br />
107
108<br />
GLOSSARY<br />
Basis of assessment – The risk-weighted basis of assessment<br />
within the meaning of § 22 BWG (see Riskweighted<br />
assets).<br />
BWG – [Austrian] federal banking act (Bankwesengesetz).<br />
Clean price – The price of an interest rate instrument<br />
without accrued interest.<br />
Dirty price – The price of an interest rate instrument plus<br />
accrued interest.<br />
Entities accounted for using the equity method – Entities<br />
over whose operating or financial policies an investor<br />
has a significant influence.<br />
Fair value – The amount for which an asset could be<br />
exchanged, or a liability settled, between knowledgeable,<br />
willing parties in an arm’s length transaction.<br />
Hedge – A transaction that reduces the risk (e.g. price<br />
or interest rate risk) on an already existing or future<br />
position.<br />
IFRIC, SIC – International Financial <strong>Report</strong>ing Interpretation<br />
Committee: Interpreter of the International Financial<br />
<strong>Report</strong>ing Standards; formerly also called SIC (Standing<br />
Interpretations Committee).<br />
IFRSs, IASs – The International Financial <strong>Report</strong>ing<br />
Standards and International Accounting Standards are<br />
reporting standards issued by the IASB (International<br />
Accounting Standards Board) with the goal of achieving<br />
transparent and comparable accounting on an international<br />
basis.<br />
Loan exposure – Loan exposures comprise all onbalance<br />
sheet exposures (loans and advances, bonds)<br />
and off-balance sheet exposures (guarantees, credit<br />
lines).<br />
Own funds ratio – This ratio’s numerator is eligible own<br />
funds within the meaning of BWG and its denominator is<br />
the basis of assessment pursuant to § 22 BWG.<br />
Own funds within the meaning of BWG – These are<br />
made up of Tier 1 capital, supplementary and subordinated<br />
debt capital (Tier 2) and short-term subordinated<br />
debt capital and reclassified Tier 2 capital (Tier 3).<br />
Risk:earnings ratio – The impairment charge on loans<br />
and advances in relation to net interest income.<br />
Risk-weighted assets – The total of the assets, offbalance<br />
sheet items and special off-balance sheet items<br />
in the banking book weighted according to business<br />
and/or counterparty risk, determined in accordance with<br />
the Austrian Bankwesengesetz (banking act).<br />
Tier 1 capital – Paid-in capital and reserves less intangible<br />
assets and balance-sheet losses as well as material<br />
losses during the current financial year.<br />
Tier 1 ratio – This ratio’s numerator is Tier 1 capital and<br />
its denominator is the basis of assessment for the purposes<br />
of § 22 BWG.<br />
UGB – Unternehmensgesetzbuch: Austrian enterprises<br />
code.<br />
VaR – Value at risk expresses the potential loss that will,<br />
with a 99 per cent probability, not be exceeded in the<br />
portfolio in question within the specified holding period.
INFORMATION IN THE INTERNET<br />
<strong>Raiffeisenlandesbank</strong> <strong>Niederösterreich</strong>-<strong>Wien</strong>’s website provides detailed, up-to-date information about Raiffeisen at<br />
www.raiffeisenbank.at<br />
PUBLICATION DETAILS<br />
Published by:<br />
<strong>Raiffeisenlandesbank</strong> <strong>Niederösterreich</strong>-<strong>Wien</strong> AG<br />
Friedrich-Wilhelm-Raiffeisen-Platz 1, A-1020 Vienna, Austria<br />
Phone: +43-5-1700; Fax: +43-5-1700-901<br />
www.raiffeisenbank.at, info@raiffeisenbank.at<br />
Publication Officer:<br />
Michaela Stefan<br />
IFRS-compliant Consolidated Financial Statements:<br />
Editing and coordination:<br />
Accounts and Controlling at RLB NÖ-<strong>Wien</strong><br />
Reinhold Grossebner and his team<br />
Typesetting: Produced in-house using FIRE.sys, Michael Konrad GmbH, Frankfurt<br />
Translated by Adrian Weisweiller BA (Oxon), MA (Oxon), London<br />
The translation of the Auditors’ <strong>Report</strong> was provided by the Auditors.<br />
Orders:<br />
Elfriede Duda, Press Office<br />
<strong>Raiffeisenlandesbank</strong> <strong>Niederösterreich</strong>-<strong>Wien</strong> AG<br />
Friedrich-Wilhelm-Raiffeisen-Platz 1, A-1020 Vienna, Austria<br />
Phone: +43-1-21 136-2466<br />
Copy deadline:<br />
4 April 2011<br />
Enquiries should be addressed to RLB NÖ-<strong>Wien</strong>’s Press Office at the above address.<br />
Note and Disclaimer:<br />
Certain market participants tend to attempt to derive claims from statements regarding expected future developments and assert those<br />
claims in court. Because of the rare but serious effects of such actions on the company concerned and on its equity holders, many<br />
companies keep statements about their expectations regarding future developments to the mandatory minimum required by legislation.<br />
However, the RLB NÖ-<strong>Wien</strong> Group does not see the publication of its financial reports merely as a duty. It would also like to use them as<br />
an opportunity for open communication. To ensure that this will continue to be possible, we stress the following: The forecasts, plans and<br />
forward-looking statements contained in this <strong>Report</strong> are based on the RLB NÖ-<strong>Wien</strong> Group’s state of knowledge and assessments at the<br />
time of its preparation. Like all forward-looking statements, they are subject to risks and uncertainties that could cause actual results to<br />
differ substantially from those being predicted. No guarantee can be given that forecasts, planned values and forward-looking statements<br />
will actually prove accurate. We prepared this financial report with the greatest possible care and checked the data. Nonetheless, we<br />
cannot rule out rounding, transmission, typesetting or printing errors. This <strong>Report</strong> was written in German. The English report is a translation<br />
of the German report. The German version is the only authentic version.<br />
109