

STRIVE - Environmental Protection Agency
STRIVE - Environmental Protection Agency
STRIVE - Environmental Protection Agency

Create successful ePaper yourself
Turn your PDF publications into a flip-book with our unique Google optimized e-Paper software.
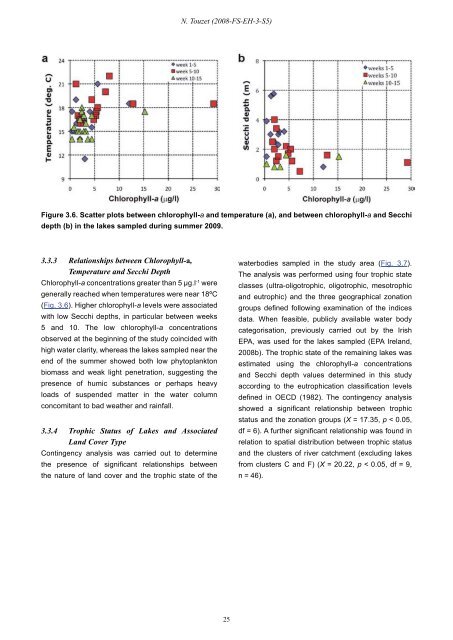
3.3.3 Relationships between Chlorophyll-a,<br />
Temperature and Secchi Depth<br />
Chlorophyll-a concentrations greater than 5 µg.l-1 were<br />
generally reached when temperatures were near 18ºC<br />
(Fig. 3.6). Higher chlorophyll-a levels were associated<br />
with low Secchi depths, in particular between weeks<br />
5 and 10. The low chlorophyll-a concentrations<br />
observed at the beginning of the study coincided with<br />
high water clarity, whereas the lakes sampled near the<br />
end of the summer showed both low phytoplankton<br />
biomass and weak light penetration, suggesting the<br />
presence of humic substances or perhaps heavy<br />
loads of suspended matter in the water column<br />
concomitant to bad weather and rainfall.<br />
N. Touzet (2008-FS-EH-3-S5)<br />
Figure 3.6. Scatter plots between chlorophyll-a and temperature (a), and between chlorophyll-a and Secchi<br />
depth (b) in the lakes sampled during summer 2009.<br />
3.3.4 Trophic Status of Lakes and Associated<br />
Land Cover Type<br />
Contingency analysis was carried out to determine<br />
the presence of significant relationships between<br />
the nature of land cover and the trophic state of the<br />
25<br />
waterbodies sampled in the study area (Fig. 3.7).<br />
The analysis was performed using four trophic state<br />
classes (ultra-oligotrophic, oligotrophic, mesotrophic<br />
and eutrophic) and the three geographical zonation<br />
groups defined following examination of the indices<br />
data. When feasible, publicly available water body<br />
categorisation, previously carried out by the Irish<br />
EPA, was used for the lakes sampled (EPA Ireland,<br />
2008b). The trophic state of the remaining lakes was<br />
estimated using the chlorophyll-a concentrations<br />
and Secchi depth values determined in this study<br />
according to the eutrophication classification levels<br />
defined in OECD (1982). The contingency analysis<br />
showed a significant relationship between trophic<br />
status and the zonation groups (X = 17.35, p < 0.05,<br />
df = 6). A further significant relationship was found in<br />
relation to spatial distribution between trophic status<br />
and the clusters of river catchment (excluding lakes<br />
from clusters C and F) (X = 20.22, p < 0.05, df = 9,<br />
n = 46).


