

STRIVE - Environmental Protection Agency
STRIVE - Environmental Protection Agency
STRIVE - Environmental Protection Agency

You also want an ePaper? Increase the reach of your titles
YUMPU automatically turns print PDFs into web optimized ePapers that Google loves.
Molecular Diversity and Dynamics of Toxigenic Blue-green Algae in Irish Lakes<br />
3.6 Cyanotoxins Detection in West and<br />
Northwest Irish Lakes<br />
3.6.1 Detection of Cyanotoxin Genes in Field<br />
Samples<br />
The nucleic acid extracts obtained from the lakes<br />
sampled were subject to PCR analysis to determine<br />
the presence of toxigenic cyanobacteria potentially<br />
synthesising cyanotoxins. PCR products were<br />
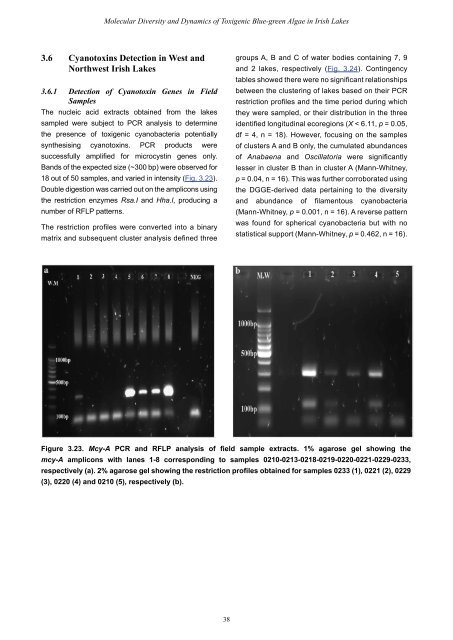
successfully amplified for microcystin genes only.<br />
Bands of the expected size (~300 bp) were observed for<br />
18 out of 50 samples, and varied in intensity (Fig. 3.23).<br />
Double digestion was carried out on the amplicons using<br />
the restriction enzymes Rsa.I and Hha.l, producing a<br />
number of RFLP patterns.<br />
The restriction profiles were converted into a binary<br />
matrix and subsequent cluster analysis defined three<br />
38<br />
groups A, B and C of water bodies containing 7, 9<br />
and 2 lakes, respectively (Fig. 3.24). Contingency<br />
tables showed there were no significant relationships<br />
between the clustering of lakes based on their PCR<br />
restriction profiles and the time period during which<br />
they were sampled, or their distribution in the three<br />
identified longitudinal ecoregions (X < 6.11, p = 0.05,<br />
df = 4, n = 18). However, focusing on the samples<br />
of clusters A and B only, the cumulated abundances<br />
of Anabaena and Oscillatoria were significantly<br />
lesser in cluster B than in cluster A (Mann-Whitney,<br />
p = 0.04, n = 16). This was further corroborated using<br />
the DGGE-derived data pertaining to the diversity<br />
and abundance of filamentous cyanobacteria<br />
(Mann-Whitney, p = 0.001, n = 16). A reverse pattern<br />
was found for spherical cyanobacteria but with no<br />
statistical support (Mann-Whitney, p = 0.462, n = 16).<br />
Figure 3.23. Mcy-A PCR and RFLP analysis of field sample extracts. 1% agarose gel showing the<br />
mcy-A amplicons with lanes 1-8 corresponding to samples 0210-0213-0218-0219-0220-0221-0229-0233,<br />
respectively (a). 2% agarose gel showing the restriction profiles obtained for samples 0233 (1), 0221 (2), 0229<br />
(3), 0220 (4) and 0210 (5), respectively (b).


