

STRIVE - Environmental Protection Agency
STRIVE - Environmental Protection Agency
STRIVE - Environmental Protection Agency

Create successful ePaper yourself
Turn your PDF publications into a flip-book with our unique Google optimized e-Paper software.
Figure 3.32. Scatter plot showing the correlation<br />
between DNA extract and chlorophyll-a<br />
concentrations for samples collected in Lough<br />
Corrib (circle) and Ballyquirke Lough (triangle).<br />
However, the nucleic acid extract concentrations<br />
were on average significantly greater in Lough Ballyquirke<br />
than in Lough Corrib (Student t-test, p < 0.010). This<br />
reflected the chlorophyll-a concentrations determined<br />
for the corresponding samples in both lakes as there<br />
was an overall significant positive correlation between<br />
chlorophyll-a and nucleic acid concentrations (Pearson<br />
correlation coefficient = 0.741, p < 0.001, n = 26)<br />
(Fig. 3.32).<br />
A region of the 16S rDNA gene was amplified using<br />
a nested PCR approach and two reverse primers<br />
N. Touzet (2008-FS-EH-3-S5)<br />
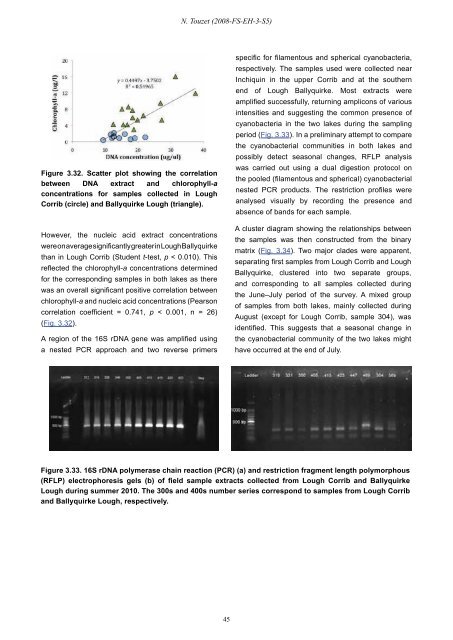
Figure 3.33. 16S rDNA polymerase chain reaction (PCR) (a) and restriction fragment length polymorphous<br />
(RFLP) electrophoresis gels (b) of field sample extracts collected from Lough Corrib and Ballyquirke<br />
Lough during summer 2010. The 300s and 400s number series correspond to samples from Lough Corrib<br />
and Ballyquirke Lough, respectively.<br />
45<br />
specific for filamentous and spherical cyanobacteria,<br />
respectively. The samples used were collected near<br />
Inchiquin in the upper Corrib and at the southern<br />
end of Lough Ballyquirke. Most extracts were<br />
amplified successfully, returning amplicons of various<br />
intensities and suggesting the common presence of<br />
cyanobacteria in the two lakes during the sampling<br />
period (Fig. 3.33). In a preliminary attempt to compare<br />
the cyanobacterial communities in both lakes and<br />
possibly detect seasonal changes, RFLP analysis<br />
was carried out using a dual digestion protocol on<br />
the pooled (filamentous and spherical) cyanobacterial<br />
nested PCR products. The restriction profiles were<br />
analysed visually by recording the presence and<br />
absence of bands for each sample.<br />
A cluster diagram showing the relationships between<br />
the samples was then constructed from the binary<br />
matrix (Fig. 3.34). Two major clades were apparent,<br />
separating first samples from Lough Corrib and Lough<br />
Ballyquirke, clustered into two separate groups,<br />
and corresponding to all samples collected during<br />
the June–July period of the survey. A mixed group<br />
of samples from both lakes, mainly collected during<br />
August (except for Lough Corrib, sample 304), was<br />
identified. This suggests that a seasonal change in<br />
the cyanobacterial community of the two lakes might<br />
have occurred at the end of July.


