Geomagnetic secular variation anomalies investigated through ... - IGU
Geomagnetic secular variation anomalies investigated through ... - IGU
Geomagnetic secular variation anomalies investigated through ... - IGU

Create successful ePaper yourself
Turn your PDF publications into a flip-book with our unique Google optimized e-Paper software.
P.B.Gawali et al.<br />
pattern of ”T differences observed in fig. 3 may be<br />
because of some manifestation of stress and tension<br />
<strong>variation</strong>s due to geodynamic processes and anomalous<br />
movements of crustal blocks with Mahakoshal belt,<br />
Satpura horst and graben like structures of the<br />
Narmada fault systems. Moreover, it is interesting to<br />
note that along this profile Satpura electrical<br />
conductivity anomaly (SCA) was characterized by<br />
conductivity 0.2 S/m (resistivity 5 Ohm-m)<br />
<strong>investigated</strong> by <strong>Geomagnetic</strong> Depth Sounding (GDS)<br />
method (Arora, Waghmare & Mahashabde 1995;<br />
Waghmare 2003). This conductivity anomaly was<br />
interpreted due to the fluids/saline water in the deep<br />
crust of Jabalpur-Mandla area. The inter-cavity porous<br />
68<br />
fluids of the rocks generate the electric currents which<br />
are responsible for the Satpura conductor. There is<br />
also a possibility that the fluids flow can produce<br />
electrokinetic effect which has contributed to the<br />
<strong>secular</strong> <strong>variation</strong> of the total geomagnetic field along<br />
the AA’ profile. Coincident deep reflector/refractor<br />
studies in Central India have shown presence of upper<br />
and lower crustal low-velocity layers. These low<br />
velocity layers, high heat flow, hot springs, significant<br />
reflectivity character north and south of Central India<br />
suture and seismic activities in Central India strongly<br />
suggest neo-tectonic activity in the region, including<br />
along the horst structure between Katangi and<br />
Jabalpur (Reddy, Sain & Murty 1997).<br />
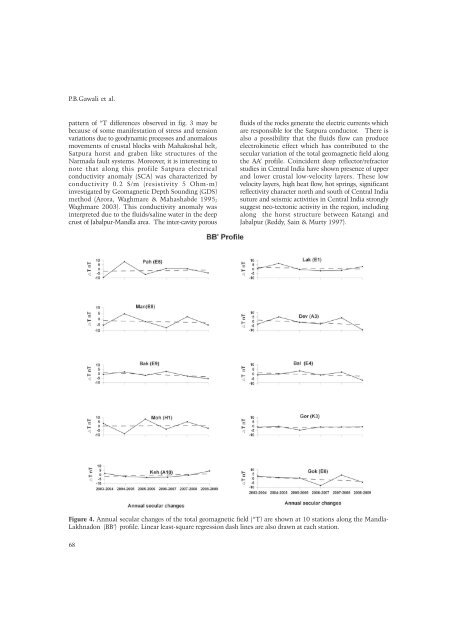
Figure 4. Annual <strong>secular</strong> changes of the total geomagnetic field (“T) are shown at 10 stations along the Mandla-<br />
Lakhnadon (BB’) profile. Linear least-square regression dash lines are also drawn at each station.