Geomagnetic secular variation anomalies investigated through ... - IGU
Geomagnetic secular variation anomalies investigated through ... - IGU
Geomagnetic secular variation anomalies investigated through ... - IGU

Create successful ePaper yourself
Turn your PDF publications into a flip-book with our unique Google optimized e-Paper software.
J. Ind. Geophys. Union ( April 2011 )<br />
Vol.15, No.2, pp.61-76<br />
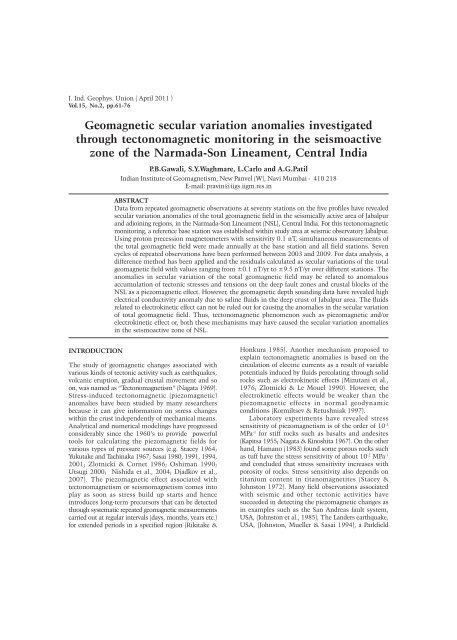
<strong>Geomagnetic</strong> <strong>secular</strong> <strong>variation</strong> <strong>anomalies</strong> <strong>investigated</strong><br />
<strong>through</strong> tectonomagnetic monitoring in the seismoactive<br />
zone of the Narmada-Son Lineament, Central India<br />
INTRODUCTION<br />
P.B.Gawali, S.Y.Waghmare, L.Carlo and A.G.Patil<br />
Indian Institute of Geomagnetism, New Panvel (W), Navi Mumbai - 410 218<br />
E-mail: pravin@iigs.iigm.res.in<br />
ABSTRACT<br />
Data from repeated geomagnetic observations at seventy stations on the five profiles have revealed<br />
<strong>secular</strong> <strong>variation</strong> <strong>anomalies</strong> of the total geomagnetic field in the seismically active area of Jabalpur<br />
and adjoining regions, in the Narmada-Son Lineament (NSL), Central India. For this tectonomagnetic<br />
monitoring, a reference base station was established within study area at seismic observatory Jabalpur.<br />
Using proton precession magnetometers with sensitivity 0.1 nT, simultaneous measurements of<br />
the total geomagnetic field were made annually at the base station and all field stations. Seven<br />
cycles of repeated observations have been performed between 2003 and 2009. For data analysis, a<br />
difference method has been applied and the residuals calculated as <strong>secular</strong> <strong>variation</strong>s of the total<br />
geomagnetic field with values ranging from ±0.1 nT/yr to ±9.5 nT/yr over different stations. The<br />
<strong>anomalies</strong> in <strong>secular</strong> <strong>variation</strong> of the total geomagnetic field may be related to anomalous<br />
accumulation of tectonic stresses and tensions on the deep fault zones and crustal blocks of the<br />
NSL as a piezomagnetic effect. However, the geomagnetic depth sounding data have revealed high<br />
electrical conductivity anomaly due to saline fluids in the deep crust of Jabalpur area. The fluids<br />
related to electrokinetic effect can not be ruled out for causing the <strong>anomalies</strong> in the <strong>secular</strong> <strong>variation</strong><br />
of total geomagnetic field. Thus, tectonomagnetic phenomenon such as piezomagnetic and/or<br />
electrokinetic effect or, both these mechanisms may have caused the <strong>secular</strong> <strong>variation</strong> <strong>anomalies</strong><br />
in the seismoactive zone of NSL.<br />
The study of geomagnetic changes associated with<br />
various kinds of tectonic activity such as earthquakes,<br />
volcanic eruption, gradual crustal movement and so<br />
on, was named as “Tectonomagnetism” (Nagata 1969).<br />
Stress-induced tectonomagnetic (piezomagnetic)<br />
<strong>anomalies</strong> have been studied by many researchers<br />
because it can give information on stress changes<br />
within the crust independently of mechanical means.<br />
Analytical and numerical modelings have progressed<br />
considerably since the 1960’s to provide powerful<br />
tools for calculating the piezomagnetic fields for<br />
various types of pressure sources (e.g. Stacey 1964;<br />
Yukutake and Tachinaka 1967; Sasai 1980, 1991, 1994,<br />
2001; Zlotnicki & Cornet 1986; Oshiman 1990;<br />
Utsugi 2000; Nishida et al., 2004; Djadkov et al.,<br />
2007). The piezomagnetic effect associated with<br />
tectonomagnetism or seismomagnetism comes into<br />
play as soon as stress build up starts and hence<br />
introduces long-term precursors that can be detected<br />
<strong>through</strong> systematic repeated geomagnetic measurements<br />
carried out at regular intervals (days, months, years etc.)<br />
for extended periods in a specified region (Rikitake &<br />
Honkura 1985). Another mechanism proposed to<br />
explain tectonomagnetic <strong>anomalies</strong> is based on the<br />
circulation of electric currents as a result of variable<br />
potentials induced by fluids percolating <strong>through</strong> solid<br />
rocks such as electrokinetic effects (Mizutani et al.,<br />
1976; Zlotnicki & Le Mouel 1990). However, the<br />
electrokinetic effects would be weaker than the<br />
piezomagnetic effects in normal geodynamic<br />
conditions (Kormiltsev & Retushniak 1997).<br />
Laboratory experiments have revealed stress<br />
sensitivity of piezomagnetism is of the order of 10 -3<br />
MPa -1 for stiff rocks such as basalts and andesites<br />
(Kapitsa 1955; Nagata & Kinoshita 1967). On the other<br />
hand, Hamano (1983) found some porous rocks such<br />
as tuff have the stress sensitivity of about 10 -2 MPa -1<br />
and concluded that stress sensitivity increases with<br />
porosity of rocks. Stress sensitivity also depends on<br />
titanium content in titanomagnetites (Stacey &<br />
Johnston 1972). Many field observations associated<br />
with seismic and other tectonic activities have<br />
succeeded in detecting the piezomagnetic changes as<br />
in examples such as the San Andreas fault system,<br />
USA, (Johnston et al., 1985), The Landers earthquake,<br />
USA, (Johnston, Mueller & Sasai 1994), a Parkfield
P.B.Gawali et al.<br />
fault model, USA, (Stuart et al., 1995), Izu Peninsula<br />
earthquake, central Japan (Sasai & Ishikawa 1997) and<br />
so on. In some cases, however, tectonic activity failed<br />
to generate expected magnetic changes (Sasai &<br />
Ishikawa 1980).<br />
A number of earthquakes of various magnitudes<br />
(M) on Richter scale have occurred in the past with<br />
epicenters in and around Jabalpur. Some of these are<br />
1846 (6.5 M), 1903 (4.7 M), 1973 (3.7 M), 1993 (3.8<br />
M), 1997 (6.0 M) and 2000 (5.2 M) as reported by India<br />
Meteorological Department (1998) and Pimprikar &<br />
Devarajan (2003). Jabalpur area has been known for<br />
its seismic activity for a long time, because of which<br />
a project entitled “Tectonomagnetic study in Jabalpur-<br />
Kosamghat and adjoining areas in Central India” was<br />
launched by Indian Institute of Geomagnetism (IIG),<br />
Navi Mumbai, in 2002.<br />
TECTONIC STRUCTURE AND GEOPHYSICAL<br />
INVESTIGATIONS IN NSL<br />
Molnar, Kunangyi & Liang (1987) reported the<br />
northeast drift rate of India plate and southeast flow<br />
of the Tibetan plateau to be of the same order, i.e. 18<br />
± 7 mm/year. The tectonic background of Central<br />
Indian region is greatly influenced by the east-west<br />
trending NSL, which is a conspicuous linear tectonic<br />
feature about 1600 km long extending towards Murray<br />
ridge (Arabian Sea) and the eastern syntaxial bend of<br />
Himalayas (Mishra 1977). This feature is invariably<br />
visualized as a continental rift reactivated since<br />
Precambrian times (Choubey 1971). In contrast,<br />
Ghosh (1976) has considered the Narmada-Son<br />
lineament as representing an erosional post - Deccan<br />
Trap Narmada valley formed at the crest of a domal<br />
upwarp. The faults bounding the Narmada zone are<br />
believed to have played a significant role in deposition<br />
of the Vindhyan (Meso-Neoproterozoic) sediments on<br />
the northern side and Gondwana (Permo-<br />
Carboniferous) sediments on the southern side of<br />
Narmada zone. West (1962) concluded that the land<br />
masses on either side of the lineament must have<br />
undergone relative vertical movement several times<br />
during the geological past. The boundary faults<br />
limiting this zone have been identified to the east of<br />
76 o E, as Narmada north and Narmada south fault<br />
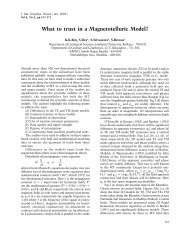
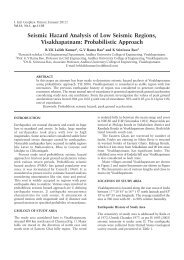
(Jain, Nair & Yedekar 1995). Major cities and towns<br />
along with geological and tectonic background of the<br />
NSL are shown in Fig.1<br />
During the past few decades, several geophysical<br />
studies have been undertaken along this major<br />
lineament. Qureshy (1964) made qualitative studies<br />
of gravity <strong>anomalies</strong> along the lineament and<br />
concluded that the Satpura ranges in the western parts<br />
62<br />
(associated with gravity high) represent a horst-type<br />
structure. The Bouguer gravity high suggests copious<br />
high-density material in lower crust, which might be<br />
the result of large-scale asthenospheric upwelling and<br />
basic intrusions along Moho, and in the crust. The<br />
large scale asthenospheric upwelling south of Narmada<br />
appears to be related to several rift systems of these<br />
regions such as Tapti graben, Godavari graben, Satpura<br />
and South-Rewa-Mahanadi-Gondwana rifts etc.<br />
(Mishra 1977). Verma & Banerjee (1992) have shown<br />
the Jabalpur Bouguer gravity high (22 o 46´N, 78 o 48´E)<br />
is elliptical in shape and with an amplitude of 40<br />
mgal, trending NE-SW and extending over a length of<br />
nearly 250 km, with maximum width of nearly 70 km.<br />
The high gravity appears to be related to the tectonic<br />
framework of the NSL. A massive high-density<br />
intrusive body in the upper crust with density contrast<br />
of + 0.1 g/cm 3 with respect to the normal crustal<br />
density is envisaged in order to explain the Jabalpur<br />
high. To understand the crustal structure and tectonic<br />
framework with its geophysical implication, five Deep<br />
Seismic Sounding (DSS) profiles, each about 250 km<br />
long, were shot across the NSL by National<br />
Geophysical Research Institute (NGRI), Hyderabad,<br />
India. Among these DSS profiles, only Hirapur-<br />
Mandla profile passes <strong>through</strong> the present study area.<br />
The depth of Moho along the Hirapur-Mandla DSS<br />
profile varies from 39.5 km near Tikaria to about 45<br />
km at Narsighgarh. Narmada alluvial deposits cover<br />
the central part of DSS profile between Katangi and<br />
Jabalpur. In south, Deccan Trap is exposed as an<br />
outlier between Jabalpur and Mandla. The DSS data<br />
has established a basement of uplifted horst zone<br />
between Katangi and Jabalpur (Kaila et al., 1987).<br />
Satpura region is characterized by high heat flow<br />
as a result of both the conductive and advective<br />
heat transfer, with values that range from 70 to<br />
100 mW/m 2 (Ravi Shankar 1988; Mahadevan 1994).<br />
On the basis of rheological models, thermomechanical<br />
structure of the Central Indian shield of<br />
such a high heat flow regime do not support<br />
occurrence of deep crustal seismicity. Occurrence of<br />
Jabalpur earthquake with a focus very close to the<br />
crust-mantle boundary provides a constraint on the<br />
thermo-mechanical structure of the Central Indian<br />
shield, by favouring a low mantle heat flow (Manglik<br />
& Singh 2002). Magnetotelluric (MT) studies over<br />
the Damoh-Jabalpur-Mandla-Anjaneya Profile, Central<br />
India, by Gokarn & Singh (2000) show geoelectric<br />
structure in the depth range of 0-25 km and inferred<br />
a resistivity in a range of 2- 700 Ohm-m in the<br />
Damoh-Jabalpur-Mandla region using two dimensional<br />
modeling. They interpreted the results as the lower<br />
crustal intrusive rising southeast from below Jabalpur
<strong>Geomagnetic</strong> <strong>secular</strong> <strong>variation</strong> <strong>anomalies</strong> <strong>investigated</strong> <strong>through</strong> tectonomagnetic monitoring<br />
in the seismoactive zone of the Narmada-Son Lineament, Central India<br />
Figure 1. The principal tectonic elements of the Narmada-Son Lineament (NSL) and adjoining areas (adopted from<br />
tectonic map of India, Eremenko and Negi, 1968). The area under tectonomagnetic study is roughly drawn.<br />
Hatched area of Satpura conductivity anomaly (SCA) and location of cities and towns (*) and location (O) of Kosamghat,<br />
the epicenter of the Jabalpur earthquake of May 22, 1997 are also shown in map.<br />
into the upper crust leading to Tikaria gravity high.<br />
In another paper, Gokarn et al., (2001) showed some<br />
vertical conductivity contrast as the geoelectrical crosssection<br />
in the depth range 30-40 km <strong>through</strong>out the<br />
Damoh-Jabalpur-Mandla-Anjaneya profile and the<br />
resistivity <strong>variation</strong>s are in a narrow range of 200-500<br />
Ohm-m. They interpreted the results that the<br />
conductivity anomaly and high gravity may have<br />
different causative mechanisms. The high conductivity<br />
may be due to the presence of crustal fluids, whereas<br />
the gravity high seems to be predominantly due to the<br />
upwarping of the Moho. A long-wavelength magnetic<br />
anomaly map was compiled <strong>through</strong> rectangular<br />
harmonic analysis in Central India; the NSL is<br />
characterized by a regional low, embodying a weak<br />
positive anomaly (Arora & Waghmare 1984). A linear<br />
<strong>Geomagnetic</strong> Depth Sounding (GDS) experiment was<br />
carried out along Hirapur-Mandla-Bhandara magnetic<br />
profile for studying the lateral extent and geometrical<br />
configuration of Satpura electrical Conductivity<br />
Anomaly (SCA). The lateral extent of SCA is bounded<br />
between Jabalpur and Paraswada and its centre is<br />
located beneath Kalpi, which is shown as hatched area<br />
in Fig.1. The SCA was interpreted as trapped fluids<br />
in the crust (Arora, Waghmare & Mahashabde 1995;<br />
Waghmare, Arora & Pecova 1996). The correlation of<br />
SCA with the Jabalpur earthquake of May 22, 1997<br />
was shown by Waghmare (2003).<br />
63
P.B.Gawali et al.<br />
DATA COLLECTION<br />
A network of 70 field stations on the natural ground<br />
and far from man-made structures, with interdistances<br />
of less than 10 km, were selected <strong>through</strong><br />
geomagnetic measurements to ensure stations are<br />
located in low-gradient areas. Non-magnetic sandstone<br />
pillars have been installed as stable benchmarks over<br />
which magnetometer sensor is placed for total<br />
geomagnetic field measurements. The locations of the<br />
stations comprise areas of Jabalpur, Katangi, Mandla,<br />
Seoni, Lakhnadon and Narsimhapur in Madhya<br />
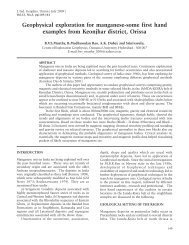
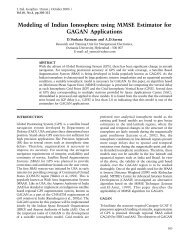
Pradesh, Central India. Fig.2 shows a layout map of<br />
repeat survey stations covering five geomagnetic<br />
profiles. The Narmada north fault and south fault are<br />
also roughly drawn in the figure. For measurements<br />
of total geomagnetic field intensity T, two drift-free<br />
64<br />
and absolute measurable Proton Precession<br />
Magnetometers (PPMs) were used. The PPMs were<br />
specially developed in IIG’s instrumentation laboratory<br />
having a sensitivity of 0.1 nT, a long- term stability<br />
of ~0.2 nT and thermal drift under ~0.03 nT per<br />
10 o . One PPM was deployed at base station while<br />
other was used at field stations. The same<br />
instruments were used for all repeat surveys. Before<br />
an observation, PPMs were calibrated at exactly the<br />
same time by portable GPS receivers and sample<br />
scanning intervals were set for 15 seconds. The<br />
observations were taken early in the morning and<br />
afternoon hours to avoid extant overhead ionospheric<br />
current system. Both the PPMs were operated<br />
simultaneously at the base and field stations for half<br />
an hour and a total of 120 values of total geomagnetic<br />
field intensity T were recorded on auto mode and<br />
Figure 2. Map showing layout of geomagnetic repeat stations in Narmada-Son Lineament (NSL), Central India.<br />
Location of Narmada North Fault and Narmada South Fault (as reported by India Meteorological Department,1998)<br />
along with five geomagnetic profiles and station codes are shown in map.
<strong>Geomagnetic</strong> <strong>secular</strong> <strong>variation</strong> <strong>anomalies</strong> <strong>investigated</strong> <strong>through</strong> tectonomagnetic monitoring<br />
in the seismoactive zone of the Narmada-Son Lineament, Central India<br />
saved in PPMs memory, later downloaded to the<br />
personal computer at the base station. This procedure<br />
was adopted for covering all survey points and entire<br />
survey was completed within 30-40 days during each<br />
campaign. Seven phases of surveys were completed<br />
starting from March–April 2003, which were repeated<br />
in February-March 2004, February-March 2005,<br />
January-February 2006, January-February 2007,<br />
January-February 2008 and January-February 2009.<br />
DATA ANALYSIS<br />
The geomagnetic field is subjected to various kinds<br />
of <strong>variation</strong>s which originate in ionosphere and<br />
magnetosphere as well as within the Earth. However,<br />
these <strong>variation</strong>s can approximately be treated as being<br />
spatially spread over areas of local extent. On the basis<br />
of this approximation, it is possible to detect changes<br />
associated with tectonomagnetic phenomena in the<br />
Earth by taking a simple difference between the<br />
magnetic fields observed simultaneously at two or<br />
more stations (Stacey & Westcott 1965; Rikitake<br />
1966b; Honkura 1981). In addition Stacey & Westcott<br />
(1965) have suggested that at least initially it is<br />
necessary to avoid completely auroral zones, where<br />
ionospheric currents are highly variable and strong<br />
gradients occur in geomagnetic disturbances. While<br />
studying electromagnetic induction within the Earth<br />
by natural external <strong>variation</strong> of magnetic field, Gough<br />
(1973) indicated that external fields incident on most<br />
of the Earth’s surface are those of distant currents of<br />
ionosphere/magnetosphere and have wavelengths of<br />
thousands of kilometres. The external source field can<br />
be contaminated in the auroral and equatorial zone<br />
due to auroral and equatorial electrojets. Thus,<br />
external magnetic source fields may be considered as<br />
uniform to certain extent in the low and middle<br />
latitudes of the Earth. Moreover, Nishida et al., (2004)<br />
have indicated that the contributions from Earth’s<br />
core main field and ionospheric / magnetospheric<br />
origin are ruled out as source mechanisms because<br />
of local distribution of the anomalous stations. Also,<br />
Honkura & Koyama (1976) pointed out that the<br />
distance between survey sites and reference base station<br />
should be less than 100 km to avoid apparent changes<br />
of the <strong>secular</strong> <strong>variation</strong>s exceeding 1 nT/yr. If we<br />
consider the external source field uniformity, according<br />
to Gough (1973) indications, our tectonomagnetic<br />
study area in the NSL is in the low latitudes between<br />
22 o N and 24 o N and necessarily the external magnetic<br />
source field is uniform without any contamination due<br />
to the influence of electrojets. Also our reference base<br />
station is located in the study area within about <<br />
100 km aerial distance from the field stations and the<br />
external source field will have similar contributions<br />
at the base and field stations. Hence, simple difference<br />
method can be applied to data analysis for eliminating<br />
the ionospheric/magnetospheric contributions.<br />
However, the most disturbing factor is the<br />
presence of lateral inhomogeneities that exist in the<br />
crust, which cause electrical conductivity <strong>anomalies</strong><br />
by electromagnetic induction from external varying<br />
geomagnetic field. The electromagnetic induction<br />
within the Earth is the frequency (period) dependent<br />
phenomenon, which follows the skin depth<br />
relationship Ds = 0.5t km, where is resistivity<br />
in Ohm-m and t is time in seconds (Gough 1992).<br />
There is a working rule that longer the time of external<br />
<strong>variation</strong> field, deeper is the penetration of induced<br />
current within the Earth. But we are interested in<br />
probing crustal depth, so short period <strong>variation</strong>s of the<br />
field are used. For short period <strong>variation</strong>s of micropulsation<br />
type, total magnetic field data for 10 minute<br />
averaging procedure is satisfactory, and the ‘noise’<br />
component due to electrical conductivity<br />
inhomogeneities in the surrounding rocks does not<br />
contribute significantly to the <strong>variation</strong>s of T<br />
(Skovorodkin, Bezuglaya & Guseva 1978). They also<br />
suggested that when high sensitivity (0.1 nT) absolute<br />
proton precession magnetometers are used then the<br />
mean square error of a single observation of T for<br />
10 minutes is ±0.2 nT, when data samples are taken<br />
between 20 and 30. As per Skovorodkin, Bezuglaya &<br />
Guseva (1978), for the area under investigation,<br />
tectonomagnetic <strong>variation</strong> may be judged as significant<br />
when the change in T exceeds 0.6 nT. It is not<br />
possible to determine the actual error of calculation<br />
in geomagnetic field <strong>secular</strong> <strong>variation</strong>s at each site<br />
(Grabowska & Bojdys 2004). In this study, maximum<br />
care was taken in data selection for the analysis by<br />
precision measuring, and limiting associated noise<br />
level during detection of tectonomagnetic effect, which<br />
on theoretical considerations is not expected to exceed<br />
10 nT (Rikitake 1976a; Zlotnicki & Cornet 1986). In<br />
present case, difference method for data analysis is<br />
followed (Skovorodkin, Bezuglaya & Guseva 1978;<br />
Kuznetsova & Klymkovych, 2001). The efficacy of the<br />
difference method and data reduction process was<br />
earlier tested with repeat surveys undertaken in<br />
seismically active regions of Koyana, Maharashtra<br />
(Arora 1988) and Garhwal Himalayas (Arora & Singh<br />
1992).<br />
Some workers have used night-time data in this<br />
type of studies assuming the solar quiet daily<br />
<strong>variation</strong> (Sq) is close to zero. However, Rikitake<br />
(1966b) found that daily fluctuation even in the night-<br />
65
P.B.Gawali et al.<br />
time values are not same at two stations. Day-time<br />
data in terms of micro–pulsation (Pc5) type were used<br />
in present study, which ranges between 150-600<br />
seconds (Samson 1991). Continuous string of 20<br />
values i.e., 300 seconds simultaneous data for the<br />
base and field station were selected for averaging and<br />
calculation of standard deviations. The accuracy of the<br />
estimate would certainly be improved by taking an<br />
average of 20 values. The difference was obtained by<br />
subtracting average value of base station from the<br />
average value of field station. Finally, a single value<br />
for a particular station is determined as the residual<br />
field, which can be interpreted as tectonomagnetic<br />
signal with respect to reference base station. Thus,<br />
the residuals were calculated for all field stations with<br />
respect to the reference base station for all repeated<br />
data sets. The theoretical interpretation is given as<br />
follows:<br />
On the basis of a long series of repeat total<br />
geomagnetic field surveys, <strong>anomalies</strong> of temporal<br />
geomagnetic field changes T = F, i.e.<br />
tectonomagnetic <strong>anomalies</strong> are detected within a given<br />
time interval of observations. Within the profile and<br />
spatial observations of repeat surveys following<br />
quantities were followed: Fi and Fo - total<br />
geomagnetic field intensity in the i-th point and basic<br />
point (for all points of network), respectively. If Fi*<br />
and Fo* are values for the first cycle of the<br />
observations, then ”F* = Fi* - Fo*. If Fi** and Fo**<br />
are values with a repeat cycle of the observation<br />
(within a chosen time interval, e.g. day, month, year,<br />
etc.), then ”F** = Fi** - Fo**. The tectonomagnetic<br />
anomaly is characterized by F = F* - F**. If no<br />
local changes of the field of tectonomagnetic origin<br />
occurs, then F 0 (within the measurement<br />
errors and outer field identity). The values F 0<br />
indicate the availability of recent tectonic processes,<br />
which seem to be revealed due to repeat surveys<br />
(Kuznetsova & Klymkovych 2001).<br />
RESULTS AND DISCUSSION<br />
The statistical results of the observational data show<br />
that the mean standard deviation associated with<br />
residual field T values range between 0.3 – 2 nT.<br />
The static <strong>secular</strong> <strong>variation</strong> <strong>anomalies</strong> of the<br />
geomagnetic field of the crustal origin range from ±<br />
0.1 nT/yr to ± 9.5 nT/yr at different stations in<br />
various profiles. Despite lack of any seismic event<br />
during repeat survey period, the <strong>secular</strong> <strong>variation</strong><br />
<strong>anomalies</strong> nevertheless have signified that the<br />
stresses are building in the crust of survey area. Our<br />
results seem to be reasonable compared to other<br />
66<br />
results obtained in seismoactive region of Middle Asia<br />
as shown by Shapiro et al., (1978). Much of the<br />
interpretation to follow is based on the pattern<br />
resulting from T of the annual changes at particular<br />
station by selecting some stations on each profile<br />
for the period of 2003-2009. To resolve stress related<br />
temporal magnetic changes of the crustal origin, the<br />
difference technique is used to present the results as<br />
shown in Figs. 3-7 where the residual field at each<br />
site are obtained as the difference between successive<br />
repeat surveys and are examined in space domain, i.e.<br />
with differencing second year residual field from first<br />
year and third year from second year and so on. Also<br />
the linear least-squares regression (Y= A*X +B) lines<br />
are drawn for the period 2003 to 2009 at each station<br />
in Figs. 3-7. The increase and decrease of the trends<br />
of regression lines may be judged as the increase or<br />
decrease of the level of the yearly <strong>secular</strong> changes at<br />
the station with respect to the increase or decrease<br />
of stress level.<br />
In majority of cases tectonomagnetic <strong>anomalies</strong><br />
generally show relation with earthquakes and volcanic<br />
events. However, it is suggested that the gradual<br />
crustal movement can cause stress and tension in the<br />
vicinity of faults and weaker zones resulting in the<br />
magnetization changes and the signatures can be seen<br />
on the magnetic anomaly (Sasai 1991, 1994). If the<br />
slower crustal movement develops the stress gradually,<br />
then the Central Indian crustal zone comprising NSL<br />
is most susceptible to stress development. The stress<br />
fields are due to the cumulative effects of the plate<br />
boundary forces of which the back-thrust from the<br />
Himalayan collision may be the most prominent<br />
(Gupta et al., 1997). As is shown by Oshiman (1990),<br />
spatial pattern of negative and positive changes in total<br />
geomagnetic field can also be expected on a boundary<br />
between different blocks in the direction of crustal<br />
magnetization resulting in anomalous changes in the<br />
total geomagnetic field. The <strong>anomalies</strong> in the <strong>secular</strong><br />
<strong>variation</strong>s are shown in Figs. 3-7, which is an evidence<br />
for anomalous stress distribution within the crust.<br />
In the present study we have used limited period data<br />
of the total geomagnetic field, so the electromagnetic<br />
inductions within the Earth by external sources are<br />
neglected. However, if the fluids are present in the<br />
crust, their motion is possible due to stress<br />
differentials within the crust. The fluids are capable<br />
of forcing <strong>through</strong> a porous medium thereby<br />
producing the electrokinetic charge separation. The<br />
resulting potential difference (terms a streaming<br />
potential) then causes current to flow, which is<br />
considered as electrokinetic phenomena (Mizutani et<br />
al., 1976). Hence, for the <strong>secular</strong> <strong>variation</strong> <strong>anomalies</strong>
<strong>Geomagnetic</strong> <strong>secular</strong> <strong>variation</strong> <strong>anomalies</strong> <strong>investigated</strong> <strong>through</strong> tectonomagnetic monitoring<br />
in the seismoactive zone of the Narmada-Son Lineament, Central India<br />
in the total geomagnetic field in our study area, the<br />
contribution of electrokinetic effect cannot be ruled<br />
out.<br />
Secular <strong>variation</strong> <strong>anomalies</strong> at the stations along<br />
AA’ profile<br />
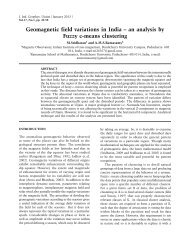
AA’ profile covers 29 stations between Katangi and<br />
Mandla with inter-station distance of about 5 km. All<br />
station results are not shown in Fig. 3, but only<br />
selected 10 stations along the AA’ profile are depicted.<br />
The abbreviated station’s name appear in Fig. 3 whose<br />
codes are given in Fig.2. The small-scale amplitude<br />
of the anomaly falls in the range of fraction to 8.5 nT<br />
with positive and negative sign at some stations. Fig.3<br />
shows 10 plots, in which year to year continuous<br />
changes for 7 years of the geomagnetic field between<br />
2003 to 2009, i.e. the ”T difference (2003-2004), (2004-<br />
2005), (2005-2006) and (2006-2007), (2007-2008) and<br />
(2008-2009) are plotted on same scale. A decrease is<br />
seen in the trend of linear least-square regression line<br />
at Bor (J8) station whereas Nag (J7) station shows<br />
increase from beginning to end. The decrease in<br />
<strong>secular</strong> <strong>variation</strong> at Bor (J8) is speculated to be due to<br />
drop in stress level whereas the stress levels are<br />
increasing at Nag (J7). Similarly increase or decrease<br />
of the trend of linear fit lines can be observed in<br />
respective stations on the AA’ profile. The distinctive<br />
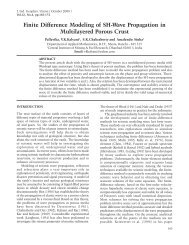
Figure 3. Annual <strong>secular</strong> changes of the total geomagnetic field (“T) are shown at 10 stations along the Katangi-<br />
Mandla (AA’) profile. Linear least-square regression dash lines are also drawn at each station.<br />
67
P.B.Gawali et al.<br />
pattern of ”T differences observed in fig. 3 may be<br />
because of some manifestation of stress and tension<br />
<strong>variation</strong>s due to geodynamic processes and anomalous<br />
movements of crustal blocks with Mahakoshal belt,<br />
Satpura horst and graben like structures of the<br />
Narmada fault systems. Moreover, it is interesting to<br />
note that along this profile Satpura electrical<br />
conductivity anomaly (SCA) was characterized by<br />
conductivity 0.2 S/m (resistivity 5 Ohm-m)<br />
<strong>investigated</strong> by <strong>Geomagnetic</strong> Depth Sounding (GDS)<br />
method (Arora, Waghmare & Mahashabde 1995;<br />
Waghmare 2003). This conductivity anomaly was<br />
interpreted due to the fluids/saline water in the deep<br />
crust of Jabalpur-Mandla area. The inter-cavity porous<br />
68<br />
fluids of the rocks generate the electric currents which<br />
are responsible for the Satpura conductor. There is<br />
also a possibility that the fluids flow can produce<br />
electrokinetic effect which has contributed to the<br />
<strong>secular</strong> <strong>variation</strong> of the total geomagnetic field along<br />
the AA’ profile. Coincident deep reflector/refractor<br />
studies in Central India have shown presence of upper<br />
and lower crustal low-velocity layers. These low<br />
velocity layers, high heat flow, hot springs, significant<br />
reflectivity character north and south of Central India<br />
suture and seismic activities in Central India strongly<br />
suggest neo-tectonic activity in the region, including<br />
along the horst structure between Katangi and<br />
Jabalpur (Reddy, Sain & Murty 1997).<br />
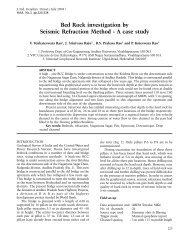
Figure 4. Annual <strong>secular</strong> changes of the total geomagnetic field (“T) are shown at 10 stations along the Mandla-<br />
Lakhnadon (BB’) profile. Linear least-square regression dash lines are also drawn at each station.
<strong>Geomagnetic</strong> <strong>secular</strong> <strong>variation</strong> <strong>anomalies</strong> <strong>investigated</strong> <strong>through</strong> tectonomagnetic monitoring<br />
in the seismoactive zone of the Narmada-Son Lineament, Central India<br />
Secular <strong>variation</strong> <strong>anomalies</strong> at the stations along BB’<br />
profile<br />
BB’ profile covers 13 stations between Mandla and<br />
Lakhnadon with inter-station distance of about 10 km.<br />
Fig.4 shows changes in geomagnetic field along the<br />
BB’ profile. Results are not shown in Figure 4 for all<br />
stations, but we have chosen 10 stations along the<br />
BB’ profile. The abbreviated station’s name appears in<br />
Fig.4 with their codes in Fig.2. In Fig. 4, yearly ”T<br />
differences have been taken for (2003-2004), (2004-<br />
2005), (2005-2006), (2006-2007), (2007-2008) and<br />
(2008-2009). The amplitude of geomagnetic <strong>anomalies</strong><br />
falls in the range of a fraction to ± 9.5 nT. The trend<br />
of linear least-squares regression lines at the stations<br />
for <strong>secular</strong> changes in the total geomagnetic field, may<br />
suggest increase or decrease of stress level at the<br />
stations in the profile. The area between Mandla and<br />
Lakhnadon is covered by Deccan Traps. The interface<br />
between Deccan trap and underlying Archaean<br />
(basement) is interpreted to be at a depth of 900 m<br />
near Lakhnadon (Naskar et al., 2003). One more fault<br />
is inferred at 13 km south of Lakhnadon called<br />
Gavilgarh fault (Jain, Nair & Yedekar 1995), which<br />
may be influencing the geomagnetic <strong>secular</strong> <strong>variation</strong><br />
<strong>anomalies</strong> in the region. As anomaly is more<br />
pronounced the geological structure underlying this<br />
profile is more mobile as compared to AA’ profile.<br />
Secular <strong>variation</strong> <strong>anomalies</strong> at the stations along<br />
CC’ profile<br />
This profile covers only 5 stations between Lakhnadon<br />
and Narsimhapur with inter-station spacing of about<br />
Figure 5. Annual <strong>secular</strong> changes of the total geomagnetic field (“T) are shown at 5 stations along the Lakhnadon-<br />
Narsimhapur (CC’) profile. Linear least-square regression dash lines are also drawn at each station.<br />
69
P.B.Gawali et al.<br />
10 km. For all the stations results are shown in Fig.<br />
5. The abbreviated stations name appear in Fig.5 with<br />
their codes in Fig.2. Fig.5 gives changes of the<br />
geomagnetic field along CC’ profile with an amplitude<br />
in the range of ± 0.2 nT to ± 9.4 nT. The trend of<br />
linear least-squares regression lines at the stations for<br />
the <strong>secular</strong> changes in the total geomagnetic field may<br />
suggest the increase or decrease of stress level at the<br />
stations in the profile. Thus, year-to-year changes in<br />
”T in this profile also may be related to the stress/<br />
tension building in the vicinity of the Narmada south<br />
fault and adjoining areas of the Narmada rift system.<br />
Secular <strong>variation</strong> <strong>anomalies</strong> at the stations along<br />
DD’ Profile<br />
This is another small profile covering 8 stations<br />
between Narsimhapur and Jabalpur with inter-station<br />
spacing of about 10 km. Fig.6 gives 6 plots each with<br />
amplitude ranging from ± 0.6 nT to ± 7.7 nT. The<br />
trend of linear least-squares regression lines at the<br />
stations for the <strong>secular</strong> changes in the total<br />
geomagnetic field may suggest increase or decrease of<br />
stress level at the stations in the profile. The region<br />
is more or less in the Mahakoshal group with alluvial<br />
deposits between Narsimhapur and Jabalpur (Jain, Nair<br />
70<br />
& Yedekar 1995). Active Narmada south fault passes<br />
along this profile. Since whole area of NSL is under<br />
stress it may cause changes in the total geomagnetic<br />
field along the profile.<br />
Secular <strong>variation</strong> <strong>anomalies</strong> at the stations along EE’<br />
profile<br />
This profile covers 19 stations between Jabalpur and<br />
Seoni and inter-station spacing is about 10 km.<br />
Results of all station are not shown in Fig.7, but only<br />
10 stations along the EE’ profile are depicted. The<br />
abbreviated stations name appear in Fig. 7 whose codes<br />
are given in Fig. 2. Fig.7 gives ”T difference of 10 plots<br />
with amplitudes ranging from ± 0.3 nT to ± 6.5 nT.<br />
The trend of linear least-squares regression lines at<br />
the stations for the <strong>secular</strong> changes in the total<br />
geomagnetic field may suggest increase or decrease of<br />
stress level at the stations in the profile. Jabalpur to<br />
Seoni area is mostly covered by Lameta sediments,<br />
Deccan basalt and intrusives (Jain, Nair & Yedekar<br />
1995). The Archaeans include the older<br />
metamorphites, some ultramafic/basic intrusives and<br />
unclassified granite gneisses intruded at places by<br />
quartz, pegmatite and aplite veins in south of Seoni<br />
area (Naskar et al., 2003). The swarm type seismic<br />
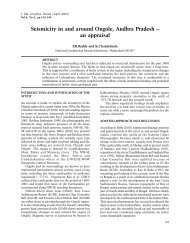
Figure 6. Annual <strong>secular</strong> changes of the total geomagnetic field (“T) are shown at 6 stations along the Narsimhapur-<br />
Jabalpur (DD’) profile. Linear least-square regression dash lines are also drawn at each station.
<strong>Geomagnetic</strong> <strong>secular</strong> <strong>variation</strong> <strong>anomalies</strong> <strong>investigated</strong> <strong>through</strong> tectonomagnetic monitoring<br />
in the seismoactive zone of the Narmada-Son Lineament, Central India<br />
Figure 7. Annual <strong>secular</strong> changes of the total geomagnetic field (“T) are shown at 10 stations along the Jabalpur-<br />
Seoni (EE’) profile. Linear least-squares regression dash lines are also drawn at each station.<br />
activities were experienced around Bamhori, Seoni<br />
district in April-May 2000. The hidden basement fault<br />
beneath the Deccan Traps may be causing swarm type<br />
seismic activity around Bamhori village (Pimprikar &<br />
Devarajan 2003). The <strong>secular</strong> changes in the total<br />
geomagnetic field may be related to stresses building<br />
due to active geological inhomogeneities in this profile.<br />
No major seismic activity or volcanic activity was<br />
recorded during the tectonomagnetic observation<br />
period for March-April 2003 to January-February 2009.<br />
Hence, significant correlations have not been observed<br />
between seismic events and obtained values of <strong>secular</strong><br />
<strong>variation</strong> of geomagnetic field in the survey area. Figs.<br />
3-7 suggest the changes of the geomagnetic field in<br />
the survey area are probably anomalous. Seismicity<br />
associated with NSL is due to the strike-slip fault<br />
movement or thrust mechanism, consistent with the<br />
compressive stresses transmitted from plate<br />
boundaries as well as internal fabrics of crustal blocks<br />
(Mall, Singh & Sarkar 2005). Further, they suggested<br />
that influence of uplift processes such as horst like<br />
structures in the form of Satpura mountain ranges<br />
that possibly originate <strong>through</strong> lithosphere-mantle<br />
interaction, perhaps are not uniform in magnitude and<br />
direction because of plate tectonic stresses. The<br />
obtained data gives evidence to stress-strained state<br />
<strong>variation</strong>s in the crust of NSL leading to temporal<br />
anomalous <strong>variation</strong>s of the geomagnetic field.<br />
CONCLUSIONS<br />
In the AA’ profile the fluid flow has produced the<br />
electrokinetic effect contributing to the <strong>secular</strong><br />
<strong>variation</strong> of the total geomagnetic field. In BB’ profile<br />
the increase/decrease in stress levels have caused the<br />
<strong>secular</strong> changes in the total geomagnetic field. As the<br />
anomaly here is more pronounced, the geological<br />
structure underlying this profile is more mobile<br />
compared to AA’ profile. The stations in the CC’<br />
profile behave similar to the ones in BB’, whereas the<br />
71
P.B.Gawali et al.<br />
<strong>secular</strong> changes at DD’ and EE’ more or less follow a<br />
similar trend. Since the whole area of NSL is under<br />
stress it may cause changes in the total geomagnetic<br />
field or it could also be that the stresses are building<br />
due to active geological inhomogeneities along these<br />
profiles.<br />
The space-time pattern of residual geomagnetic<br />
field around Jabalpur and adjoining areas in NSL<br />
indicates certain characteristic features which have<br />
been interpreted as stress change in the crust. The<br />
small-scale <strong>secular</strong> <strong>variation</strong> <strong>anomalies</strong> of the crustal<br />
origin may be a manifestation of tectonically active<br />
parts and joints of different tectonic crustal blocks of<br />
NSL. The <strong>secular</strong> <strong>variation</strong> <strong>anomalies</strong> of total<br />
geomagnetic field may have resulted in response to the<br />
gradual movement of Indian plate in NE-SW direction<br />
and collision with Eurasian plate building stresses and<br />
tension on the fault systems of the NSL zone.<br />
However, dominant contribution for <strong>secular</strong> changes<br />
in the total geomagnetic field in the crust originating<br />
from the stress induced tectonomagnetic<br />
(piezomagnetic) effect rather than fluids produced<br />
electrokinetic effect. In the present scenario taking<br />
into account the long tectonic and seismicity history<br />
of the NSL belt, it seems possible that both<br />
piezomagnetic and electrokinetic mechanisms may be<br />
operative. But, since no earthquake of measurable<br />
magnitude occurred in the surveyed region during the<br />
duration of experiment, such general conclusions may<br />
be premature. However, data gathered in present<br />
surveys will help in investigating the tectonomagnetic<br />
effect of the impending seismic activity.<br />
ACKNOWLEDGEMENTS<br />
The authors are thankful to the Director, Indian<br />
Institute of Geomagnetism, New Panvel (W), Navi<br />
Mumbai for encouraging and supporting the project<br />
“Tectonomagnetic investigation in Jabalpur-Kosamghat<br />
area in Central India” and permission to publish this<br />
work. The authors are also thankful to the Director,<br />
Geological Survey of India, Jabalpur (M.P.) for<br />
providing necessary help during fieldwork. Mr.<br />
S.B.Waknis and Mr.B.I. Panchal are gratefully<br />
acknowledged for drawing the figures.<br />
REFERENCES<br />
Arora, B.R., 1988. Tectonomagnetic studies in India. In:<br />
Guha, S.K.K., Patwardhan, A.M. ( Eds.) Earthquake<br />
Prediction-Present Status. Deptt. of Geology,<br />
University of Poona, Pune, India pp. 53-62.<br />
Arora, B.R.& Singh, B.P., 1992. <strong>Geomagnetic</strong> and geoelectric<br />
72<br />
investigations for seismicity and seismotectonics of<br />
the Himalayan region. Mem. Geol. Soc. India 23,<br />
223-263.<br />
Arora, B.R. & Waghmare, S.Y., 1984. Delineation of longwavelength<br />
magnetic <strong>anomalies</strong> over Central India<br />
by Rectangular Harmonic analysis, Proc. Indian Acad.<br />
Sci. (Earth Planet. Sci.) 93, 353-362.<br />
Arora, B.R., Waghmare, S.Y. & Mahashabde, M.V., 1995.<br />
<strong>Geomagnetic</strong> depth sounding along the Hirapur–<br />
Mandla-Bhandara profile, Central India, Mem. Geol.<br />
Soc. India 31, 519-535.<br />
Choubey, V.D., 1971. Narmada-Son lineament, India.<br />
Nature Phys. Sci., 232, 38-40.<br />
Djadkov, P.G., Mikheev, O.A., Minenko, M.I. & Sobolev<br />
O.A., 2007. Some results of tectonomagnetic<br />
monitoring in the epicentral zone of the M7.5 Altay<br />
earthquake, September 27, 200, Annals of Geophysics,<br />
50, 31-37.<br />
Eremenco, N.A. & Negi, B.S., 1968. Tectonic map of India,<br />
Oil and Natural Gas Commission, Dehradun, Printed<br />
at the 101(H.L.O.) printing group of Survey of India.<br />
Ghosh, D.B., 1976. The nature of Narmada-Son lineament.<br />
In: Seminar volume on Tectonics and Metallurgy of<br />
South and East Asia, Geol. Surv. India Misc. Publ.,<br />
34, 119-132.<br />
Gokarn, S.G. & Singh, B.P., 2000. Magnetotelluric<br />
technique. In:Varma, O.P., Mahadevan, T.M. (Eds.)<br />
Research highlights in Earth System Science, DST’s<br />
Spl. Publication, Ind. Geol. Cong., 1, 123-142.<br />
Gokarn, S.G., Rao, C.K., Gupta, G., Singh, B.P. & Yamashita,<br />
M., 2001. Deep crustal<br />
structure in Central India using Magnetotelluric<br />
studies, Geophys. J. Int., 144, 685-694.<br />
Gough, D.I., 1973. The interpretation of magnetometer<br />
array studies. Geophys, J. R. Ast. Soc., 35, 83-98.<br />
Gough, D.I., 1992. Electromagnetic exploration for fluids<br />
in the Earth’s crust, Earth Science Review 32, 3-18.<br />
Grabowska, T. & Bojdys, G., 2004. Analysis of geomagnetic<br />
field along seismic profile P4 of the International<br />
project POLONAISE’ 97, Tectonophysics, 383, 15-28.<br />
Gupta, H.K., Chadha,R.K., Rao, M.N., Narayana, B.L.,<br />
Mandal, P., Ravi Kumar, M. & Kumar, N., 1997. The<br />
Jabalpur Earthquake of May 22, 1997, Jour. Geol. Soc.<br />
India, 50, 85-91.<br />
Hamano, Y., 1983. Experiment on the stress sensitivity of<br />
natural remanent magnetization , J. Geomag.<br />
Geoelectr., 35, 155-172.<br />
Honkura, Y., 1981. Electric and magnetic approach to<br />
earthquake prediction: In: Rikitake, T. (Ed.), Current<br />
research in earthquake prediction I, DEPS02, Reidel<br />
Publication Co., Center of Academic publication,<br />
Tokyo, Japan, pp 301-383.<br />
Honkura, Y. & Koyama, S., 1976. On a problem in<br />
earthquake prediction research based on the survey
<strong>Geomagnetic</strong> <strong>secular</strong> <strong>variation</strong> <strong>anomalies</strong> <strong>investigated</strong> <strong>through</strong> tectonomagnetic monitoring<br />
in the seismoactive zone of the Narmada-Son Lineament, Central India<br />
of the geomagnetic total intensity, Proc. Conductivity<br />
Anomaly Symp. Geol. Survey Japan, 145-150.<br />
India Meteorological Department, New Delhi, 1998.<br />
Jabalpur earthquake of 22nd May 1997 and its<br />
aftershocks (a consolidated document), pp.1-70.<br />
Jain, S.C., Nair, K.K.K. & Yedekar, D.B., 1995. Geology of<br />
the Son-Narmada-Tapti Lineament Zone in Central<br />
India, Spl. Publ. Geol. Survey India, 10, 1-154.<br />
Johnston, M.J.S., Silverman, S.A., Mueller, R.J. &<br />
Breckenridge, K.S., 1985. Secular <strong>variation</strong>, crustal<br />
contribution, and tectonic activity in California, 1976-<br />
1984, J. Geophysics. Res., 90, 8707-8717.<br />
Johnston, M.J.S. Mueller, R.J. & Sasai, Y., 1994. Magnetic<br />
field observation in the near-field of the 28 June1992<br />
MW 7.3 Landers, California. Earthquake, Bull. Seism.<br />
Soc. Amer., 84, 792-798.<br />
Kaila, K.L., Murthy, P.R.K., Mall, D.M. & Dixit, M.M., 1987.<br />
Deep seismic sounding along Hirapur –Mandla<br />
profile, Central India , Geophys J.R. Ast. Soc., 89,<br />
399-404.<br />
Kapitsa, S.P., 1955. Magnetic properties of eruptive rocks<br />
under mechanical stresses, Izv. Akad. Nauk U.S.S.R.,<br />
86, 521-523.<br />
Kormiltsev, V.V. & Ratushniak, A.N., 1997. Electric and<br />
magnetic field induced by fluids in porous solids with<br />
local herogeneities of permeability and electric<br />
properties, Izv. RAN, Ser. Fizika Zemli, 8, 81-87.<br />
Kuznetsova, V. & Klymkovych, T., 2001. Application of<br />
high-accuracy magnetometry to study recent<br />
geodynamic processes and earthquake precursors,<br />
Contributions of Geophysics and Geodesy, 31, 383-<br />
388.<br />
Mahadevan, T.M., 1994. Deep continental structure of<br />
India: A review. Mem. Geol. Soc. India, 28, 1-562.<br />
Mall, D.M., Singh, A.P.& Sarkar, D., 2005. Structure and<br />
Seismotectonic of Satpura, Central India, Current<br />
Science, 88, 1621-1627.<br />
Manglik, A.&Singh, R.N., 2002.Thermomechanical<br />
structure of the Central Indian shield : Constrains<br />
from deep crustal seismicity, Current Science, 82,<br />
1151-1157.<br />
Mishra, D.C., 1977. Possible extensions of the Narmada-<br />
Son lineament towards Murray ridge (Arabian Sea)<br />
and the eastern syntaxial bend of the Himalayas, Earth<br />
and Planet. Sci. Lett., 36, 301-308.<br />
Mizutani, H., Ishido, T., Yokokura, Y. & Ohnishi, S., 1976.<br />
Electrokinetic phenomena associated with<br />
earthquakes, Geophys. Res. Lett., 3, 365-368.<br />
Molnar, P., Kunangyi, C.B. & Liang, Z.Z., 1987. Geomorphic<br />
evidence for active faulting in the Altyn Tagh and<br />
northern Tibet quantitative estimates of its<br />
contribution to the convergence of India and Eurasia,<br />
Geology, 15, 403-406.<br />
Nagata, T. & Kinoshita, H., 1967. Effect of the hydrostatic<br />
pressure on magnetostriction and magnetocrystalline<br />
anisotropy of magnetite, Phys. Earth Planet. Int., 1,<br />
44-48.<br />
Nagata, T., 1969. Tectonomagnetism, I.A.G.A. Bull., 27, 12-<br />
43.<br />
Naskar, D,C., Mujumdar, R.K., Choudhury, K. & Das, L.K.,<br />
2003. Magnetic profiles across NSL in part of Central<br />
India, Indian Minerals, 57, 53-60.<br />
Nishida, Y., Sagisaki, Y., Takahashi, K., Utsugi. M. &<br />
Oshima, H., 2004. Tectonomagnetic study in the<br />
eastern part of Hokkaido, NE Japan: Discrepancy<br />
between observed and calculated results, Earth<br />
Planets Space, 56, 1049-1056.<br />
Oshiman, N., 1990. Enhancement of tectonomagnetic<br />
changes due to non-uniform magnetization in the<br />
Earth’s crust – two –dimensional case studies, J<br />
Geomag. Geolectr., 42, 607-619.<br />
Pimprikar, S.D. & Devarajan, M.K., 2003. Earthquake<br />
swarm activity around village Bamhori, Seoni District,<br />
Madhya Pradesh : A preliminary study, Jour. Geol.<br />
Soc. India, 62, 498-502.<br />
Qureshy, M.N., 1964. Gravity <strong>anomalies</strong> as related to<br />
regional tectonic of peninsula India. Rep. 22nd Int.<br />
Geol. Congr. New Delhi, India Pt. IV, 490-506.<br />
Ravi Shankar, 1988. Heat flow map of India and discussions<br />
on its geological and economics significance, Indian<br />
Miner., 42, 89-110.<br />
Reddy, P.R., Sain, K. & Murty, A.S.N., 1997. On the seismic<br />
vulnerability of Jabalpur region: Evidence from deep<br />
seismic sounding, Current Science, 73, 796-800.<br />
Rikitake, T., 1976a. Earthquake Prediction, Elsevier,<br />
Amsterdam, pp. 357<br />
Rikitake, T., 1966b. Elimination of non local changes from<br />
total intensity values of the geomagnetic field, Bull.<br />
Earthq. Res.Inst. Univ. Tokyo, 44, 1041-1070.<br />
Rikitake, T. & Honkura, Y., 1985 Solid Earth<br />
Geomagnetism. Terra Scientific Publ. Co. Japan, pp.<br />
400<br />
Samson, J.C., 1991. <strong>Geomagnetic</strong> pulsations and plasma<br />
waves in the Earth’s Magnetosphere, In: Jacobs J.A.<br />
(Ed.) Geomagnetism Vol. 4, Academic Press.<br />
Harcourt Brace Jovanovich, Publ., London, pp.481-<br />
590.<br />
Sasai,Y., 1980. Application of the elasticity theory of<br />
dislocation of tectonomagnetic Modelling, Bull.<br />
Eaerhq. Res. Inst. Univ. Tokyo, 55, 387-447.<br />
Sasai, Y., 1991. Tectonomagnetic modeling on the basic of<br />
the linear piezomagnetic Effect, Bull. Earthq. Res. Inst.<br />
Univ. Tokyo, 66, 585-722.<br />
Sasai,Y., 1994. Piezomagnetic fields produced by<br />
dislocation sources, Surveys in Geophysics, 15, 363-<br />
382.<br />
Sasai, Y., 2001. Tectonomagnetic modeling based on the<br />
piezomagnetism, A review, Annali Di Geofisica, 44<br />
73
P.B.Gawali et al.<br />
(2), 361-268.<br />
Sasai, Y.& Ishikawa, Y., 1997. Seosmomagnetic models for<br />
earthquakes in the eastern part of Izu Peninsula,<br />
Central Japan , Annali Di Geofisica, 40 (2), 463-478.<br />
Sasai, Y.& Ishikawa.Y., 1980. Changes in the geomagnetic<br />
total force intensity associated with the anomalous<br />
crustal activity in the eastern part of the Izu<br />
Peninsula<br />
(3) – The off Izu Peninsula earthquake of 1980, Bull.<br />
Earthq. Res. Inst. Univ. Tokyo, 55, 1101 - 1113.<br />
Scholz, C.H., Sykes, L.R., Agarwal, Y.P., 1973. Earthquake<br />
prediction : A Physical Basis, Science, 81, 803-809.<br />
Shapiro, V.A., Pushkov. A.N., Abdullabekov, K.N.,<br />
Berdallev, E.B. & Muminov, M. Yu., 1978.<br />
<strong>Geomagnetic</strong> investigations in the seismoactive<br />
regions of Middle Asia, J. Geomag. Geoelectr., 30,<br />
503-509.<br />
Skovorodkin, Yu. P., Bezuglaya, L.S. & Guseva, T.V. 1978.<br />
Tectonomagnetic studies in Tajikistan, J. Geomag.<br />
Geoelectr., 30, 481-486.<br />
Stacey, F.D., 1964. The seismomagnetic effect, Pageoph, 58,<br />
5-22.<br />
Stacey, F.D. & Johnston, M.J.S., 1972. Theory of the<br />
piezomagnetic effect in Titanomagnetic bearing rocks,<br />
Pageoph, 97, 146-155.<br />
Stacey, F.D. & Westcott, P., 1965. Seismomagnetic effectlimit<br />
of observability imposed by local <strong>variation</strong>s in<br />
geomagnetic disturbances, Nature, 206, 1209-1211.<br />
Stuart, W.D., Banks, P.O., Sasai. Y. & Liu S.W.,1995.<br />
Piezomagnetic field for Parkfield fault model, J.<br />
Geophys. Res., 100, 146-155.<br />
Utsugi, M., 2000. A computer program for the calculation<br />
74<br />
(Revised accepted2011 March 1, Received 2010 November 24)<br />
of piezomagnetic field due to a spherical pressure<br />
source ( Mogi model) in the inhomogeneously<br />
magnetized crust, J. Fac. Sci. Hokkaido Univ. Ser. 7,<br />
11, 739-751.<br />
Verma, R.K. & Banerjee, P., 1992. Nature of continental<br />
crust along the Narmada-Son lineament inferred from<br />
gravity and deep seismic sounding data,<br />
Tectonophysics, 202, 375-397.<br />
Waghmare, S.Y., 2003. Correlation of Satpura electrical<br />
conductivity anomaly with the Jabalpur earthquake<br />
of May 22, 1997, Jour. Geol. Soc. India, 62, 74-82.<br />
Waghmare, S.Y. & Arora, B.R., Pecova, J., 1996. Estimation<br />
of structural geometry of Satpura conductivity<br />
anomaly <strong>through</strong> the Hilbert Transformation of<br />
magneto<strong>variation</strong>al fields, Jour. Assoc. Expl. Geophys.,<br />
17, 165-175.<br />
Waghmare, S.Y., Carlo, L., Gawali, P.B. & Patil, A.G., 2008.<br />
<strong>Geomagnetic</strong> investigation in the seismoactive area<br />
of Narmada-Son Lineament, Central India, J. Ind.<br />
Geophys. Union, 12, 1-10.<br />
West, W.D., 1962. The line of Narmada-Valleys, Curr. Sci.,<br />
31, 143-144.<br />
Yukutake, T. & Tachinaka, H., 1967. <strong>Geomagnetic</strong> <strong>variation</strong><br />
associated with stress change within a semi-infinite<br />
elastic earth caused by a cylindrical force source, Bull.<br />
Earthq. Res. Inst. Univ. Tokyo, 45, 785-798.<br />
Zlotnicki, J. & Cornet, F.H., 1986. A numerical model of<br />
earthquake induced piezomagnetic <strong>anomalies</strong>, J.<br />
Geophys. Res., 91, 709-718.<br />
Zlotnicki, J. & Le Mouel, J.L., 1990. Possible electrokinetic<br />
origin of large magnetic <strong>variation</strong>s at La Fournaise<br />
volcano, Nature, 343 (62590), 633-636.
<strong>Geomagnetic</strong> <strong>secular</strong> <strong>variation</strong> <strong>anomalies</strong> <strong>investigated</strong> <strong>through</strong> tectonomagnetic monitoring<br />
in the seismoactive zone of the Narmada-Son Lineament, Central India<br />
Mr. Praveen B. Gawali was born in November 1967 at Kolhapur, Maharashtra. He obtained<br />
his M.Sc. from Karnataka University, Dharwar in 1992 and joined Indian Institute of<br />
Geomagnetism in 1993. Currently, he is working as a Technical Officer-II and his area of<br />
interest includes Environmental Magnetism. He has several research papers and popular<br />
science articles to his credit.<br />
Dr. S.Y. Waghmare was born in February 1951 at Pahadi, Maharashtra. He obtained his<br />
Ph.D. in Physics from Mumbai University in 1996. At present he holds a post of Associate<br />
Professor in Indian Institute of Geomagnetism. He has about 32 years of experience in<br />
the area of Solid Earth Geomagnetism, particularly research by <strong>Geomagnetic</strong> Depth<br />
Sounding (GDS) by conducting magnetometer arrays in specified regions in Himalayas<br />
and Central India. He was a Principal Investigator for tectonomagnetic studies in<br />
Earthquake prone Jabalpur area in the Narmada-Son Lineament, Central India. A number<br />
of research papers are to his credit, published in national and international journals.<br />
Mr. Louis Carlo was born in November 1953 at Mangalore, Karnataka. He joined the<br />
Indian Institute of Geomagnetism in 1975 and at present holds a post of Technical Officer-<br />
III. His areas of research interest consisted of Solid Earth Geomagnetism, Night Airglow,<br />
Tectonomagnetism and Environmental Magnetic Studies. He has contributed for many<br />
papers in Solid Earth Geomagnetism and Night Airglow.<br />
Mr. Arun Govind Patil was born in November 1955 at Mumbai. He got his B.Sc. degree<br />
from Mumbai University in 1973. He joined Indian Institute of Geomagnetism in 1980<br />
in the Instrumentation section. He has worked on the development of proton<br />
magnetometer. He has published two papers on data processing techniques using proton<br />
magnetometer. Currently, he is working as a Technical Officer –II.<br />
75
P.B.Gawali et al.<br />
76