Surface magneto-plasmons in magnetic multilayers - Walther ...
Surface magneto-plasmons in magnetic multilayers - Walther ...
Surface magneto-plasmons in magnetic multilayers - Walther ...

You also want an ePaper? Increase the reach of your titles
YUMPU automatically turns print PDFs into web optimized ePapers that Google loves.
Section 2.4<br />
Simulation of the reflectivity of surface <strong>plasmons</strong> 25<br />
2.4.1 <strong>Surface</strong> <strong>plasmons</strong> <strong>in</strong> different materials<br />
It is evident from Fig. 2.9 that there is a sharp surface plasmon resonance <strong>in</strong> silver.<br />
A similar analysis of other metals yields optimal layer thicknesses for Au, Ni, Co<br />
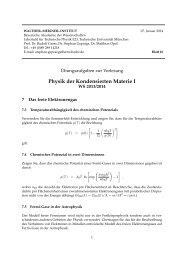
and are dAu,opt = 47 nm, dNi,opt = 15 nm, and dCo,opt = 12 nm as shown <strong>in</strong> Fig. 2.11.<br />
It shows that the optimal layer thickness for the <strong>magnetic</strong> materials Ni, and Co<br />
p (θS P P )<br />
R<br />
1 .0<br />
0 .8<br />
0 .6<br />
0 .4<br />
0 .2<br />
0 .0<br />
1 .0<br />
0 .8<br />
0 .6<br />
0 .4<br />
0 .2<br />
(a ) ε A u = -1 2 .1 + 1 .4 2 i<br />
(b )<br />
1 5 n m<br />
A u<br />
4 7 n m<br />
ε N i = -1 0 .4 + 1 5 .3 4 i<br />
N i<br />
0 .0<br />
0 2 0 4 0 6 0 8 0 1 0 0<br />
(c )<br />
1 2 n m<br />
la y e r th ic k n e s s [n m ]<br />
ε C o = -1 2 .9 + 1 8 .9 5 i<br />
C o<br />
1 .0<br />
0 .8<br />
0 .6<br />
0 .4<br />
0 .2<br />
0 .0<br />
0 2 0 4 0 6 0 8 0 1 0 0<br />
Figure 2.11: Simulation results for the reflectivity at θSPP plotted versus the layer thickness<br />
of (a) Au, (b) Ni , and (c) Co. The m<strong>in</strong>imum corresponds to the optimal layer<br />
thickness which is for gold 47 nm, for nickel15 nm, and for cobalt 12 nm.<br />
(15 nm, and 12 nm) are much smaller than those for the noble metals Au and Ag<br />
(47 nm, and 46 nm). Calculat<strong>in</strong>g the optimal layer thickness with Eq. (2.49) yields<br />
dAg,opt = 47.9 nm, dNi,opt = 15.7 nm, and dCo,opt = 13.3 nm. The deviation between<br />
calculated and numerically values can aga<strong>in</strong> be expla<strong>in</strong>ed by the resolution limit of<br />
the simulation. Like mentioned before the step size of the simulation is 0.1 ◦ . An<br />
other reason for the deviation might be that Eq. (2.49) is only an approximation.<br />
The R p curves of the three materials for the respective dopt are shown <strong>in</strong> Fig. 2.12. For<br />
the noble metal gold, a clear surface plasmon resonance at θSPP = 43.8 ◦ can be seen.<br />
The R p (θ) evolution shows a similar behaviour like for a silver layer. In contrast, the