

2012 Sustainability selection - SBM Offshore
2012 Sustainability selection - SBM Offshore
2012 Sustainability selection - SBM Offshore

Create successful ePaper yourself
Turn your PDF publications into a flip-book with our unique Google optimized e-Paper software.
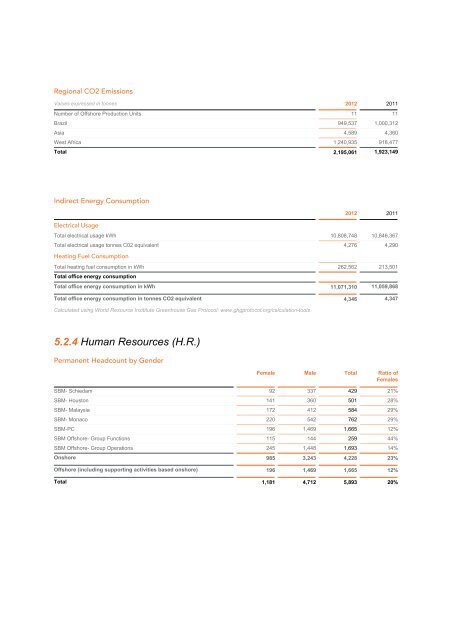
Regional CO2 Emissions<br />
Values expressed in tonnes <strong>2012</strong> 2011<br />
Number of <strong>Offshore</strong> Production Units 11 11<br />
Brazil 949,537 1,000,312<br />
Asia 4,589 4,360<br />
West Africa 1,240,935 918,477<br />
Total 2,195,061 1,923,149<br />
Indirect Energy Consumption<br />
Electrical Usage<br />
<strong>2012</strong> 2011<br />
Total electrical usage kWh 10,808,748 10,846,367<br />
Total electrical usage tonnes C02 equivalent 4,276 4,290<br />
Heating Fuel Consumption<br />
Total heating fuel consumption in kWh 262,562 213,501<br />
Total office energy consumption<br />
Total office energy consumption in kWh 11,071,310 11,059,868<br />
Total office energy consumption in tonnes CO2 equivalent 4,346 4,347<br />
Calculated using World Resource Insititute Greenhouse Gas Protocol: www.ghgprotocol.org/calculation-tools<br />
5.2.4 Human Resources (H.R.)<br />
Permanent Headcount by Gender<br />
Female Male Total Ratio of<br />
Females<br />
<strong>SBM</strong>- Schiedam 92 337 429 21%<br />
<strong>SBM</strong>- Houston 141 360 501 28%<br />
<strong>SBM</strong>- Malaysia 172 412 584 29%<br />
<strong>SBM</strong>- Monaco 220 542 762 29%<br />
<strong>SBM</strong>-PC 196 1,469 1,665 12%<br />
<strong>SBM</strong> <strong>Offshore</strong>- Group Functions 115 144 259 44%<br />
<strong>SBM</strong> <strong>Offshore</strong>- Group Operations 245 1,448 1,693 14%<br />
Onshore 985 3,243 4,228 23%<br />
<strong>Offshore</strong> (including supporting activities based onshore) 196 1,469 1,665 12%<br />
Total 1,181 4,712 5,893 20%


