mapinfomag_spring200..
mapinfomag_spring200..
mapinfomag_spring200..

Create successful ePaper yourself
Turn your PDF publications into a flip-book with our unique Google optimized e-Paper software.
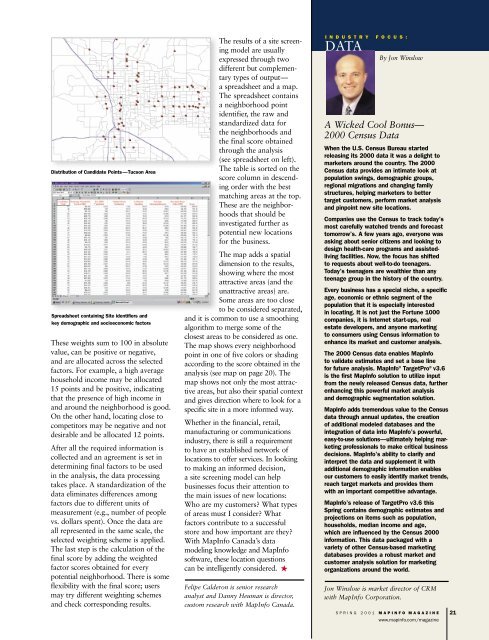
Distribution of Candidate Points—Tucson Area<br />
Spreadsheet containing Site identifiers and<br />
key demographic and socioeconomic factors<br />
These weights sum to 100 in absolute<br />
value, can be positive or negative,<br />
and are allocated across the selected<br />
factors. For example, a high average<br />
household income may be allocated<br />
15 points and be positive, indicating<br />
that the presence of high income in<br />
and around the neighborhood is good.<br />
On the other hand, locating close to<br />
competitors may be negative and not<br />
desirable and be allocated 12 points.<br />
After all the required information is<br />
collected and an agreement is set in<br />
determining final factors to be used<br />
in the analysis, the data processing<br />
takes place. A standardization of the<br />
data eliminates differences among<br />
factors due to different units of<br />
measurement (e.g., number of people<br />
vs. dollars spent). Once the data are<br />
all represented in the same scale, the<br />
selected weighting scheme is applied.<br />
The last step is the calculation of the<br />
final score by adding the weighted<br />
factor scores obtained for every<br />
potential neighborhood. There is some<br />
flexibility with the final score; users<br />
may try different weighting schemes<br />
and check corresponding results.<br />
The results of a site screening<br />
model are usually<br />
expressed through two<br />
different but complementary<br />
types of output—<br />
a spreadsheet and a map.<br />
The spreadsheet contains<br />
a neighborhood point<br />
identifier, the raw and<br />
standardized data for<br />
the neighborhoods and<br />
the final score obtained<br />
through the analysis<br />
(see spreadsheet on left).<br />
The table is sorted on the<br />
score column in descending<br />
order with the best<br />
matching areas at the top.<br />
These are the neighborhoods<br />
that should be<br />
investigated further as<br />
potential new locations<br />
for the business.<br />
The map adds a spatial<br />
dimension to the results,<br />
showing where the most<br />
attractive areas (and the<br />
unattractive areas) are.<br />
Some areas are too close<br />
to be considered separated,<br />
and it is common to use a smoothing<br />
algorithm to merge some of the<br />
closest areas to be considered as one.<br />
The map shows every neighborhood<br />
point in one of five colors or shading<br />
according to the score obtained in the<br />
analysis (see map on page 20). The<br />
map shows not only the most attractive<br />
areas, but also their spatial context<br />
and gives direction where to look for a<br />
specific site in a more informed way.<br />
Whether in the financial, retail,<br />
manufacturing or communications<br />
industry, there is still a requirement<br />
to have an established network of<br />
locations to offer services. In looking<br />
to making an informed decision,<br />
a site screening model can help<br />
businesses focus their attention to<br />
the main issues of new locations:<br />
Who are my customers? What types<br />
of areas must I consider? What<br />
factors contribute to a successful<br />
store and how important are they?<br />
With MapInfo Canada’s data<br />
modeling knowledge and MapInfo<br />
software, these location questions<br />
can be intelligently considered.<br />
Felipe Calderon is senior research<br />
analyst and Danny Heuman is director,<br />
custom research with MapInfo Canada.<br />
I N D U S T R Y F O C U S :<br />
DATA<br />
By Jon Winslow<br />
A Wicked Cool Bonus—<br />
2000 Census Data<br />
When the U.S. Census Bureau started<br />
releasing its 2000 data it was a delight to<br />
marketers around the country. The 2000<br />
Census data provides an intimate look at<br />
population swings, demographic groups,<br />
regional migrations and changing family<br />
structures, helping marketers to better<br />
target customers, perform market analysis<br />
and pinpoint new site locations.<br />
Companies use the Census to track today’s<br />
most carefully watched trends and forecast<br />
tomorrow’s. A few years ago, everyone was<br />
asking about senior citizens and looking to<br />
design health-care programs and assistedliving<br />
facilities. Now, the focus has shifted<br />
to requests about well-to-do teenagers.<br />
Today’s teenagers are wealthier than any<br />
teenage group in the history of the country.<br />
Every business has a special niche, a specific<br />
age, economic or ethnic segment of the<br />
population that it is especially interested<br />
in locating. It is not just the Fortune 1000<br />
companies, it is Internet start-ups, real<br />
estate developers, and anyone marketing<br />
to consumers using Census information to<br />
enhance its market and customer analysis.<br />
The 2000 Census data enables MapInfo<br />
to validate estimates and set a base line<br />
for future analysis. MapInfo ® TargetPro ® v3.6<br />
is the first MapInfo solution to utilize input<br />
from the newly released Census data, further<br />
enhancing this powerful market analysis<br />
and demographic segmentation solution.<br />
MapInfo adds tremendous value to the Census<br />
data through annual updates, the creation<br />
of additional modeled databases and the<br />
integration of data into MapInfo’s powerful,<br />
easy-to-use solutions—ultimately helping marketing<br />
professionals to make critical business<br />
decisions. MapInfo’s ability to clarify and<br />
interpret the data and supplement it with<br />
additional demographic information enables<br />
our customers to easily identify market trends,<br />
reach target markets and provides them<br />
with an important competitive advantage.<br />
MapInfo’s release of TargetPro v3.6 this<br />
Spring contains demographic estimates and<br />
projections on items such as population,<br />
households, median income and age,<br />
which are influenced by the Census 2000<br />
information. This data packaged with a<br />
variety of other Census-based marketing<br />
databases provides a robust market and<br />
customer analysis solution for marketing<br />
organizations around the world.<br />
Jon Winslow is market director of CRM<br />
with MapInfo Corporation.<br />
SPRING 2001 MAPINFO MAGAZINE<br />
www.mapinfo.com/magazine<br />
21