71 - Indian Academy of Sciences
71 - Indian Academy of Sciences
71 - Indian Academy of Sciences

Create successful ePaper yourself
Turn your PDF publications into a flip-book with our unique Google optimized e-Paper software.
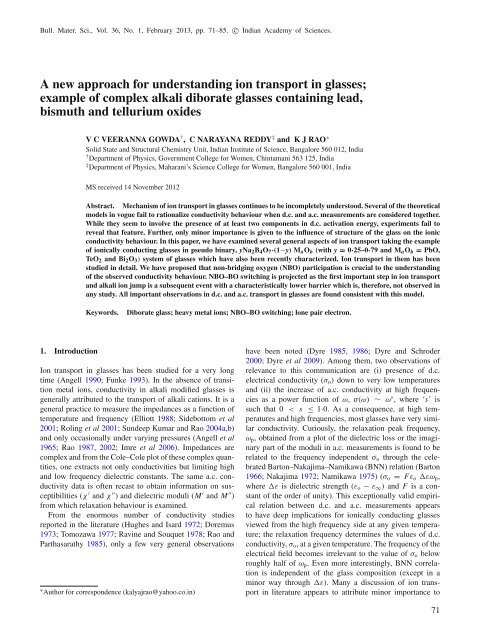
Bull. Mater. Sci., Vol. 36, No. 1, February 2013, pp. <strong>71</strong>–85. c○ <strong>Indian</strong> <strong>Academy</strong> <strong>of</strong> <strong>Sciences</strong>.<br />
A new approach for understanding ion transport in glasses;<br />
example <strong>of</strong> complex alkali diborate glasses containing lead,<br />
bismuth and tellurium oxides<br />
1. Introduction<br />
V C VEERANNA GOWDA † , C NARAYANA REDDY ‡ and K J RAO ∗<br />
Solid State and Structural Chemistry Unit, <strong>Indian</strong> Institute <strong>of</strong> Science, Bangalore 560 012, India<br />
† Department <strong>of</strong> Physics, Government College for Women, Chintamani 563 125, India<br />
‡ Department <strong>of</strong> Physics, Maharani’s Science College for Women, Bangalore 560 001, India<br />
MS received 14 November 2012<br />
Abstract. Mechanism <strong>of</strong> ion transport in glasses continues to be incompletely understood. Several <strong>of</strong> the theoretical<br />
models in vogue fail to rationalize conductivity behaviour when d.c. and a.c. measurements are considered together.<br />
While they seem to involve the presence <strong>of</strong> at least two components in d.c. activation energy, experiments fail to<br />
reveal that feature. Further, only minor importance is given to the influence <strong>of</strong> structure <strong>of</strong> the glass on the ionic<br />
conductivity behaviour. In this paper, we have examined several general aspects <strong>of</strong> ion transport taking the example<br />
<strong>of</strong> ionically conducting glasses in pseudo binary, yNa2B4O7·(1−y) MaOb (with y = 0·25–0·79 and MaOb = PbO,<br />
TeO2 and Bi2O3) system <strong>of</strong> glasses which have also been recently characterized. Ion transport in them has been<br />
studied in detail. We have proposed that non-bridging oxygen (NBO) participation is crucial to the understanding<br />
<strong>of</strong> the observed conductivity behaviour. NBO–BO switching is projected as the first important step in ion transport<br />
and alkali ion jump is a subsequent event with a characteristically lower barrier which is, therefore, not observed in<br />
any study. All important observations in d.c. and a.c. transport in glasses are found consistent with this model.<br />
Keywords. Diborate glass; heavy metal ions; NBO–BO switching; lone pair electron.<br />
Ion transport in glasses has been studied for a very long<br />
time (Angell 1990; Funke 1993). In the absence <strong>of</strong> transition<br />
metal ions, conductivity in alkali modified glasses is<br />
generally attributed to the transport <strong>of</strong> alkali cations. It is a<br />
general practice to measure the impedances as a function <strong>of</strong><br />
temperature and frequency (Elliott 1988; Sidebottom et al<br />
2001; Roling et al 2001; Sundeep Kumar and Rao 2004a,b)<br />
and only occasionally under varying pressures (Angell et al<br />
1965; Rao1987, 2002; Imreet al 2006). Impedances are<br />
complex and from the Cole–Cole plot <strong>of</strong> these complex quantities,<br />
one extracts not only conductivities but limiting high<br />
and low frequency dielectric constants. The same a.c. conductivity<br />
data is <strong>of</strong>ten recast to obtain information on susceptibilities<br />
(χ ′ and χ ′′ ) and dielectric moduli (M ′ and M ′′ )<br />
from which relaxation behaviour is examined.<br />
From the enormous number <strong>of</strong> conductivity studies<br />
reported in the literature (Hughes and Isard 1972; Doremus<br />
1973; Tomozawa 1977; Ravine and Souquet 1978; Rao and<br />
Parthasarathy 1985), only a few very general observations<br />
∗ Author for correspondence (kalyajrao@yahoo.co.in)<br />
have been noted (Dyre 1985, 1986; Dyre and Schroder<br />
2000; Dyreet al 2009). Among them, two observations <strong>of</strong><br />
relevance to this communication are (i) presence <strong>of</strong> d.c.<br />
electrical conductivity (σo) down to very low temperatures<br />
and (ii) the increase <strong>of</strong> a.c. conductivity at high frequencies<br />
as a power function <strong>of</strong> ω, σ(ω) ∼ ω s , where ‘s’ is<br />
such that 0 < s ≤ 1·0. As a consequence, at high temperatures<br />
and high frequencies, most glasses have very similar<br />
conductivity. Curiously, the relaxation peak frequency,<br />
ωp, obtained from a plot <strong>of</strong> the dielectric loss or the imaginary<br />
part <strong>of</strong> the moduli in a.c. measurements is found to be<br />
related to the frequency independent σo through the celebrated<br />
Barton–Nakajima–Namikawa (BNN) relation (Barton<br />
1966; Nakajima 1972; Namikawa1975) (σo = Fεo εωp,<br />
where ε is dielectric strength (εo − ε∞) and F is a constant<br />
<strong>of</strong> the order <strong>of</strong> unity). This exceptionally valid empirical<br />
relation between d.c. and a.c. measurements appears<br />
to have deep implications for ionically conducting glasses<br />
viewed from the high frequency side at any given temperature;<br />
the relaxation frequency determines the values <strong>of</strong> d.c.<br />
conductivity, σo, at a given temperature. The frequency <strong>of</strong> the<br />
electrical field becomes irrelevant to the value <strong>of</strong> σo below<br />
roughly half <strong>of</strong> ωp. Even more interestingly, BNN correlation<br />
is independent <strong>of</strong> the glass composition (except in a<br />
minor way through ε). Many a discussion <strong>of</strong> ion transport<br />
in literature appears to attribute minor importance to<br />
<strong>71</strong>
72 V C Veeranna Gowda, C Narayana Reddy and K J Rao<br />
the influence <strong>of</strong> structure <strong>of</strong> the glasses to their conductivity<br />
behaviour. We should like to examine this feature in some<br />
detail.<br />
We have investigated a.c. conductivity and dielectric relaxation<br />
behaviour <strong>of</strong> sodium diborate glasses. Alkali diborates<br />
are a particular combination in the pseudo-binary<br />
alkali-B2O3 system <strong>of</strong> glasses (further) modified by the<br />
addition <strong>of</strong> heavy metal oxides, PbO, Bi2O3 and TeO2. Diborate<br />
ions generally tend to be present as tightly bound<br />
bicyclic units consisting <strong>of</strong> two trigonally and two tetrahedrally<br />
bonded boron atoms in alternate positions <strong>of</strong> the ring.<br />
The two negative charges on the diborate unit are delocalized<br />
on the whole structure. The unit behaves like a tetra coordinated<br />
single entity. But structure <strong>of</strong> the diborate unit can be<br />
disrupted to certain extent by adding PbO (Veeranna Gowda<br />
et al 2007). The disruption is, however, much less when TeO2<br />
is added. The diborate structure is essentially unaffected by<br />
Bi2O3. In the case <strong>of</strong> PbO also, diborate unit is stable against<br />
disruption when PbO concentration is lower than ∼30% in<br />
the pseudo-binary Na2B4O7 – PbO glasses.<br />
The modifiers used here viz. PbO, Bi2O3 and TeO2 contain<br />
lone pair bearing ions, Pb 2+ ,Bi 3+ and Te 4+ .Wehave<br />
in our earlier studies (Veeranna Gowda et al 2007) obtained<br />
spectroscopic (MAS NMR) evidence to show that the B4/B3<br />
ratio remains unaltered and near unity in all glass compositions.<br />
We have also shown that the tightly bound diborate<br />
units only open up into larger rings or chains in order<br />
to provide additional oxygen coordination required by Pb 2+<br />
in high PbO glasses. Lead atoms have been found to prefer<br />
four coordinated network positions when PbO concentration<br />
is high. TeO2 appears to make a sub-network in Na2B4O7 –<br />
TeO2 glasses and it is present in both trigonal bypyramidal<br />
(tbp), and trigonal pyramidal (tp), configurations (Rao and<br />
Harish Bhat 2001). TeO2 network appears to permeate the<br />
extensive diborate network. Bi2O3 seems to form BiO3/2 networks<br />
which integrate into the diborate network in such a<br />
way that bismuth occupies six coordinated position utilizing<br />
oxygen atoms <strong>of</strong> the borate network (Veeranna Gowda et al<br />
2007).<br />
Our attention here is focused on understanding how ion<br />
transport takes place in such a matrix and still exhibit the<br />
earlier mentioned general features <strong>of</strong> ion transport. There are<br />
two special features <strong>of</strong> these glasses and they are (i) the negative<br />
charges on diborate units are diffuse and (ii) the cations<br />
(Pb, Bi and Te) carry lone pair electrons. It is well known<br />
that these lone pairs are stereochemically active (Galy and<br />
Meunier 1975). We should like to examine how the measured<br />
transport parameters help us to understand ion transport<br />
mechanisms.<br />
In the next section, we describe the experimental studies<br />
conducted in these glasses over wide frequency and temperature<br />
ranges and the manner <strong>of</strong> acquisition and analysis<br />
<strong>of</strong> the data. In the subsequent ‘results and discussion’<br />
section, we analyse our observation using several currently<br />
popular models <strong>of</strong> ion transport in glasses and show that it<br />
is very likely that in these oxide glasses the non-bridging<br />
oxygens (NBOs) play a significant role in ion transport. We<br />
also examine several general aspects <strong>of</strong> ion transport discussed<br />
in the literature from the perspective <strong>of</strong> dominant<br />
NBO participation.<br />
2. Experimental<br />
Three glass systems have been prepared with the pseudobinary<br />
compositions, yNa2B4O7·(1−y) MaOb and y has<br />
been varied from 0·25 to 0·79. These glasses are actually<br />
ternaries <strong>of</strong> composition, xNa2O·2xB2O3·(1−3x)MaOb<br />
and the equivalence in composition requires y = 3x<br />
so that the ternary glass composition expressed through<br />
y is (y/3)Na2O·(2y/3)B2O3·(1−y)MaOb. The series <strong>of</strong><br />
glasses have been designated as pseudo-binary NBP<br />
(sodium diborate–lead oxide), NBT (sodium diborate–<br />
tellurium oxide) and NBB (sodium diborate–bismuth oxide)<br />
glasses, respectively. Reagent grade H3BO3, TeO2, Bi2O3,<br />
PbO and Na2CO3·H2O were used as the starting materials.<br />
The starting materials were weighed in required<br />
proportions and the components were thoroughly mixed<br />
by grinding together and were heated in ceramic crucibles<br />
at 450 ◦ C for 30 min to get rid <strong>of</strong> water. During<br />
heating, CO2 gets removed through decomposition.<br />
The batches melt between 900 ◦ C and 1200 ◦ C depending<br />
on the composition. The glass samples were obtained<br />
by quenching the melt between brass blocks pre-heated<br />
(≈120 ◦ C) which prevents cracking <strong>of</strong> the samples due<br />
to thermal strains. Later, the samples were annealed by<br />
holding them just below their glass transition temperatures<br />
for 6 h and slowly cooling them to laboratory temperature.<br />
Samples were polished under dry condition using<br />
silicon carbide powder (nos 320 and 400 Carborundum,<br />
Manchester-17, UK) to obtain flat parallel surfaces. Such<br />
sample geometries are suitable for electrical conductivity<br />
measurements.<br />
0·21Na2B4O7·0·79PbO/Bi2O3 glasses were slightly yellowish<br />
in colour. Glasses were quite stable in air and did not<br />
exhibit any hygroscopicity. However, slight loss <strong>of</strong> PbO and<br />
Bi2O3 during homogenization <strong>of</strong> the melt at 1000–1200 ◦ C<br />
for a few min could not be ruled out. The composition given<br />
in table 1 refers to the nominal composition <strong>of</strong> the starting<br />
mixtures.<br />
Electrical conductivity measurements were carried out on<br />
a Hewlett Packard HP 4192A impedance gain phase analyser<br />
from 100 Hz to 10 MHz in the temperature range<br />
298–523 K. A home built cell assembly (2-terminal capacitor<br />
configuration and spring loaded silver electrodes) were<br />
used in all measurements. The sample temperature was measured<br />
using a Pt–Rh thermocouple positioned very close<br />
to the sample. The temperature was controlled using a<br />
Heatcon (Bangalore, India) temperature controller and the<br />
temperature constancy <strong>of</strong> ±1 K was achieved in the entire<br />
range <strong>of</strong> measurements. Annealed circular glass pieces,<br />
coated with silver paint on both sides and having a thickness<br />
<strong>of</strong> about 0·1 cm and a diameter <strong>of</strong> 1 cm were used for the<br />
measurements.
3. Analysis <strong>of</strong> data<br />
A new approach for understanding ion transport in glasses 73<br />
Table 1. The code, composition, σ dc, s and β (at 275 ◦ C) and Edc.<br />
σdc Scm −1 Edc T ∗ g<br />
Code Composition (mol%) (at 275 ◦ C) s β (eV) (K)<br />
Na2B4O7 PbO<br />
NBP1 75 25 1·55 × 10−7 0·65 – 1·15 618<br />
NBP2 50 50 1·78 × 10−8 0·53 0·92 1·20 613<br />
NBP3 33 67 – 0·54 0·96 1·26 597<br />
NBP4 21 79 – – – – 577<br />
NBT1<br />
Na2B4O7<br />
75<br />
TeO2<br />
25 2·63 × 10−6 0·49 0·92 0·91 685<br />
NBT2 50 50 2·06 × 10−7 0·52 0·78 1·06 646<br />
NBT3 33 67 1·16 × 10−8 0·47 0·91 1·10 616<br />
NBT4 21 79 8·31 × 10−10 0·53 – 1·12 591<br />
NBB1<br />
Na2B4O7<br />
75<br />
Bi2O3<br />
25 6·79 × 10−7 0·55 0·92 0·96 665<br />
NBB2 50 50 3·02 × 10−8 0·56 0·81 0·94 650<br />
NBB3 33 67 1·83 × 10−9 0·57 – 1·02 636<br />
NBB4 21 79 6·52 × 10−9 0·73 – 0·98 612<br />
∗ Reported in our earlier studies (Veeranna Gowda et al 2007)<br />
The capacitance (Cp) and conductance (G) <strong>of</strong> all the samples<br />
were measured from the impedance analyser. These<br />
were used to evaluate real and imaginary parts <strong>of</strong> the complex<br />
impedance using standard relations (Macdonald 1983;<br />
Sundeep Kumar and Rao 2004b),<br />
Z ∗ = Z ′ + jZ ′′ =<br />
1<br />
, (1)<br />
G + jωCp<br />
Z ′ = <br />
G<br />
G2 + ω2C 2 p<br />
, (2)<br />
Z ′′ = <br />
ωGp<br />
G2 + ω2C 2 p<br />
. (3)<br />
The d.c. conductances were determined from the semicircular<br />
complex impedance (Z ′ vs Z ′′ ) plots by taking the value<br />
<strong>of</strong> intersection <strong>of</strong> the low frequency end <strong>of</strong> the semicircle on<br />
Z ′ axis. The conductivity (σ) for each sample was calculated<br />
using the expression<br />
<br />
d<br />
σ = G , (4)<br />
A<br />
where d and A are the thickness and area <strong>of</strong> the sample,<br />
respectively.<br />
The real (ε ′ ) and imaginary (ε ′′ ) parts <strong>of</strong> the complex<br />
dielectric constant were calculated using the relations,<br />
ε ′ = Cpd<br />
, (5)<br />
Aε0<br />
ε ′′ = σ<br />
, (6)<br />
ε0ω<br />
where ε0 is the permittivity <strong>of</strong> the free space which has a<br />
value <strong>of</strong> 8·854 × 10−14 Fcm−1 .<br />
The data were also analysed using the electrical modulus<br />
formalism (Macedo et al 1972). The real (M ′ ) and<br />
imaginary (M ′′ ) parts <strong>of</strong> the complex electrical modulus<br />
(M ∗ = 1/ε∗ ) were obtained from ε ′ and ε ′′ values using the<br />
relations,<br />
M ′ =<br />
M ′′ =<br />
ε ′<br />
, (7)<br />
ε ′2 + ε ′′2<br />
ε ′′<br />
. (8)<br />
ε ′2 + ε ′′2<br />
4. Results and discussion<br />
The compositions <strong>of</strong> the glasses investigated and their codes<br />
are presented in table 1. In the binaries, concentrations<br />
<strong>of</strong> lead, tellurium and bismuth have been systematically<br />
increased from 25 to 79%. It is interesting to note at the outset<br />
that up to 80 mole% lone pair metal oxides (LPM) can<br />
be stuffed into sodium diborate without losing glass forming<br />
ability.<br />
4.1 D.C. conductivity<br />
Cole–Cole plots at four different temperatures for the TeO2<br />
containing NBT1 glass is presented in figure 1. This is typical
74 V C Veeranna Gowda, C Narayana Reddy and K J Rao<br />
Z"<br />
1.5x10 6 NBT1<br />
1.0x10 6<br />
5.0x10 5<br />
0.0<br />
0.0 5.0x10 5<br />
Z'<br />
1.0x10 6<br />
175 0 C<br />
200 0 C<br />
225 0 C<br />
250 0 C<br />
1.5x10 6<br />
Figure 1. Cole–Cole plot for NBT1 glass at different<br />
temperatures.<br />
log( σ)<br />
-5<br />
-6<br />
-7<br />
-8<br />
-9<br />
-10<br />
-11<br />
(a)<br />
1.8 1.9 2.0<br />
(1000/T) K -1<br />
log( ) Scm -1<br />
σ<br />
-5<br />
-6<br />
-7<br />
-8<br />
-9<br />
-10<br />
(c)<br />
NBP1<br />
NBP2<br />
NBP3<br />
<strong>of</strong> all the glasses investigated here. The semi-circles <strong>of</strong> the<br />
impedance plot, Z ′′ vs Z ′ , measured over a frequency range<br />
100 Hz to 10 MHz yield points <strong>of</strong> intersection on the real axis<br />
(corresponding to 0 or ∞ frequency values <strong>of</strong> impedance).<br />
Along with the geometry <strong>of</strong> the samples, it enables evaluation<br />
<strong>of</strong> resistivities. D.C. conductivities have been calculated<br />
using the resistivity values from the intersection point<br />
at ω = 0. In figures 2 (a), (b) and (c), Arrhenius plots <strong>of</strong><br />
the measured conductivities are shown for all the three systems<br />
and the activation barriers calculated from the slopes are<br />
given in table 1. The variation <strong>of</strong> the conductivity as a function<br />
<strong>of</strong> concentration <strong>of</strong> LPM oxide is shown in figures 3a<br />
and b, the variation is nearly linear at any given temperature<br />
for NBP and NBT glasses. Only in the case <strong>of</strong> NBB glasses,<br />
the conductivity begins to increase above 70 mol% <strong>of</strong> Bi2O3<br />
(figure 3c). The entire d.c. conductivity behaviour appears to<br />
be consistent with a structural model <strong>of</strong> these glasses proposed<br />
by us earlier (Muthupari et al 1996). As pointed out<br />
earlier the principal feature <strong>of</strong> this model is that the glass<br />
structure is made up <strong>of</strong> tightly bound diborate units. The<br />
conductivity is, therefore, determined by influence <strong>of</strong> the<br />
log( σ)<br />
-5<br />
-6<br />
-7<br />
-8<br />
-9<br />
-10<br />
-11<br />
-12<br />
1.7 1.8 1.9 2.0 2.1 2.2<br />
1000/T (K -1 )<br />
(b)<br />
1.8 1.9 2.0 2.1 2.2 2.3 2.4<br />
NBB1<br />
NBB2<br />
NBB3<br />
NBB4<br />
Figure 2. Variation <strong>of</strong> log(σdc) vs 1000/T for (a) NBP,(b) NBTand(c) NBB glasses.<br />
1000/T (K -1 )<br />
NBT1<br />
NBT2<br />
NBT3<br />
NBT4
size <strong>of</strong> diborate ion as long as the structural integrity <strong>of</strong><br />
the diborate units is preserved. Diborate units are large ions<br />
with diffuse negative charge and with four covalent bonding<br />
(to other entities) points as shown below (Veeranna Gowda<br />
et al 2007).<br />
log( σ ) S/cm<br />
dc<br />
-5<br />
-6<br />
-7<br />
-8<br />
-9<br />
-10<br />
-11<br />
8<br />
225 o C<br />
250 o C<br />
275 o C<br />
A new approach for understanding ion transport in glasses 75<br />
2-<br />
Na B O mol%<br />
2 4 7<br />
-5<br />
log( σ ) S/cm<br />
dc<br />
-6<br />
-7<br />
-8<br />
-9<br />
-10<br />
-11<br />
200 o C<br />
225 o C<br />
250 o C<br />
275 o C<br />
B<br />
O<br />
(a)<br />
20 30 40 50 60 70 80<br />
log( σ ) S/cm<br />
dc<br />
When other oxides are added to a pure diborate glass and<br />
if they do not interfere with the basic diborate glass structure,<br />
the structure gets expanded resulting in larger voids.<br />
This leads to lowering <strong>of</strong> activation barriers and enhancement<br />
<strong>of</strong> conductivities. But added lead oxide disturbs diborate<br />
glass structure. It breaks open the tight diborate unit and<br />
in the process leads to denser packing <strong>of</strong> the components <strong>of</strong><br />
the glass structure. Pb atoms themselves have a tendency to<br />
form four coordinated [PbO2/2O2] 2− . These [PbO2/2O2] 2−<br />
units are covalently bonded and integrated into the structure.<br />
The resulting dense packing along with the presence <strong>of</strong><br />
stereochemically active (SCA) lone pair reduces the mobility<br />
<strong>of</strong> charge carriers. Lone pairs produce an electrical drag on<br />
positively charged mobile cations like Na + . Therefore, addition<br />
<strong>of</strong> PbO has two effects both <strong>of</strong> which increase in the<br />
same direction with its concentration in diborate glass and<br />
both tend to reduce conductivity. This is consistent with σdc<br />
variation with PbO concentration as shown in figure 3a.<br />
Similar but not identical situation occurs with TeO2 addition<br />
to NBT glasses. TeO2 forms connected tbp units (see<br />
below) permeating diborate network in the glass.<br />
-5<br />
-6<br />
-7<br />
-8<br />
-9<br />
-10<br />
-11<br />
200 o C<br />
225 o C<br />
250 o C<br />
275 o C<br />
20 30 40 50 60 70 80<br />
Na 2 B 4 O 7 mol%<br />
20 30 40 50 60 70 80<br />
(c)<br />
Na 2 B 4 O 7 mol%<br />
Figure 3. Variation <strong>of</strong> log(σ)vs Na2B4O7 mol% for (a) NBP,(b)NBTand(c) NBB glasses.<br />
(b)
76 V C Veeranna Gowda, C Narayana Reddy and K J Rao<br />
Trigonal bipyramidal (tbp) Trigonal pyramidal (tp)<br />
As the concentration <strong>of</strong> TeO2 increases the molar volume<br />
<strong>of</strong> glass decreases as a function <strong>of</strong> TeO2 concentration<br />
for reasons <strong>of</strong> better space filling compared to pure diborate<br />
glass structure. There is good spectroscopic evidence<br />
(Veeranna Gowda et al 2007) to believe that TeO2 interacts<br />
very little with diborate network. The lone pair on tellurium<br />
has the same dragging (mobility hindering) effect on alkali<br />
ions. Therefore, the conductivity behaviour observed in NBT<br />
glasses in figure 3b is quite as expected. In NBB glasses with<br />
Bi2O3 concentration <strong>of</strong> >70 mol%, the conductivity varies<br />
anomalously. This is likely to be due to slightly enhanced<br />
mobilities associated with bond switching efficiency and will<br />
be discussed later.<br />
4.2 Alkali ion transport models<br />
The present understanding <strong>of</strong> the mechanism <strong>of</strong> d.c. conduction<br />
suffers from serious conceptual deficiencies (Rao<br />
et al 1993). The earliest modeling <strong>of</strong> conductivity was by<br />
Anderson and Stuart (A–S). This is essentially a strong electrolyte<br />
model (Anderson and Stuart 1954). It considers the<br />
alkali oxide to have reacted completely with the network<br />
former creating non-bridging oxygens and free alkali ions.<br />
The model treats all alkali ions as effective charge carriers.<br />
The motion <strong>of</strong> alkali ions occurs in a medium <strong>of</strong> randomly<br />
distributed but positionally fixed non-bridging oxygens<br />
(NBOs) <strong>of</strong> same concentration as alkali ions. Alkali ions<br />
reside close to NBOs. The migration <strong>of</strong> alkali ion requires<br />
two equivalent positions near two distinct NBOs. As the<br />
alkali ion moves from one to the other equivalent position,<br />
it overcomes a coulombic barrier and also a mechanical<br />
barrier since it has to move through a ‘bottle neck’<br />
created by oxygens. The bottle neck position generally<br />
(but not necessarily) consists <strong>of</strong> three oxygen atoms touching<br />
each other. Thus A–S theory considers that activation barrier,<br />
Ea = Ec + Es (where Ec is the columbic barrier and<br />
Es the strain energy barrier which arises from the mechanical<br />
hindrance). Ravine and Souquet (1977) did not consider<br />
all alkali ions as candidates for conduction. They considered<br />
alkali oxides as partially ionized like Na2O ⇋ Na + + NaO −<br />
providing an equilibrium concentration <strong>of</strong> Na + ions which are<br />
considered as mobile. The generation <strong>of</strong> these ions requires<br />
an energy expenditure equal to H/2, where H is the<br />
enthalpy <strong>of</strong> the above reaction. Na + , however, would require<br />
to overcome the mechanical barrier, Em (same as Es <strong>of</strong><br />
A–S model). Therefore, in the weak electrolyte theory <strong>of</strong><br />
R–S, Ea = H/2 + Em.<br />
Thus in the analysis <strong>of</strong> the conductivities, Ea has been<br />
generally treated as constituted <strong>of</strong> two components in these<br />
theories. This feature was emphasized in a later analysis by<br />
Martin and Angell (see their barrier cartoon in the reference<br />
Martin and Angell 1986). However, in the analysis <strong>of</strong> Martin<br />
and Angell, there appears to be a conceptual leaning towards<br />
R–S approach, because, the columbic and mechanical barriers<br />
are not merged and the process <strong>of</strong> activation appears<br />
to involve a metastable state for it to build up a finite concentration<br />
<strong>of</strong> candidate ions which later undergo migration.<br />
But none <strong>of</strong> the reported experiments reveals the presence<br />
<strong>of</strong> two or two-stage barrier. All conductivity measurements<br />
reported so far reveal the presence <strong>of</strong> only a single characteristic<br />
migration barrier. This single barrier feature is observed<br />
even in mixed alkali glasses (Harish Bhat et al 2004a,b).<br />
The statistics <strong>of</strong> conductivity data available on activation<br />
barriers is interesting. We have collected in figures 4<br />
a, b, c and d, measured activation barriers in four different<br />
categories <strong>of</strong> glasses, phosphates, borates, silicates and<br />
other oxide glass systems particularly those containing PbO,<br />
TeO2 and Bi2O3 (and their combinations) (Mazurin and<br />
Borisovskii 1957; Isard 1959; Charles 1966; Terai 1969;<br />
Hakim and Uhlmann 19<strong>71</strong>; Bartholomew 1973; Ravaine<br />
et al 1975; Han et al 1979; Hunter and Ingram 1984;<br />
Ravine 1985; Martin and Angell 1986; De Marchi et al 1988;<br />
Gandhi et al 1989; Chen et al 1992; Chryssikos et al 1998;<br />
Souquet et al 1998; Pan and Ghosh 1999a, b; Altaf et al 2001;<br />
Gao and Cramer 2005; Veeranna Gowda and Anavekar 2005;<br />
Murugaraj 2007; Al-Assiri et al 2008). The x-axis has been<br />
chosen to represent the mole fraction <strong>of</strong> the so called network<br />
T<br />
O
Ea (eV)<br />
Ea (eV)<br />
1.6<br />
1.2<br />
0.8<br />
0.4<br />
0.0<br />
0<br />
1.6<br />
1.2<br />
0.8<br />
0.4<br />
Li 2 O-P 2 O 5<br />
Li 2 O-P 2 O 5<br />
Na 2 O-P 2 O 5<br />
Li 2 O-Na 2 O-P 2 O 5<br />
A new approach for understanding ion transport in glasses 77<br />
(a)<br />
0.0<br />
20 40 60 80 100 0 20 40 60 80 100<br />
P2O5 mol%<br />
SiO mol% 2<br />
Li2O-B2O3 Li2O-B2O3 Li2O-B2O3 Li2O-B2O3 Li2O-B2O3 Li2O-B2O3 Na2O-B2O3 Na2O-B2O3 Na2O-B2O3 Na2O-B2O3 Na2O-B2O3 K2O-B2O3 Rb2O-B2O3 Cs2O-B2O3 Li2O-Na2O-B2O3 Li2O-Na2O-B2O3 Li2O-K2O-B2O3 Na2O-K2O-B2O3 Li2O-Na2O-K2O-B2O3 0.0<br />
0.0<br />
0 20 40 60 80 100 0 20 40 60 80 100<br />
B O 2 3<br />
mol%<br />
(b)<br />
Ea (eV)<br />
E a (eV)<br />
1.6<br />
1.2<br />
0.8<br />
0.4<br />
1.6<br />
1.2<br />
0.8<br />
0.4<br />
Na 2 O-SiO 2<br />
Na 2 O-SiO 2<br />
Na 2 O-SiO 2<br />
Na 2 O-SiO 2<br />
Li 2 O-Na 2 O-SiO 2<br />
Na 2 O-K 2 O-SiO 2<br />
Na 2 O-Rb 2 O-SiO 2<br />
Na 2 O-Cs 2 O-SiO 2<br />
Cs 2 O-Rb 2 O-SiO 2<br />
Li 2 O-cs 2 O-SiO 2<br />
Li 2 O-Bi 2 O 3<br />
Na 2 O-Bi 2 O 3<br />
Li 2 O-TeO 2<br />
Na 2 O-TeO 2<br />
Bi O /TeO mol%<br />
Figure 4. Variation <strong>of</strong> activation energy (Edc) vs (a) P2O5 (Bartholomew 1973; Martin and Angell 1986;<br />
Chen et al 1992; Altaf et al 2001), (b) B2O3 mol% (Han et al 1979; Hunter and Ingram 1984; Ravine<br />
1985; Gandhi et al 1989; Chryssikos et al 1998; Gao and Cramer 2005; Veeranna Gowda and Anavekar 2005;<br />
Murugaraj 2007; Al-Assiri et al 2008), (c) SiO2 (Mazurin and Borisovskii 1957; Isard 1959; Charles 1966;<br />
Terai 1969; Hakim and Uhlmann 19<strong>71</strong>; Ravaine et al 1975; De Marchi et al 1988; Souquet et al 1998) and<br />
(d) Bi2O3/TeO2 mol% (Pan and Ghosh 1999a,b; Murugaraj 2007).<br />
former (P2O5, B2O3, SiO2 or TeO2) in glasses. The figures<br />
reveal bewildering spread <strong>of</strong> activation barriers revealing no<br />
significant trend attributable to the size <strong>of</strong> the alkali ion or<br />
any other physical property <strong>of</strong> the cations. Activation barrier<br />
histograms (number <strong>of</strong> systems having barriers between<br />
(Ea + Ea), not shown as a figure) suggest that the spread<br />
<strong>of</strong> activation barriers do decrease but not enough to suggest<br />
operation <strong>of</strong> any unique transport mechanism.<br />
D.C. activation barriers observed in presently investigated<br />
glasses are among the higher values <strong>of</strong> barriers observed in<br />
diborate glasses. These activation barriers are plotted as a<br />
function <strong>of</strong> sodium diborate concentration in figure 5. Upon<br />
reasonable extrapolation, the observed values appear close<br />
to the observed experimental Ea value for pure sodium diborate<br />
glass (Muthupari et al 1996) inspite <strong>of</strong> the differences<br />
in the structural effects brought about by PbO, TeO2 and<br />
Bi2O3. As noted earlier, the pseudo-binary (1−y)(Na2B4O7)<br />
and y(MaOb) glass structure is primarily based on exten-<br />
E dc (eV)<br />
1.6<br />
1.2<br />
0.8<br />
2 3<br />
Lines are drawn to guide the viewer<br />
2<br />
0.4<br />
0 20 40 60 80 100<br />
Na B O mol%<br />
2 4 7<br />
(c)<br />
(d)<br />
NBP<br />
NBT<br />
NBB<br />
Figure 5. Variation <strong>of</strong> activation energy (Edc) vs Na2B4O7 mol%.
78 V C Veeranna Gowda, C Narayana Reddy and K J Rao<br />
sive three dimensional network <strong>of</strong> diborate [B4O7] 2− units.<br />
In such a structure one would expect sodium ion migration<br />
by hopping to be significantly affected by the second network<br />
forming element arising from PbO, TeO2 or Bi2O3.But<br />
it is amazing that the activation barriers are in such a narrow<br />
range and within the experimental limits may be considered<br />
as ≈1 eV. There was also no indication <strong>of</strong> a two-stage<br />
(separable experimentally) barrier as implied in ion transport<br />
models. Nevertheless, we wish to add that in any such two<br />
barrier situations, if one <strong>of</strong> the barriers is dominant, the second<br />
is only a minor barrier and the latter may not be seen in<br />
conductivity experiments.<br />
iii<br />
i ii<br />
4.3 Transport via NBO–BO switching mechanism<br />
Scheme 1. Si3 –Si4 –Si4 –Si4 → Si4 –Si5 –Si4 –Si4 → Si4 –Si4 –Si3 –Si4.<br />
We have proposed in earlier publications (Harish Bhat et al<br />
2004a,b; Rao and Sundeep Kumar 2003; Sundeep Kumar and<br />
Rao 2004a,b; Sundeep Kumar et al 2004) that in modified<br />
oxide glasses, ion transport is likely to be initiated by NBO–<br />
BO switching. NBO–BO switching can itself occur either<br />
through a transient over coordination <strong>of</strong> the network forming<br />
element, or through the exploitation <strong>of</strong> polycoordination<br />
capability <strong>of</strong> the network forming atom (scheme 1). In silicates,<br />
for example, NBO–BO switching can be systematically<br />
represented as<br />
iv<br />
Si<br />
O<br />
O -<br />
Li +
In the case <strong>of</strong> borate glasses,<br />
Scheme 2. B3 –B4 –B3 –B3 → B3 –B3 –B4 –B3.<br />
In borate glasses it can occur by simple shifting <strong>of</strong> the<br />
charge through bond reorganization at the network forming<br />
centre as shown in scheme 2 above. In phosphate glasses,<br />
the NBO–BO switching may follow the same mechanism as<br />
in silicate glasses. The net energy change required to create<br />
these transient states constitutes the actual (measured)<br />
A new approach for understanding ion transport in glasses 79<br />
i<br />
B<br />
B -<br />
O<br />
activation barriers. The process is NBO–BO switching and<br />
it involves only moving <strong>of</strong> the negative charge and not the<br />
oxide ion. There is no associated mass transport. NBO–BO<br />
bond switching has an interesting and vital consequence. It<br />
destabilizes the alkali ion in its position because it was situated<br />
close to a NBO which has migrated in the process <strong>of</strong><br />
BO–NBO switching (The position where alkali ions are situated<br />
in glass is in reality a ‘pseudo equilibrium’ position<br />
and does not necessarily represent the lowest energy position).<br />
Therefore, cation now moves to new position where it<br />
is again situated close to an NBO. This is the mass transport<br />
event. This step, we assume, involves overcoming a<br />
lower energy barrier and also dependent on the anion matrix.<br />
Therefore, in glasses it is the NBO switching step which is<br />
large and determines the activation energy. This is the reason<br />
why it is essentially constant for glasses <strong>of</strong> a particular<br />
class (phosphates, borates etc) and virtually independent <strong>of</strong><br />
the cation.<br />
The magnitude <strong>of</strong> the electrical conductivities in the<br />
present system <strong>of</strong> glasses also become primarily a function<br />
<strong>of</strong> diborate concentration, which determines the concentration<br />
<strong>of</strong> mobile ions. Since Tg’s <strong>of</strong> these glasses are also similar<br />
(table 1), the observed conductivities at 275 ◦ Cgivenin<br />
table 1 are very similar for all the glasses when the concentration<br />
<strong>of</strong> Na2B4O7 is the same (conductivities are to be strictly<br />
compared at temperatures scaled with reference to Tg).<br />
In figure 3, however, we notice a change in the trends <strong>of</strong><br />
conductivity close to 70 mol% <strong>of</strong> Bi2O3 in NBB glasses.<br />
This change <strong>of</strong> trend at high Bi2O3 concentration is also<br />
Scheme 3. Opening <strong>of</strong> tight diborate unit into a linear chain without any change in its<br />
chemistry.<br />
iii<br />
ii<br />
B<br />
O<br />
O -
80 V C Veeranna Gowda, C Narayana Reddy and K J Rao<br />
consistent with the structural model. [BiO3/2] network integrates<br />
and permeates through diborate matrix according to<br />
the model and each bismuth atom tries to make coordination<br />
to three more oxygens as its wont from [B4O7] 2− units.<br />
Since each [B4O7] 2− unit possesses only seven oxygens, it<br />
can provide seven non-bonded coordinations. When there is<br />
30 mol% Na2B4O7 in the glass, there will be 0·3 × 7 moles<br />
<strong>of</strong> oxygen coordinations which are available and this is just<br />
enough for 0·7 moles <strong>of</strong> bismuth atoms which require 0·7 ×<br />
3 moles <strong>of</strong> oxygen coordinations. Thus a coordination saturation<br />
is reached at this composition. Theoretically all bismuth<br />
atoms have three non-bonded coordinations to oxygen<br />
atoms <strong>of</strong> [B4O7] 2− groups. Beyond this limit, bismuth will<br />
have to be content with lower coordinations to oxygen. This<br />
can cause formation <strong>of</strong> larger structural voids and it affects in<br />
a positive way migration <strong>of</strong> Na + ions to new positions (This<br />
is the second stage in the model proposed). The reversal <strong>of</strong><br />
compositional dependence <strong>of</strong> conductivity as observed in figure<br />
3 is thus well understood. It is also possible as noted elsewhere<br />
(Veeranna Gowda et al 2007) diborate units open up<br />
creating isolated B4 units which revert to B −<br />
2 or BO2/2O − units (see scheme 3) and in that case BO–NBO switching<br />
occurs with greater facility (it is, however, not evident if a<br />
small decrease <strong>of</strong> activation barrier results as a consequence).<br />
4.4 A.C. conductivity<br />
Frequency dependent conductivities are shown in figure 6 as<br />
log σ vs log f plots for several temperatures up to 250 ◦ C.<br />
Variations are very typical <strong>of</strong> glasses and at all temperatures<br />
we have found frequency independent plateau which<br />
extends to higher and higher frequencies at higher and higher<br />
temperatures. The variations follow Almond-West behaviour<br />
(Almond et al 1982, 1983, 1984),<br />
σ(ω) = σo + Aω s , (9)<br />
where s is the exponent which generally is such that 0 <<br />
s ≤ 1. The fits to the equation are shown as thin lines<br />
in figure 6b. The dispersion is remarkably small (goodness<br />
<strong>of</strong> fit).<br />
In a similar analysis <strong>of</strong> a.c. conductivities <strong>of</strong> sodium ion<br />
containing (NASICON type) phosphate glasses (Sobha and<br />
Rao 1995), we observed better fits using expressions <strong>of</strong><br />
the type<br />
σ(ω) = σo + Aω s1 + Bω s2 . (10)<br />
We have examined the quality <strong>of</strong> fits obtained with such threeterm<br />
equation and with two sets <strong>of</strong> s values: (i) s1 = 0·5, s2<br />
= 1·0 and (ii) with both s1 and s2 set as freely floated parameters.<br />
As examples, we have shown such fits in figures 7 (b)<br />
and (c). We note using the first choice <strong>of</strong> s1 = 0·5, s2 = 1·0,<br />
the fit is only marginally improved and the contribution <strong>of</strong> the<br />
2nd term is rather small (see inset legends in figure 7). In the<br />
case <strong>of</strong> freely floated s1 and s2, s1 turns out to be very close<br />
log(σ)<br />
log(σ)<br />
-6.0<br />
-6.6<br />
-7.2<br />
-7.8<br />
-6.0<br />
-6.6<br />
-7.2<br />
-7.8<br />
NBT1<br />
NBT1<br />
(a)<br />
150 0 C<br />
175 0 C<br />
200 0 C<br />
225 0 C<br />
250 0 C<br />
2 4<br />
log(f)<br />
6 8<br />
(b)<br />
150 0 C<br />
175 0 C<br />
200 0 C<br />
225 0 C<br />
250 0 C<br />
2 4<br />
log(f)<br />
6 8<br />
Figure 6. (a) Variation <strong>of</strong> log(σ ) vs log( f ) for NBT1 glass at different<br />
temperatures and (b) typical a.c. conductivity plots fitted to<br />
power law equation for NBT1 glass.<br />
to the s value obtained from the two term equation. Here also<br />
the third term <strong>of</strong> three term power law is significantly smaller<br />
than the second term. The notable features <strong>of</strong> the power law<br />
analysis are therefore (i) the two-term power law seems to be<br />
quite adequate in fitting the a.c. conductivity and (ii) values<br />
<strong>of</strong> s (see figure 8) for all the glasses shown at all temperatures<br />
seem to fall in a narrow range and are remarkably constant.<br />
The exponent characterizing the frequency dependence <strong>of</strong><br />
conductivity is essentially independent <strong>of</strong> both composition<br />
and temperature.<br />
We note here that traditional models based on cation hopping<br />
among equivalent sites should have given rise to<br />
composition and temperature dependent s values, because<br />
the concentration and distribution <strong>of</strong> equivalent sites would<br />
be affected by the composition (presence <strong>of</strong> Pb, Te or Bi)<br />
and the hopping parameters would be affected by temperature<br />
and in turn affected the exponents. But in the approach
log( σ)<br />
S/cm<br />
-6.2<br />
-6.4<br />
-6.6<br />
Data: Data2_P<br />
Model: user1<br />
Chi^2/DoF = 0.00005<br />
R^2 = 0.99852<br />
P1 1.8955E-7 ±7.8547E-10<br />
P2 7.8083E-11 ±8.6959E-12<br />
P3 0.64332 ±0.00841<br />
= +A o s<br />
σ σ ω<br />
A new approach for understanding ion transport in glasses 81<br />
NBB1 at 240 o C<br />
(a)<br />
1 2 3 4 5 6<br />
log(f) Hz<br />
log( σ)<br />
S/cm<br />
-6.2<br />
-6.4<br />
-6.6<br />
Data: Data1_B<br />
Model: user6<br />
Chi^2/DoF = 0.00013<br />
R^2 = 0.99649<br />
= +A o 0.5 +B 1.0<br />
σ σ ω ω<br />
log( σ)<br />
S/cm<br />
P1 1.8629E-7 ±1.1778E-9<br />
P2 3.3211E-10 ±1.5468E-11<br />
P3 2.4801E-13 ±2.1307E-14<br />
-6.2<br />
-6.4<br />
-6.6<br />
Data: Data1_B<br />
Model: user7<br />
Chi^2/DoF = 0.00006<br />
R^2 = 0.99852<br />
P1 1.8954E-7 ±1.2877E-9<br />
P2 6.8559E-11 ±3.829E-8<br />
P3 0.64304 ±1.6125<br />
P4 9.7729E-12 ±3.8348E-8<br />
P5 0.64332 ±12.205<strong>71</strong><br />
= +A o s σ 1 s<br />
σ ω +Bω 2<br />
1 2 3<br />
log(f) Hz<br />
4 5 6<br />
NBB1 at 250 o C<br />
1 2 3 4 5 6<br />
NBB1 at 250 o C<br />
(c)<br />
log(f) Hz<br />
Figure 7. (a) Single power law fit, (b) double power law fit with variable exponents and (c) double power law fit with<br />
fixed exponents.<br />
proposed here the charge transfer is controlled by NBO–BO<br />
switching <strong>of</strong> the borate network only. The other aspects <strong>of</strong> the<br />
structure viz. presence <strong>of</strong> lead, tellurium and bismuth may<br />
only secondarily affect the NBO–BO switching.<br />
Therefore, we would not expect the frequency dependence<br />
<strong>of</strong> this process to be much affected by either composition or<br />
temperature. The observation <strong>of</strong> an essentially constant value<br />
<strong>of</strong> ‘s’ is thus readily justified. This is also consistent with the<br />
observed collapse in reduced log(σ/σo) vs log( f / fo) plots.<br />
The above observations are strengthened by the analysis<br />
<strong>of</strong> the a.c. conductivity using moduli representation. The<br />
variation <strong>of</strong> moduli is shown as M ′′ vs log f in figure 9.<br />
Magnitudes <strong>of</strong> M ′′ max are rather similar in each class <strong>of</strong><br />
glasses (NBP/NBT/NBB). In reduced plot <strong>of</strong> M ′′ /M ′′ max vs<br />
log( f/fo), collapse <strong>of</strong> the plots is extraordinary in the sense<br />
that collapse occurs even up to very high frequencies (see<br />
figure 10). The calculated value <strong>of</strong> β from the graph <strong>of</strong> FWHM<br />
vs β values for all the glasses are shown in figure 11. Here<br />
again the constancy <strong>of</strong> β and its independence on composition<br />
and temperature points towards the existence <strong>of</strong> a<br />
common transport mechanism. As earlier we attribute this<br />
feature to NBO–BO switching mechanism which is the<br />
primary process in charge transport.<br />
4.5 Further aspects <strong>of</strong> NBO–BO switching<br />
for ion transport in glasses<br />
It is a long held view that ionic conductivity in glasses<br />
is through the transport <strong>of</strong> ions with low electrical charge<br />
through the action <strong>of</strong> jumping between equivalent positions<br />
in a manner very similar to the process that occurs in<br />
crystalline solids like alkali halides. In crystals presence <strong>of</strong><br />
well defined defects like vacancies and interstitials exist and<br />
jumping <strong>of</strong> alkali ions is easily visualized. In glasses presence<br />
<strong>of</strong> a vacancy as charge and mass singularity is generally<br />
(and perhaps unjustifiably) not well accepted. Even then it is<br />
assumed particularly in oxide glasses that the charge transporting<br />
cations are positioned closest to NBOs and they jump<br />
to similar positions; neighbourhood <strong>of</strong> another NBO which is<br />
assumed to be an equivalent position. In the process it is supposed<br />
to move through the crowded environment by mecha-<br />
(b)
82 V C Veeranna Gowda, C Narayana Reddy and K J Rao<br />
s<br />
1.0<br />
0.8<br />
0.6<br />
0.4<br />
0.2<br />
0.0<br />
NBP1<br />
NBP2<br />
NBP3<br />
NBP4<br />
NBT1<br />
NBT2<br />
NBT3<br />
NBT4<br />
NBB1<br />
NBB2<br />
NBB3<br />
NBB4<br />
175 210 245 280 315<br />
Temperature ( 0 C)<br />
Figure 8. Variation <strong>of</strong> power law exponent, s, with temperature.<br />
M"<br />
0.06<br />
0.04<br />
0.02<br />
0.00<br />
150 0 C<br />
175 0 C<br />
200 0 C<br />
225 0 C<br />
250 0 C<br />
NBT1<br />
2 3 4<br />
log(f) Hz<br />
5 6<br />
Figure 9. Variation <strong>of</strong> M ′′ with log( f ) at different temperatures.<br />
nically pushing aside oxygens which results in a mechanical<br />
barrier component <strong>of</strong> the activation energy. The unstated<br />
implication is that NBOs are positionally fixed at the point<br />
<strong>of</strong> glass transition and they do not move, at least on the time<br />
scale <strong>of</strong> the observed ion transport (see Dyre et al 2009 for a<br />
thoughtful discussion <strong>of</strong> problems in understanding ion conductivity<br />
in glasses which unfortunately does not address this<br />
problem). This to our knowledge is not clearly established<br />
experimentally. It is easily seen that when BO–NBO switching<br />
takes place, there is clearly only a charge transport while<br />
when a cation like Na + moves, there is both an electrical<br />
and mass transport. We recognize that NBO–BO switching<br />
causes a local destabilization because the cation which was<br />
situated close to NBO now finds itself a neighbour to a BO<br />
and will be induced to move onto the neighbourhood <strong>of</strong> a<br />
β<br />
M"/M" max<br />
1.2<br />
0.9<br />
0.6<br />
0.3<br />
0.0<br />
-5 -4 -3 -2 -1 0 1 2 3 4 5 6<br />
log(f/f 0 )<br />
NBB1- 175 o C<br />
NBB1- 200 o C<br />
NBB1- 225 o C<br />
NBB1- 250 o C<br />
NBB1- 275 o C<br />
NBB2- 200 o C<br />
NBB2- 225 o C<br />
NBB2- 250 o C<br />
Figure 10. Reduced plot <strong>of</strong> dielectric modulus at different compositions<br />
and temperatures.<br />
1.0<br />
0.8<br />
0.6<br />
0.4<br />
0.2<br />
0.0<br />
NBP2<br />
NBP3<br />
NBT1<br />
NBT2<br />
NBT3<br />
NBB1<br />
NBB2<br />
175 210 245 280 315<br />
Temperature ( 0 C)<br />
Figure 11. Variation <strong>of</strong> β with temperature.<br />
nearby NBO. Thus the cation transport is a forced consequence<br />
and not a primary independent cause in ionic conductivity<br />
phenomena in the proposed model. Can NBO–BO<br />
switching really occur and what would be its effects on the<br />
widely accepted conductivity expression?<br />
We propose that NBO–BO reactions occur in a facile manner<br />
via what looks like Sn2 reaction and a bond breaking<br />
occurs post creation <strong>of</strong> a over coordinated activated state (see<br />
scheme 1). The intermediate step involves a five coordinated<br />
silicon which uses 2s 1 2p 3 3s 1 hybridized state as a intermediate<br />
state. It looks like the principal energy expense in<br />
creating the activated state is the difference in energies <strong>of</strong><br />
five coordinated silicon (Si: 2s 2 2p 2 3s 1 hybridized, sp 3 s 1 )<br />
and four coordinated silicon (Si: 2s 2 2p 2 hybridized, sp 3 ).
These energies are very much in the range <strong>of</strong> an electronvolt<br />
(encouraging results have been obtained from on going<br />
density functional theory (DFT) calculations which will be<br />
published later). In other oxide glasses such as in borates,<br />
four-coordination <strong>of</strong> boron can be easily visualized such as<br />
switching between tetrahedral and trigonal borons.<br />
Therefore, we feel that in ion transport NBOs are not<br />
fixed structured entities on the time scales <strong>of</strong> transport property<br />
measurements but are the main participants. Alkali ion<br />
motions are a necessary consequence and generally characterized<br />
by lower energy barriers. There are notable merits <strong>of</strong><br />
this approach to ion transport. Since BO–NBO switching is<br />
primary to this analysis, activation barriers may simply be in<br />
a small range in any particular class <strong>of</strong> glasses as indeed is the<br />
general observation. Power law exponents must be similarly<br />
reflecting only the effect <strong>of</strong> a.c. field on BO–NBO switching.<br />
Ion transport in glasses (Stevels 1957; Mazurin 1965)uses<br />
the expression<br />
<br />
σdc = σ0 exp − Edc<br />
<br />
, (11)<br />
kT<br />
which is derived from defect model <strong>of</strong> transport in crystalline<br />
materials. σo represents the pre-exponential factor<br />
σ0 = n(ze)2λ2ν0 . (12)<br />
6kT<br />
In the above expression, λ represents the distance <strong>of</strong> jump <strong>of</strong><br />
the charge transporting ion and <strong>of</strong> the order <strong>of</strong> one or two unit<br />
lengths in the lattice (few Å). Ze is the charge (and is equal<br />
to unity in appropriate units) for alkali ions, k the Boltzmann<br />
constant and T the absolute temperature. νo refers to attempt<br />
frequency made by the ion before it hops onto another similar<br />
site. It is generally equated to the cage vibrational frequency<br />
<strong>of</strong> the alkali ions (around 220 cm −1 or 6·6 × 10 12 Hz)<br />
(Muthupari and Rao 1994; Exarhos and Risen 1972). σo can<br />
also be obtained by extrapolation <strong>of</strong> experimental log σ vs<br />
1/T plots. The σo value so obtained can be used in the above<br />
expression to estimate νo which for the case <strong>of</strong> NBB1 is<br />
found to be ∼225 cm −1 .<br />
If the primary transport is the BO–NBO switching<br />
this equation still be valid as we have argued elsewhere<br />
(Harish Bhat et al 2004a,b) because Ze still remains the same<br />
(+1, it is one positive unit for alkali ions). n the concentration<br />
<strong>of</strong> the transporting positive (alkali ions) and is exactly<br />
equal to the NBO concentration. νo now stands to represent<br />
the attempt frequency made by NBO in establishing the activated<br />
state. This is most likely the low frequency twisting,<br />
bending or scissoring frequency. It may fall in the region <strong>of</strong> a<br />
few hundred cm −1 and will leave the value <strong>of</strong> σo unaffected<br />
except by a numerical factor which at any rate no greater<br />
than two or three. Therefore, d.c. conductivities measured<br />
and analysed using the above expression in the literature for<br />
oxide glasses are completely consistent with the NBO–BO<br />
switching model.<br />
One should expect bending–scissoring or twisting MO −<br />
frequencies (M being silicon, boron, phosphorous etc) to<br />
A new approach for understanding ion transport in glasses 83<br />
be generally broad bands in oxide glasses lying in the far<br />
infrared region. Further whether it is or<br />
even , it would still be similar in value because – O− is connected to a covalently bonded matrix <strong>of</strong> high mass and<br />
f<br />
the frequency being μ ≈<br />
<br />
f<br />
.Thef values (which<br />
mO− <br />
1<br />
scale as<br />
r 3 ) do not exhibit great spread. Thus the near<br />
m−O<br />
constancy <strong>of</strong> νo is justified.<br />
The response to a.c. field in this model is as follows.<br />
Bending or scissoring <strong>of</strong> NBO mode constitutes a band <strong>of</strong><br />
non-trivial width but they are all at high frequencies compared<br />
to frequencies employed in dielectric measurements<br />
(200 cm−1 ≡ 6 × 10¹² Hz). They represent the attempt frequencies<br />
made in the process <strong>of</strong> BO–NBO conversion. But<br />
each successful BO–NBO conversion event is immediately<br />
followed by a definite alkali ion jump which causes a new<br />
dipole reorientation. We consider this second step which follows<br />
the BO–NBO switching as the origin <strong>of</strong> the observed<br />
dielectric response in a.c. measurements.<br />
Analytical expressions <strong>of</strong> conductivity, whether it refers<br />
to data reduction, are universal plots that remain valid even<br />
in the BO–NBO switching model <strong>of</strong> conductivity proposed<br />
here. Some <strong>of</strong> the serious difficulties <strong>of</strong> interpretation <strong>of</strong> conductivity<br />
behaviour are also resolved by BO–NBO switching<br />
model satisfactorily. For example, the cation size independence<br />
<strong>of</strong> the activation barriers observed in silicates (around<br />
20% concentration <strong>of</strong> any alkali modifier) activation barriers<br />
become equal (Rao and Elliott 1994). Similarly in any region<br />
<strong>of</strong> concentration <strong>of</strong> alkalis in the mixed alkali glass conductivities<br />
two distinct barriers are expected, but the two characteristic<br />
alkali barriers are never observed. In the present<br />
model there can be but only one barrier irrespective <strong>of</strong> any<br />
numbers or a combination <strong>of</strong> alkali cations.<br />
Finally we should like to comment on the validity <strong>of</strong> BNN<br />
relation in these glasses. BNN relation requires that σo be<br />
related to ωp which is in turn obtained from d.c. and a.c.<br />
measurements, respectively. On reflection it appears that the<br />
relation is obvious because if σ(ω) = σo + Aωs , then it is<br />
easily shown that ωp occurs at σ (ω) = 2σ o which requires<br />
that ωs p = σo/A which establishes the relation between σ o<br />
and ωp although not the linear relation obvious in BNN relation.<br />
Therefore, it appears that Almond–West relation is more<br />
intriguing in its universal validity than BNN relation.<br />
The model proposed here appears as if specific to oxide<br />
glasses only (NBO–BO system). It is our premise that it<br />
could possibly be generalized and extended to ionically<br />
conducting chalcogenide and halide glasses (at least in the<br />
temperature regime where halide glasses behave like weak<br />
analogs <strong>of</strong> silicate glasses as well).<br />
5. Conclusions<br />
Ionic conductivity in oxide glasses has been analysed<br />
using the specific example <strong>of</strong> yNa2B4O7·(1−y)MaOb(Ma ≡
84 V C Veeranna Gowda, C Narayana Reddy and K J Rao<br />
Pb, Te, Bi) modified diborate glasses for which conductivity<br />
measurements have been reported. A new model has been<br />
suggested in which the primary event in ion transport is<br />
NBO–BO switching. This causes destabilization <strong>of</strong> cation<br />
(alkali ion) which moves to the new position in the neighbourhood<br />
<strong>of</strong> another NBO and this event is characterized by<br />
a low barrier. The activation barrier obtained in conductivity<br />
measurements represents the barrier for NBO–BO switching.<br />
The model, therefore, consistently rationalizes observations<br />
like the presence <strong>of</strong> a single observed activation barrier <strong>of</strong><br />
very similar magnitude in any given class <strong>of</strong> glasses. It is also<br />
easy to understand why in a.c. conductivity measurements<br />
we observe a narrow range <strong>of</strong> s and β values.<br />
The implication <strong>of</strong> wide validity <strong>of</strong> BNN relation has been<br />
shown to be a consequence <strong>of</strong> the validity <strong>of</strong> Almond–West<br />
relation.<br />
Observed d.c. and a.c. conductivity variations have been<br />
shown to be a consequence <strong>of</strong> the unique structural features<br />
<strong>of</strong> PbO/TeO2/Bi2O3 containing diborate glasses.<br />
Acknowledgement<br />
One <strong>of</strong> the authors (KJR) is thankful to DST for the award <strong>of</strong><br />
a Ramanna Fellowship (Sr).<br />
References<br />
Al-Assiri M S, Tashtoush N M, Ragab H S and El-Desoky M M<br />
2008 Phys. Status Solidi (a) 205 1540<br />
Almond D P, West A R and Grant R J 1982 Solid State Commun. 44<br />
1277<br />
Almond D P, Duncan G K and West A R 1983 Solid State Ionics 8<br />
159<br />
Almond D P, Hunter C C and West A R 1984 J. Mater. Sci. 19<br />
3236<br />
Altaf M, Chaudhary M A and Siddiqi S A 2001 Mater. Chem. Phys.<br />
<strong>71</strong> 28<br />
Anderson O L and Stuart D A 1954 J. Am. Ceram. Soc. 37 573<br />
Angell C A 1990 Chem. Rev. 90 523<br />
Angell C A, Pollard L and Strauss W 1965 J. Chem. Phys. 43<br />
2899<br />
Bartholomew R F 1973 J. Non-Cryst. Solids 12 321<br />
Barton J L 1966 Verres Refract. 20 328<br />
Charles R J 1966 J. Am. Ceram. Soc. 49 55<br />
Chen R, Yang R, Durand B, Pradel A and Ribes M 1992 Solid State<br />
Ionics 53–56 1194<br />
Chryssikos G D, Liu L, Varsamis C P and Kamitsos E I 1998<br />
J. Non-Cryst. Solids 235–237 761<br />
De Marchi G, Mazzoldi P and Miotello A 1988 J. Non-Cryst. Solids<br />
104 211<br />
Doremus R H 1973 Glass science (New York: Wiley)<br />
Dyre J C 1985 Phys. Lett. A108 457<br />
Dyre J C 1986 J. Non-Cryst. Solids 88 2<strong>71</strong><br />
Dyre J C and Schroder T B 2000 Rev. Mod. Phys. 72 873<br />
Dyre J C, Maass P, Roling B and Sidebottom D L 2009 Rep. Prog.<br />
Phys. 72 046501<br />
Elliott S R 1988 Solid State Ionics 27 131<br />
Exarhos G J and Risen W M Jr. 1972 Solid State Commun. 11<br />
755<br />
Funke K 1993 Prog. Solid State Chem. 22 111<br />
Galy J and Meunier G J 1975 Solid State Chem. 13 142<br />
Gandhi P R, Deshpande V K and Singh K 1989 Solid State Ionics<br />
36 97<br />
Gao Y and Cramer C 2005 Solid State Ionics 176 921<br />
Hakim R M and Uhlmann D R 19<strong>71</strong> Phys. Chem. Glasses 12 132<br />
Han Y H, Kreidl N J and Day D E 1979 J. Non-Cryst. Solids 30<br />
241<br />
Harish Bhat M, Munia Ganguli and Rao K J 2004a Curr. Sci. 86<br />
676<br />
Harish Bhat M, Kandavel M, Munia Ganguly and Rao K J 2004b<br />
Bull. Mater. Sci. 27 189<br />
Hughes K and Isard J O 1972 in Physics <strong>of</strong> electrolytes (ed.) J H<br />
Hladik (New York: Academic Press) Vol. 1,p.351<br />
Hunter C C and Ingram M D 1984 Solid State Ionics 14 34<br />
Imre A W, Voss S, Berkemeir F, Mehrer H, Konidakis I and Ingram<br />
M D 2006 Solid State Ionics 177 963<br />
Isard J O 1959 J. Soc. Glass Technol. 53 113T<br />
Macdonald J R 1983 Impedance spectroscopy emphasizing solid<br />
materials and systems (New York: John Wiley and Sons)<br />
Macedo P B, Moynihan C T and Bose R 1972 Phys. Chem. Glasses<br />
13 1<strong>71</strong><br />
Martin S W and Angell C A 1986 J. Non-Cryst. Solids 83 185<br />
Mazurin O V 1965 in The structure <strong>of</strong> glass (New York: Consultants<br />
Bureau), Vol. 4, p.7<br />
Mazurin O V and Borisovskii E S 1957 Sov. Phys. Tech. Phys. 2 243<br />
Murugaraj R 2007 J. Mater. Sci. 42 10065<br />
Muthupari S and Rao K J 1994 Chem. Phys. Letts 223 133<br />
Muthupari S, Lakshmi Raghavan S and Rao K J 1996 J. Phys.<br />
Chem. 100 4243<br />
Nakajima T 1972 in Annual report, Conference on electric insulation<br />
and dielectric phenomena (Washington DC: National<br />
<strong>Academy</strong> <strong>of</strong> <strong>Sciences</strong>) p. 168<br />
Namikawa H 1975 J. Non-Cryst. Solids 18 173<br />
Pan A and Ghosh A 1999a Phys. Rev. B59 899<br />
Pan A and Ghosh A 1999b Phys. Rev. B60 3224<br />
Rao K J 1987 Rev. Solid State Sci. 1 55<br />
Rao K J 2002 Structural chemistry <strong>of</strong> glasses (Elsevier)<br />
Rao K J and Parthasarathy R 1985 Proc. <strong>Indian</strong> Acad. Sci. (Chem.<br />
Sci.) 94 201<br />
Rao K J and Elliott S R 1994 Proc. <strong>Indian</strong> Acad. Sci. (Chem. Sci.)<br />
106 903<br />
Rao K J and Harish Bhat M 2001 Phys. Chem. Glasses 42 255<br />
Rao K J and Sundeep Kumar 2003 Curr. Sci. 85 945<br />
Rao K J, Estournes C, Levasseur A, Shastry M C R and Menetrier<br />
M 1993 Philos. Mag. B67 389<br />
Ravaine D, Diard J P and Souquet J L 1975 J. Chem. Soc. Faraday<br />
Trans. II <strong>71</strong> 1935<br />
Ravine D 1985 J. Non-Cryst. Solids 73 287<br />
Ravine D and Souquet J L 1977 Phys. Chem. Glasses 18 27<br />
Ravine D and Souquet J L 1978 in Solid electrolytes (eds)<br />
P Hagenmuller and W Van Gool (New York: Academic Press)<br />
p. 277<br />
Roling B, Martiny C and Murugavel S 2001 Phys.Rev.Lett.87<br />
085901<br />
Sidebottom D L, Roling B and Funke K 2001 Phys. Rev. B63<br />
024301<br />
Sobha K C and Rao K J 1995 Solid State Ionics 81 145<br />
Souquet J L, Duclot M and Levy M 1998 Solid State Ionics 105<br />
237
Stevels J M 1957 Handbuch der Physik (Berlin: Springer) Vol. 20,<br />
p. 350<br />
Sundeep Kumar and Rao K J 2004a Chem. Phys. Letts 387 91<br />
Sundeep Kumar and Rao K J 2004b Solid State Ionics 170 191<br />
Sundeep Kumar, Vinatier P, Levasseur A and Rao K J 2004 J. Solid<br />
State Chem. 177 1723<br />
Terai R 1969 Phys. Chem. Glasses 10 147<br />
A new approach for understanding ion transport in glasses 85<br />
Tomozawa M 1977 in Treatise on materials science and technology<br />
(ed) M Tomozawa (New York: Academic Press) Vol. 12,<br />
p. 283<br />
Veeranna Gowda V C and Anavekar R V 2005 Solid State Ionics<br />
176 1393<br />
Veeranna Gowda V C, Narayana Reddy C, Radha K C, Anavekar R<br />
V, Etourneau J and Rao K J 2007 J. Non-Cryst. Solids 353 1150