Panel Discussion on Problem Solving - Institute for Advanced ...
Panel Discussion on Problem Solving - Institute for Advanced ...
Panel Discussion on Problem Solving - Institute for Advanced ...

You also want an ePaper? Increase the reach of your titles
YUMPU automatically turns print PDFs into web optimized ePapers that Google loves.
Coders’ Corner <str<strong>on</strong>g>Panel</str<strong>on</strong>g> <str<strong>on</strong>g>Discussi<strong>on</strong></str<strong>on</strong>g> <strong>on</strong> <strong>Problem</strong> <strong>Solving</strong><br />
Frank DiIorio, Paul Dorfman, Ian Whitlock<br />
Introducti<strong>on</strong> by Steve Noga<br />
Introducti<strong>on</strong><br />
As abstracts <strong>for</strong> the Coders’ Corner secti<strong>on</strong><br />
began to filter in, a veteran SESUG participant<br />
suggested that a panel discussi<strong>on</strong> <strong>on</strong> problem<br />
solving might be interesting. This idea was<br />
floated am<strong>on</strong>g the c<strong>on</strong>ference and secti<strong>on</strong> chairs<br />
with all parties agreeing that such a panel<br />
discussi<strong>on</strong> could make <strong>for</strong> an interesting<br />
sessi<strong>on</strong>. The panel needed to be comprised of<br />
individuals with certain traits including, but not<br />
limited to outstanding knowledge of SAS ® ,being<br />
com<strong>for</strong>table speaking in fr<strong>on</strong>t of a group, desire<br />
to educate an audience without being<br />
overbearing.<br />
One of the main reas<strong>on</strong>s <strong>for</strong> presenting a topic<br />
such as ‘problem solving’ in a panel discussi<strong>on</strong><br />
is because there are any number of approaches<br />
and techniques to solve the problem, but an<br />
equal number of traps that a programmer can<br />
fall into. This panel of experienced SAS users<br />
have each attacked the problem in their own<br />
style. The reader, regardless of their own level<br />
of expertise with SAS, should come away with a<br />
good understanding of issues involved in writing<br />
code to solve a problem.<br />
<strong>Problem</strong><br />
The full problem, locati<strong>on</strong> code <strong>for</strong>mat, and a<br />
sample of data can be found in Attachment 1.<br />
The problem was designed to replicate a realworld<br />
situati<strong>on</strong> without making it too complex <strong>for</strong><br />
a <strong>on</strong>e-hour panel sessi<strong>on</strong>. To solve the problem,<br />
the following tasks needed to be accomplished:<br />
• Read and understand the specs<br />
• Read data from an external file<br />
• Manipulate data<br />
• Display results<br />
The participants were each emailed the problem<br />
and then left to their own devices to solve it.<br />
What follows are the three soluti<strong>on</strong>s to the<br />
problem.<br />
Participants<br />
Frank DiIorio, Paul Dorfman, and Ian Whitlock<br />
agreed to participate in the panel.<br />
Frank DiIorio is author of "SAS Applicati<strong>on</strong>s<br />
Programming: A Gentle Introducti<strong>on</strong>" and (with<br />
Ken Hardy) "Quick Start to Data Analysis with<br />
SAS." He was co-chair of SESUG 94 and<br />
SESUG 96 and is past President of the<br />
SouthEast SAS Users Group.<br />
Paul Dorfman, originally a physicist (whence<br />
Ph.D. comes), started using SAS in<br />
computati<strong>on</strong>al physics an undetermined period<br />
of time ago. Thereafter, used it <strong>for</strong> client-,<br />
customer-, and self-aggrandizing in engineering,<br />
telops, pharma, banking, and managed<br />
healthcare. Specializes in programming highper<strong>for</strong>mance<br />
custom routines. Speaks some<br />
t<strong>on</strong>gues other than SAS, not limited to C,<br />
Ukrainian, and Cobol. Awards: 'Sashole' from<br />
WACB (World Associati<strong>on</strong> of Cobol Bigots),<br />
1995, 'MVS' from SAS-L, 2000.<br />
Ian Whitlock has a Ph.D. in mathematics and<br />
comes to programming from a <strong>for</strong>mer teaching<br />
career. He has been active many SUGI,<br />
SESUG and NESUG c<strong>on</strong>ferences in additi<strong>on</strong> to<br />
his local DCSUG and in house WesSug, in<br />
additi<strong>on</strong> to being a frequent c<strong>on</strong>tributor <strong>on</strong> SAS-<br />
L.<br />
Acknowledgments<br />
The secti<strong>on</strong> chair would like to thank Frank,<br />
Paul, and Ian <strong>for</strong> taking the time and ef<strong>for</strong>t to<br />
participate in the panel discussi<strong>on</strong>. He would<br />
also like to express his thanks to Andrew T.<br />
Kuligowski <strong>for</strong> not <strong>on</strong>ly suggesting the problem<br />
solving panel idea, but also <strong>for</strong> providing the<br />
sample problem as a starting point <strong>for</strong> this<br />
exercise.
Attachment 1: Sample <strong>Problem</strong> and Data<br />
The famed oceanographer, Dr. Nigel Dripp-<br />
Drye, has obtained a data set c<strong>on</strong>taining water<br />
temperatures of the Gulf of Mexico, taken at<br />
various locati<strong>on</strong>s, from Pensacola to Key West,<br />
during Thanksgiving (Nov 25) week 1999<br />
(Sunday through Saturday). The data is not<br />
sorted in any order. However, there may be<br />
some records <strong>for</strong> days preceding or following the<br />
week in questi<strong>on</strong>, these should be ignored, and<br />
since we are trying to replicate real world data<br />
files, there may be additi<strong>on</strong>al quirks in the file.<br />
The data is <strong>for</strong>matted as follows:<br />
LOCATION CODE (00-99) 01-02<br />
DATE (mm/dd/yyyy) 04-13<br />
TIME (24 hour) 15-18<br />
DEPTH (meters) 21-24<br />
TEMPERATURE (see below) 26-36<br />
COLLECTOR (last name, first) 38-50<br />
Two things to note: First, more than <strong>on</strong>e<br />
individual entered the professor's data <strong>for</strong> him.<br />
Some of them entered the temperature using a<br />
standard decimal notati<strong>on</strong> (with 2 digit<br />
precisi<strong>on</strong>), while others entered it as a fracti<strong>on</strong>,<br />
such as "27 1/4". Sec<strong>on</strong>d, since each collector<br />
Sun M<strong>on</strong> Tue Wed Thu Fri Sat<br />
Locati<strong>on</strong> Collector (n=) (n=) (n=) (n=) (n=) (n=) (n=)<br />
--------------------------- ---- ---- ---- ---- ---- ---- ----<br />
Code (Text)<br />
First name Last name<br />
N (%) xx(xx.x%) ………………………..<br />
Mean xx.x ………………………………<br />
Min xx.x ………………………………<br />
Max xx.x ………………………………<br />
(Only list codes and collectors that actually have<br />
valid data. For those days when a collector did<br />
not have any valid collecti<strong>on</strong>s <strong>for</strong> a code, just<br />
leave the column stats blank. (n=) in the column<br />
headers represents the total number of valid<br />
was receiving a stipend <strong>for</strong> each temperature<br />
collected, some may have used assistants to<br />
collect the data even though it was still entered<br />
into the data file under the primary collectors’<br />
name. In cases like the above, it is c<strong>on</strong>ceivable<br />
that the data might look like a collector was in<br />
two places at <strong>on</strong>ce, and because of the<br />
assistants, these records will be counted as<br />
valid. However, if an assistant got overzealous<br />
and entered more than <strong>on</strong>e temperature <strong>for</strong> the<br />
same time, date, locati<strong>on</strong> code, and collector<br />
then <strong>on</strong>ly the maximum temperature taken from<br />
the maximum depth <strong>for</strong> that time, date, locati<strong>on</strong><br />
code, and collector will be counted as valid.<br />
Dr. Dripp-Drye has requested a simple report,<br />
sorted by Locati<strong>on</strong> Name and Collector. (A<br />
code/name translati<strong>on</strong> table is included as an<br />
addendum to this text.) He is <strong>on</strong>ly interested in<br />
temperatures taken between 6:00pm and<br />
8:00pm at a depth of between 10 and 15 meters<br />
- all others should be ignored. The <strong>for</strong>mat should<br />
resemble the following and be as pleasing <strong>on</strong><br />
the eyes as possible since Dr. Dripp-Drye has to<br />
submit the report to his superiors.<br />
collecti<strong>on</strong>s <strong>for</strong> that day. N represents the total<br />
number of valid collecti<strong>on</strong>s by the individual<br />
collector <strong>for</strong> that day and (%) is a based <strong>on</strong><br />
N/(n=) with the sum of all (%)s in a column<br />
equaling 100.0)
Codes & Corresp<strong>on</strong>ding Locati<strong>on</strong>s<br />
00 – PENSACOLA<br />
01 - PANAMA CITY<br />
08 – APALACHICOLA<br />
09 - CEDAR KEY<br />
13 - TARPON SPRINGS<br />
14 – CLEARWATER<br />
15 - ST. PETERSBURG<br />
16 – BRADENTON<br />
17 – SARASOTA<br />
22 – CAPTIVA<br />
24–FLAMINGO<br />
25 - KEY WEST<br />
Sample Data (20 obs out of 1,500)<br />
01 11/26/1999 1700 17 20.74 Wahiini<br />
16 11/23/1999 1830 5 20 Beard, B.<br />
08 11/27/1999 1800 2 24.64 FISH, SEYMOUR<br />
00 11/23/1999 0700 7 23 3/4 morgan, Cap'n<br />
14 11/26/1999 1800 10 23 13/16 Beard, B.<br />
09 11/20/1999 1830 10 25 1/2 FISH, SEYMOUR<br />
25 11/28/1999 1900 12 24 3/16 Beard, B.<br />
22 11/20/1999 1830 11 20.05 Beard, B.<br />
01 11/23/1999 1800 13 21.29 FISH, SEYMOUR<br />
08 11/26/1999 1930 10 24 9/16 Wahiini<br />
01 11/19/1999 1800 17 21 11/16 Beard, B.<br />
01 11/26/1999 1930 10 21 5/16 Whostow, Jock<br />
09 11/25/1999 1830 4 21.14 Beard, B.<br />
01 11/21/1999 1800 0 21.68 Tide, Rip<br />
13 11/20/1999 1830 10 24.90 Whostow, Jock<br />
09 11/28/1999 1900 1 25 3/4 FISH, SEYMOUR<br />
09 11/22/1999 1800 14 20.42 morgan, Cap'n<br />
24 11/20/1999 1930 10 23 3/8 Wahiini<br />
02 11/20/1999 1930 10 23.60 Wahiini<br />
02 11/27/1999 1800 10 24.94 Wahiini
Deep Blue SAS: One Programmer’s Approach to <strong>Problem</strong>-<strong>Solving</strong><br />
Frank C. DiIorio<br />
<strong>Advanced</strong> Integrated Manufacturing Soluti<strong>on</strong>s, Co.<br />
Durham NC<br />
My comments are organized into some of the pre-coding issues,<br />
followed by thoughts <strong>on</strong> the actual program’s techniques and<br />
organizati<strong>on</strong>. The last secti<strong>on</strong> briefly notes the impact of some<br />
changes that would probably be made in Versi<strong>on</strong> 2.<br />
PRE-CODING<br />
The first step is to look at what you have been handed, namely<br />
specs and data.<br />
SPECS<br />
The specs adequately described the background of the study, the<br />
<strong>for</strong>mat of the data, quirks in data <strong>for</strong>mat (temperature, <strong>for</strong><br />
example), locati<strong>on</strong> code mappings, and the layout of the report. As<br />
isalwaysthecasewithevensimpleprojectslikethis,<br />
implementati<strong>on</strong> revealed holes in the spec (handling of missing<br />
values, degree of parameterizati<strong>on</strong>, etc.). These will be discussed<br />
as we go. It’s important, though, to remember that any written<br />
spec, no matter how well-crafted, will have some omissi<strong>on</strong>s that<br />
are revealed <strong>on</strong>ly when coding begins.<br />
DATA<br />
The data source is small enough (1,500 records) to examine<br />
visually. We look both <strong>for</strong> adherence to the spec and features not<br />
covered by the spec. Notice that the time field is in 24-hour <strong>for</strong>mat<br />
and does not c<strong>on</strong>tain a col<strong>on</strong> separating hours and minutes.<br />
Notice too that the date c<strong>on</strong>tains slashes and locati<strong>on</strong> code has<br />
leading zeroes.<br />
Since we have to manipulate the name field (changing to first-last<br />
<strong>on</strong> output from last-first <strong>on</strong> input), we should pay attenti<strong>on</strong> to the<br />
method used <strong>for</strong> separating names. Examinati<strong>on</strong> of the field<br />
reveals not <strong>on</strong>ly (a) people who probably know the Jimmy Buffet<br />
s<strong>on</strong>gbook by heart, but also (b) people with <strong>on</strong>e name. Finally, we<br />
see <strong>on</strong> examinati<strong>on</strong> of Locati<strong>on</strong> that there are codes (02, 23) that<br />
were not menti<strong>on</strong>ed in the spec and so will not have a descriptive<br />
label <strong>on</strong> output.<br />
SIMPLE STATS<br />
Visual examinati<strong>on</strong> is fine, but even in such a small dataset some<br />
descriptive statistics should be run. A quick DATA step will<br />
produce a bare-b<strong>on</strong>es dataset. Frequency counts of values such<br />
as name, locati<strong>on</strong>, date/time, and temperature should be examined<br />
<strong>for</strong> inc<strong>on</strong>sistent name capitalizati<strong>on</strong>, invalid codes, and unexpected<br />
methods of temperature data representati<strong>on</strong>.<br />
CODING TECHNIQUES<br />
The key is to develop the program incrementally. First, read the<br />
data, do essential observati<strong>on</strong> filtering and data massaging, then<br />
work <strong>on</strong> shaping the dataset <strong>for</strong> the reporting procedure(s).<br />
The program is reproduced in Figure 1, which follows this text.<br />
Comments in the text match numbers in the program entered as<br />
{number}.<br />
{1} Parameterize<br />
This wasn’t in the spec, but you can’t tell me that <strong>on</strong>ce Dr. Drye’s<br />
superiors see such a nice report they w<strong>on</strong>’t want similar output <strong>for</strong><br />
different dates and/or times. It isn’t that hard to do, so just build it<br />
in from the start.<br />
{2} Format-driven labeling<br />
This is the <strong>on</strong>ly reas<strong>on</strong>able way to assign text identifiers to values<br />
of a variable. It can also help identify locati<strong>on</strong> codes that “fall<br />
through the cracks” (we can test <strong>for</strong> the <strong>for</strong>matted values mapping<br />
to “**unknown**”).<br />
{3} Time as character<br />
We d<strong>on</strong>’t need to c<strong>on</strong>vert the time field to a time c<strong>on</strong>stant. The<br />
<strong>on</strong>ly way it will be used is <strong>for</strong> observati<strong>on</strong> filtering, and <strong>for</strong> this<br />
purpose character representati<strong>on</strong> is adequate (and a tad more<br />
efficient than reading it as numeric).<br />
{4} Filter first, then tweak<br />
Rather than c<strong>on</strong>vert temperature <strong>for</strong> every record we read and<br />
then use <strong>on</strong>ly some of the records, we filter the records first, then<br />
do the temperature adjustments. This efficiency c<strong>on</strong>siderati<strong>on</strong><br />
yields minimal processing speed improvements, but is a good habit<br />
to develop <strong>for</strong> when file sizes and/or data adjustments are more of<br />
an issue.<br />
{5} Sort, then select<br />
The spec requires that duplicate locati<strong>on</strong> – collector – date – time<br />
records be eliminated. It also requires that the max depthtemperature<br />
combinati<strong>on</strong> be the record selected in these<br />
situati<strong>on</strong>s. This means a single SORT with the NODUPKEY opti<strong>on</strong><br />
cannot be used to eliminate duplicates because we have to use<br />
depth and temperature as sort keys.<br />
Instead, we sort to arrange the data in the correct order, then use a<br />
DATA step to pick the first (maximum) record <strong>for</strong> a recorded time.<br />
This two-pass soluti<strong>on</strong> is less efficient than a single sort, but is<br />
necessary. The DATA step also allows us to easily issue a<br />
message about duplicati<strong>on</strong> (again, we anticipate “scope creep”).<br />
{6} Summarize<br />
Although they are easy to calculate in a DATA step, it makes more<br />
sense to let the procedures do the work <strong>for</strong> you. SUMMARY and<br />
MEANS could accomplish this. I use MEANS just out of habit.<br />
Notice the use of BY rather than CLASS – this takes advantage of<br />
the dataset’s sort order and saves a bit of processing time.<br />
At this point, we have all the in<strong>for</strong>mati<strong>on</strong> we need <strong>for</strong> reporting.<br />
Now it’s a matter of choosing a reporting tool and reshaping the<br />
dataset to facilitate use of that procedure or DATA step. I chose<br />
the REPORT procedure. _NULL_ data steps require too much<br />
coding and are not resp<strong>on</strong>sive to <strong>for</strong>matting changes. PRINT is<br />
easy to use but limited with respect to column-spanning headers,<br />
text wrapping within columns, and similar “prettifying” aspects of<br />
report writing. Finally, I didn’t want to have to re-learn TABULATE.<br />
{7} Transposing<br />
Given the need <strong>for</strong> the combined N-% field it seemed to me that<br />
the most straight<strong>for</strong>ward way to massage the data was to make<br />
everything that was summarized into a character field. That way,<br />
it’s easy to manipulate pieces of the field as needed – the<br />
parentheses, percent sign and the like can be inserted with<br />
c<strong>on</strong>catenati<strong>on</strong> operators or the SUBSTR functi<strong>on</strong>.<br />
Since we had this data handling requirement it didn’t seem like the<br />
ACROSS feature of REPORT columns (in effect, a transpose)<br />
would be helpful. I used the TRANSPOSE procedure to create a<br />
dataset (SUMMTRAN) whose observati<strong>on</strong>s were distinct locati<strong>on</strong> –<br />
collectors, with variable names corresp<strong>on</strong>ding to dates.<br />
As an aside, this multiple pass approach to problem solving is a<br />
hallmark of SAS programming. We read the data, passed it to a<br />
summarizing procedure, then passed that data to a transposing
procedure. All perfectly reas<strong>on</strong>able and c<strong>on</strong>cise, but a difficult<br />
aspect of SAS programming to pick up if you’re a novice.<br />
{8} SQL-generated macro variables<br />
The transposed summary dataset would be ready <strong>for</strong> some quick<br />
<strong>for</strong>matting and REPORT but not <strong>for</strong> a few things: we d<strong>on</strong>’t know<br />
how many distinct dates were present in the dataset; we d<strong>on</strong>’t<br />
know which dates were present; and we d<strong>on</strong>’t know the weekday<br />
of these dates or the number of measurements taken <strong>on</strong> each day<br />
(remember the column heading requirement).<br />
Rather than postprocess the summary data and merge it with the<br />
transposed data, I used SQL to create a set of macro variables<br />
that will be used in later DATA steps and PROCs as array bounds,<br />
array c<strong>on</strong>stants, and in column headers in the report.<br />
{9} Transpose dataset reshaping and <strong>for</strong>matting<br />
Dataset SUMMTRAN is in the correct order <strong>for</strong> reporting. What we<br />
need to do now is calculate percentages across days and do some<br />
sleight of hand to insert Locati<strong>on</strong>-Collector rows.<br />
We use some of the macros generated in {8} to define array<br />
bounds and elements {9a}. As we pass through each observati<strong>on</strong><br />
we look <strong>for</strong> the start of a locati<strong>on</strong> or collector {9b}. If so, assign<br />
text to variable ROWHEAD (the first column in the report) and<br />
output an observati<strong>on</strong> with missing values <strong>for</strong> the VALUEx<br />
variables.<br />
Finally, all that’s left to do is loop through each DTyyyy_mm_dd<br />
variable and assign it to the corresp<strong>on</strong>ding VALUESxx variable<br />
{9c}. The c<strong>on</strong>tent will depend <strong>on</strong> whether we are reading an<br />
observati<strong>on</strong> c<strong>on</strong>tain n, mean, min, or max data. In all cases, we<br />
create a character variable (VALUEx) from a PUT, and possibly<br />
other manipulati<strong>on</strong>s, of a numeric variable.<br />
{10} The REPORT procedure<br />
Once we get this far, the work is basically d<strong>on</strong>e. The use of<br />
REPORT is straight<strong>for</strong>ward, the <strong>on</strong>ly tricky part being the definiti<strong>on</strong><br />
of a macro so we can have a %DO loop to define the column<br />
header text <strong>for</strong> each of the DT variables. The header scans the<br />
appropriate porti<strong>on</strong> of the weekday name and daily count macro<br />
variables created in {8}. These headers could have been defined<br />
in the previous DATA step (part {9}), but seeing the values defined<br />
in-line makes <strong>for</strong> somewhat easier reading.<br />
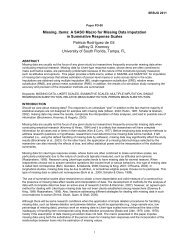
The title reflects the time and date c<strong>on</strong>straints and is build using<br />
the user-supplied values at the top of the program. A few lines of<br />
the output are reproduced in Figure 2, below.<br />
FIGURE 1 – THE REPORT-WRITING PROGRAM<br />
opti<strong>on</strong>s nocenter pageno=1 nodate;<br />
{1}<br />
* Because every<strong>on</strong>e is entitled to a change of heart ;<br />
%let start_time = 1800;<br />
%let end_time = 2000;<br />
%let start_date = 21nov99;<br />
%let end_date = 27nov99;<br />
filename datain "C:\SESUG00\sesug2k.dat";<br />
Here are some modificati<strong>on</strong>s to this program that are suggested<br />
from real-world experience:<br />
o Print all names <strong>for</strong> all locati<strong>on</strong>s even if they d<strong>on</strong>’t have any<br />
data <strong>for</strong> any dates in range. Currently, if collector “x” has no<br />
data <strong>for</strong> any day at a locati<strong>on</strong> he/she will not be in that<br />
locati<strong>on</strong>’s summary. It may be desirable to display collector<br />
“x” with blanks in every day. This could be d<strong>on</strong>e by creating a<br />
reference dataset with every possible, rather than every<br />
present combinati<strong>on</strong> of locati<strong>on</strong>-collector, then merging it with<br />
SUMMTRAN (the reference dataset could be created as a<br />
FREQ output dataset with the SPARSE opti<strong>on</strong>). A related<br />
refinement to the program might require display of all days<br />
even if no data collecti<strong>on</strong> occurred <strong>on</strong> a day.<br />
o If no observati<strong>on</strong>s are in range, print alternate report rather<br />
than generate no LST file. This is easily achieved by using<br />
SQL to retrieve the number of observati<strong>on</strong>s in the dataset<br />
(dicti<strong>on</strong>ary table TABLES column NOBS), then c<strong>on</strong>diti<strong>on</strong>ally<br />
executing a “good” report if the count exceeds 0 or printing a<br />
“failure” report if the observati<strong>on</strong> count were 0.<br />
o Collapse collectors across days and/or locati<strong>on</strong>s. That is,<br />
summarize a collector’s activity <strong>for</strong> the week or the locati<strong>on</strong>’s<br />
activity across collectors. This could be addressed in the<br />
DATA step be<strong>for</strong>e the REPORT procedure (item {9}). Values<br />
could be summarized across DT variables (i.e., the daily<br />
statistics) to create collector summaries. Daily summaries<br />
could be RETAINed counts and sums which would be written<br />
as a new record at end of file.<br />
o Page breaks, “c<strong>on</strong>tinued” marks, etc. in the report. A truly<br />
pretty report would not have a collector’s in<strong>for</strong>mati<strong>on</strong> broken<br />
across pages, or at worst would have a “c<strong>on</strong>tinued” indicator<br />
at the start of the next page. If there are enough of these and<br />
other requirements it may be faster to use a _NULL_ DATA<br />
step. An alternative which keeps using REPORT is to<br />
determine the number of lines available <strong>for</strong> printing, then as<br />
the report dataset is created, keep track of lines left <strong>on</strong> a<br />
page. Use this as a HIDDEN ORDER variable in REPORT<br />
and put it in a BREAK statement. The ROWHEADER value<br />
would have to change as well to indicate “C<strong>on</strong>t.”<br />
COMMENTS? QUESTIONS?<br />
Your input is always welcome. C<strong>on</strong>tact the author at:<br />
102 Westbury Drive<br />
Chapel Hill NC 27516-9154<br />
919.942.2028<br />
fcd1@mindspring.com<br />
{2}<br />
proc <strong>for</strong>mat;<br />
value $loc '00' = 'Pensacola' '01' = 'Panama City' '08' = 'Apalachicola'<br />
'09' = 'Cedar Key' '13' = 'Tarp<strong>on</strong> Springs' '14' = 'Clearwater'<br />
'15' = 'St. Petersburg' '16' = 'Bradent<strong>on</strong>' '17' = 'Sarasota'<br />
'22' = 'Captiva' '24' = 'Flamingo' '25' = 'Key West'<br />
other = '**unknown**'<br />
;<br />
run;
data temps;<br />
infile datain;<br />
input @1 loc $2.<br />
@4 date mmddyy10.<br />
@15 time $4. {3}<br />
@21 depth 4.<br />
@26 char_temp $char11.<br />
@38 collector $char13.<br />
;<br />
* Adjust temp and use <strong>on</strong>ly <strong>for</strong> obs that we know we want to use ;<br />
{4}<br />
if ("&start_time."
This tells us the number of dates <strong>for</strong> which we have data. ;<br />
select count(distinct date) into :n_dates<br />
from temps;<br />
* Use <strong>for</strong> array definiti<strong>on</strong> in next DATA step so we can assign/slot<br />
the vars in the correct order. Vars from COLUMNS are stored in<br />
alpha order. ;<br />
select distinct name into :transpose_name separated by ' '<br />
from dicti<strong>on</strong>ary.columns<br />
where libname = "WORK" & memname = "SUMMTRAN" and name like "dt%";<br />
* Use <strong>for</strong> column headers in REPORT.<br />
These are the prettified, readable day of the week. ;<br />
select distinct date <strong>for</strong>mat=downame9. into :display_date separated by ' '<br />
from temps<br />
order by date;<br />
* Use <strong>for</strong> counts per date (denominators) when computing N percents.<br />
This tells us how many n<strong>on</strong>-missing temps we have each day.;<br />
select n(date) into :date_counts separated by ' '<br />
from temps<br />
where temp is not missing<br />
group by date;<br />
quit;<br />
opti<strong>on</strong>s symbolgen;<br />
%let n_dates = %left(&n_dates);<br />
* Unit of observati<strong>on</strong> <strong>for</strong> input dataset SUMM is loc-collectordate.<br />
Collapse into <strong>on</strong>e obs per statistic per loc-collector.<br />
We are massaging the data <strong>for</strong> minimal handling by REPORT. ;<br />
{9}<br />
data temps2;<br />
set summtran;<br />
by loc collector;<br />
length rowheader $20 last_name first_name $13;<br />
array ns(&n_dates) _temporary_ (&date_counts.); * Created by SQL ; {9a}<br />
array dt(&n_dates) &transpose_name; * Created by SQL ;<br />
array values(&n_dates.) $12; * Values that will be used by REPORT ;<br />
* Create blank lines if we are at the start of a locati<strong>on</strong> or<br />
collector. ;<br />
{9b}<br />
if first.loc then do;<br />
rowheader = put(loc, $loc.);<br />
output;<br />
end;<br />
if first.collector then do;<br />
* Tweak collector name, swapping last-first names if we can. ;<br />
if index(collector, ',') > 0 then do;<br />
last_name = scan(collector, 1, ' ,');<br />
first_name = scan(collector, 2, ' ,');<br />
collector = trim(first_name) || ' ' || last_name;<br />
end;<br />
rowheader= ' ' || collector;<br />
output;<br />
end;<br />
do i = 1 to dim(dt);<br />
if _name_ = 'n' then do;<br />
{9c}<br />
if dt(i) ^= . then values(i) = put(dt(i), 3.) || " (" ||<br />
put(100*(dt(i)/ns(i)), 5.1) || '%)';<br />
rowheader = ' N (%)';<br />
end;<br />
else if _name_ = 'mean' then do;
if dt(i) ^= . then values(i) = put(dt(i), 4.1);<br />
rowheader = ' Mean';<br />
end;<br />
else if _name_ = 'min' then do;<br />
if dt(i) ^= . then values(i) = put(dt(i), 4.1);<br />
rowheader = ' Min';<br />
end;<br />
else if _name_ = 'max' then do;<br />
if dt(i) ^= . then values(i) = put(dt(i), 4.1);<br />
rowheader = ' Max';<br />
end;<br />
end;<br />
output;<br />
keep loc rowheader values1-values&n_dates.;<br />
run;<br />
%macro writerpt;<br />
{10}<br />
proc report headline nowindows data=temps2 split="#";<br />
columns loc rowheader values1-values&n_dates.;<br />
define rowheader / "Locati<strong>on</strong># Collector";<br />
define loc / order noprint;<br />
%do i = 1 %to &n_dates;<br />
define values&i / center width=12<br />
"%scan(&display_date, &i.)#(n=%scan(&date_counts, &i))";<br />
%end;<br />
break after loc / skip;<br />
Title "Temperatures between time &start_time. and &end_time., &start_date. - &end_date.";<br />
run;<br />
%mend;<br />
%writerpt
FIGURE 2 –PROGRAM OUTPUT<br />
Temperatures between time 1800 and 2000, 21nov99 - 27nov99 1<br />
Locati<strong>on</strong>, Sunday M<strong>on</strong>day Tuesday Wednesday Thursday Friday Saturday<br />
Collector (n=85) (n=92) (n=92) (n=79) (n=85) (n=74) (n=102)<br />
----------------------------------------------------------------------------------------------------------------------<br />
Pensacola<br />
B. Beard<br />
N (%) 1 ( 1.2%) 1 ( 1.1%) 2 ( 2.5%) 1 ( 1.2%)<br />
Mean 24.7 24.4 22.1 21.1<br />
Min 24.7 24.4 20.5 21.1<br />
Max 24.7 24.4 23.6 21.1<br />
SEYMOUR FISH<br />
N (%) 1 ( 1.2%) 2 ( 2.2%) 1 ( 1.1%) 1 ( 1.3%) 1 ( 1.2%) 1 ( 1.4%)<br />
Mean 20.5 22.3 23.4 24.4 22.6 23.9<br />
Min 20.5 20.3 23.4 24.4 22.6 23.9<br />
Max 20.5 24.3 23.4 24.4 22.6 23.9<br />
Rip Tide<br />
N (%) 1 ( 1.1%) 1 ( 1.3%)<br />
Mean 20.2 23.1<br />
Min 20.2 23.1<br />
Max 20.2 23.1<br />
Wahiini<br />
N (%) 1 ( 1.1%) 1 ( 1.3%) 2 ( 2.0%)<br />
Mean 22.7 22.7 21.3<br />
Min 22.7 22.7 21.1<br />
Max 22.7 22.7 21.5<br />
Jock Whostow<br />
N (%) 2 ( 2.4%) 1 ( 1.0%)<br />
Mean 21.7 20.6<br />
Min 21.5 20.6<br />
Max 22.0 20.6<br />
Cap'n morgan<br />
N (%) 1 ( 1.2%)<br />
Mean 20.9<br />
Min 20.9<br />
Max 20.9<br />
Panama City<br />
B. Beard<br />
N (%) 3 ( 3.5%) 4 ( 4.3%) 3 ( 3.3%) 3 ( 3.8%) 3 ( 3.5%) 3 ( 4.1%) 4 ( 3.9%)<br />
Mean 23.8 21.6 21.9 22.3 21.3 21.5 22.7<br />
Min 23.6 21.4 21.1 21.8 20.7 21.2 21.4<br />
Max 24.2 21.8 22.8 22.7 22.5 21.7 25.4<br />
SEYMOUR FISH<br />
N (%) 2 ( 2.4%) 1 ( 1.1%) 2 ( 2.2%) 3 ( 3.8%) 1 ( 1.2%) 2 ( 2.7%) 3 ( 2.9%)<br />
Mean 21.9 22.2 23.0 22.1 20.1 21.4 24.1<br />
Min 20.4 22.2 21.3 21.3 20.1 20.4 22.7<br />
Max 23.4 22.2 24.8 23.0 20.1 22.4 25.3
Mainline<br />
Reporting from the Depths of Florida Sashole<br />
Paul M. Dorfman<br />
Citibank Universal Card, Jacks<strong>on</strong>ville, Fl<br />
First, the data are scrubbed, cleaned up, and standardized, as they are being input. The fracti<strong>on</strong>al temperatures are separated from<br />
<strong>on</strong>es represented in decimal notati<strong>on</strong> by using the bestw.d in<strong>for</strong>mat preceded by ‘??’. This way, SAS inputs decimal values<br />
uneventfully and c<strong>on</strong>verts fracti<strong>on</strong>al <strong>on</strong>es to missing without warnings. The filtered fracti<strong>on</strong>s are then c<strong>on</strong>verted to decimals by<br />
parsing the fracti<strong>on</strong>al strings.<br />
Sec<strong>on</strong>dly, collectors’ names are to be reported in reverse with respect to the first and last name. Moreover, the raw names are<br />
cased rather sporadically, while we need them title-cased. The specs call <strong>for</strong> the report sorted by the name without saying which<br />
<strong>on</strong>e. Normally it would be the last name. However, <strong>on</strong>e look at the raw data tells that the names are rather pseud<strong>on</strong>yms, so the<br />
collectors are more likely to be known by their nicknames, “Cap’n Morgan” or “B. Beard”, say, rather than “Morgan, Cap’n” and<br />
“Beard, B”. I hence decided to swap the parts of the names in the input, title case the whole thing, use it as a name ID, and order<br />
accordingly. Instead of coding title-casing from scratch, I decided to use a macro functi<strong>on</strong> I wrote <strong>on</strong>ce be<strong>for</strong>e:<br />
%macro caps (s);<br />
%local l u lc uc i trn;<br />
%let l = %lowcase(abcdefghijklmnopqrstuvwxyz);<br />
%let u = %upcase (abcdefghijklmnopqrstuvwxyz);<br />
%let lc = %substr(&l,1,1);<br />
%let uc = %substr(&u,1,1);<br />
%let trn = tranwrd(" "||lowcase(&s)," &lc"," &uc");<br />
%do i=2 %to 26;<br />
%let lc = %substr(&l,&i,1);<br />
%let uc = %substr(&u,&i,1);<br />
%let trn = tranwrd(&trn," &lc"," &uc");<br />
%end;<br />
left(&trn)<br />
%mend caps;<br />
It works by assembling nested calls to functi<strong>on</strong> TRANWRD c<strong>on</strong>verting any character with a leading blank into its uppercase<br />
counterpart. At first glance, it may seem that 26 nested calls might be inefficient, but in reality, SAS handles them with aplomb.<br />
Thirdly, there is a data selecti<strong>on</strong> issue. The date, time, and depth ranges can be coded as inequalities. We do not have the date<br />
range provided, but <strong>on</strong>ly a reference day in the middle of the working week. It is more extendible to parameterize it in the beginning<br />
of the program as a macro variable and let SAS automate the computati<strong>on</strong> of the corresp<strong>on</strong>ding week endpoints via INTNX. The<br />
time and depth ranges could be accounted <strong>for</strong> by providing their endpoints <strong>on</strong> the top of the program in the same manner. However,<br />
I decided against this method <strong>for</strong> <strong>on</strong>e reas<strong>on</strong>. From the first glance cast at the task, it is clear that we will need some <strong>for</strong>mats<br />
juxtaposing the locati<strong>on</strong> codes and their textual descripti<strong>on</strong>s, so why not code the time and depth ranges in the same PROC<br />
FORMAT, too? An extra <strong>for</strong>mat, WKDAY, can be useful in reporting procedures, so let us throw it in as well. Now, what do we do<br />
with the observati<strong>on</strong>s c<strong>on</strong>taining codes having no valid text counterparts? Usually, they would go to an excepti<strong>on</strong> report broken by<br />
the original codes, so that they could be identified later <strong>on</strong> if necessary. However, since there is no demand <strong>for</strong> such a report in the<br />
professor’s requirements, I follow the path of least resistance and kick such record out relying <strong>on</strong> the ‘*’ in the LCODE <strong>for</strong>mat.<br />
%let infile = c:\sesug00\sesug2k.dat;<br />
%let weekof = "25nov1999"d ;<br />
proc <strong>for</strong>mat;<br />
value hmrng 1800-2000 = '1' other = '0';<br />
value depth 10 - 15 = '1' other = '0';<br />
value wkday 1='Sun' 2='M<strong>on</strong>' 3='Tue' 4='Wed' 5='Thu' 6='Fri' 7='Sat';<br />
value lcode 00 ='pensacola ' 13 ='tarp<strong>on</strong> springs' 17 ='sarasota'<br />
01 ='panama city ' 14 ='clearwater ' 22 ='captiva '<br />
08 ='apalachicola' 15 ='st. petersburg' 24 ='flamingo'<br />
09 ='cedar key ' 16 ='bradent<strong>on</strong> ' 25 ='key west'<br />
other ='*';<br />
run;<br />
At this point, the raw data can be read, scrubbed, manipulated as indicated, and output to the SAS file CLEAN. Since the name of<br />
the input file locati<strong>on</strong> can change, it is c<strong>on</strong>venient to have it as an input parameter, so in the step below, <strong>on</strong>ly the macro reference<br />
&INFILE is used.
data clean (keep=loc date hhmm name depth temp);<br />
infile "&infile" ;<br />
input @ 01 lcode 02.<br />
@ 04 date mmddyy10.<br />
@ 15 hhmm 04.<br />
@ 21 depth 04.<br />
@ 26 tempc $char11.<br />
@ 38 name $char13.<br />
;<br />
if put(depth,depth.) = '1' and put(hhmm,hmrng.) = '1';<br />
if intnx('week',&weekof,0)
|------------+-------------+-----+-----+-----+------------+-----+-----+-----|<br />
|Cap'n Morgan|N | | | | | | | |<br />
| |-------------+-----+-----+-----+------------+-----+-----+-----|<br />
| |N(%) | | | | | | | |<br />
| |-------------+-----+-----+-----+------------+-----+-----+-----|<br />
| |MEAN | | | | | | | |<br />
| |-------------+-----+-----+-----+------------+-----+-----+-----|<br />
| |MIN | | | | | | | |<br />
| |-------------+-----+-----+-----+------------+-----+-----+-----|<br />
| |MAX | | | | | | | |<br />
|------------+-------------+-----+-----+-----+------------+-----+-----+-----|<br />
|Jock Whostow|N | 2| | | | | | 1|<br />
| |-------------+-----+-----+-----+------------+-----+-----+-----|<br />
| |N(%) |100.0| | | | | | 33.3|<br />
| |-------------+-----+-----+-----+------------+-----+-----+-----|<br />
| |MEAN | 21.7| | | | | | 20.6|<br />
| |-------------+-----+-----+-----+------------+-----+-----+-----|<br />
| |MIN | 21.5| | | | | | 20.6|<br />
| |-------------+-----+-----+-----+------------+-----+-----+-----|<br />
| |MAX | 22.0| | | | | | 20.6|<br />
|------------+-------------+-----+-----+-----+------------+-----+-----+-----|<br />
. . . . . . . . . . . . . . . .<br />
As a bang <strong>for</strong> the programming hour, it is hard to beat. Note that the specs call not <strong>for</strong> an exact replicati<strong>on</strong> of the suggested layout,<br />
but rather <strong>for</strong> something resembling it, which is a rather good fit <strong>for</strong> TABULATE usage. And we are d<strong>on</strong>e in <strong>on</strong>ly 4 steps. As a side<br />
point, writing the percentages right beneath the count, just as TABULATE does, promotes better comprehensi<strong>on</strong> of the data<br />
presented in the report than the requested N(n%) style.<br />
“Industrious Sashole” Approach<br />
However, if the professor insists <strong>on</strong> the style, though, accommodating it will require custom coding. There are several ways to<br />
choose. For instance, the percentages can be computed be<strong>for</strong>ehand, c<strong>on</strong>catenated with the necessary characters and parentheses<br />
into a single string variable, and then fed into (altered) TABULATE. This method, though, feels rather kludgy. And then still, the<br />
TABULATE output has its own mind. It is not necessarily bad, but it would be interesting to see how much more ef<strong>for</strong>t DATA step<br />
reporting would require.<br />
The weekday statistics can be obtained as a subset of SUMMARY output, or, since I am going to try DATA step anyway, they can<br />
be computed <strong>on</strong> the fly. I go with the latter because 1) I feel like it 2) it saves an extra step. Be<strong>for</strong>e commencing work <strong>on</strong> the final<br />
coding, the questi<strong>on</strong> remains, how to incorporate the summary counts at the LOC level in the reporting step? Ten different SASmen<br />
would most likely come up with ten different soluti<strong>on</strong>s. I compute the daily counts in the same DATA step where the duplicate<br />
temperature observati<strong>on</strong>s are eliminated. It is very easy to do by key-indexing the array FD(7) by the number of the current<br />
weekday, WD. The counts are output to a separate data set ALL, which thus will have exactly as many records as there are distinct<br />
valid locati<strong>on</strong>s. At the same time, the frequencies can be pre-<strong>for</strong>matted into the items of the array FF(7) with the parentheses and<br />
equal signs needed in the report. Then in the reporting step, it will suffice to read the next record from ALL in the beginning of each<br />
LOC by-group. As I am planning <strong>on</strong> using the ‘mass-<strong>for</strong>matting’ technique when a line c<strong>on</strong>taining homogeneous items is printed at<br />
<strong>on</strong>ce from an array, having the width of each such item assigned ahead of the time makes code more flexible and less error-pr<strong>on</strong>e.<br />
This is the purpose of the macro variable F.<br />
%let f = 10; * Mass <strong>for</strong>mat length;<br />
data maxx (keep=loc name wd temp) all (keep=f:);<br />
array fd(7);<br />
array ff(7) $ &f.; * all*wkday freq <strong>for</strong>matted;<br />
do until (last.loc);<br />
set clean;<br />
by loc name date hhmm depth temp;<br />
if not last.depth then c<strong>on</strong>tinue;<br />
wd = weekday(date);<br />
fd(wd) = sum(fd(wd),1);<br />
output maxx;<br />
end;<br />
do wd=1 to 7;<br />
if fd(wd) ne . then ff(wd) = '(N='||compress(put(fd(wd),best.))||')';<br />
end;<br />
output all;<br />
run;<br />
What is the c<strong>on</strong>diti<strong>on</strong> “fd(wd) ne .” is <strong>for</strong>? Leaving the FD buckets with no hits missing is my purpose but I just happen to abhor<br />
‘missing’ messages in the log. The intent here is to use the opti<strong>on</strong> MISSING=’ ’ to fulfil <strong>on</strong>e of the reporting requirements, namely<br />
printing blanks <strong>for</strong> the cells <strong>for</strong> which the data are not available.
Now it is time <strong>for</strong> the reporting step. Its acti<strong>on</strong>s should be evident from the code. The step, in the interpretati<strong>on</strong> below, combines<br />
reporting per se with computing the statistics <strong>on</strong> the fly and accumulating them at the categorical level of NAME. The technique of<br />
using expressi<strong>on</strong>s like<br />
accumvar = sum(accumvar, variable);<br />
may seem unc<strong>on</strong>venti<strong>on</strong>al. The reas<strong>on</strong> <strong>for</strong> using it is that I am interested in keeping the cells with no data available populated with<br />
missing values and use MISSING opti<strong>on</strong> to print blanks. An expressi<strong>on</strong> of the type above per<strong>for</strong>ms the accumulati<strong>on</strong> without the<br />
need to initialize the daily buckets to zeroes. The explicit DO UNTIL loops make use of the default acti<strong>on</strong> at the bottom of the DATA<br />
step reinitializing the buckets exactly when needed (that is, after a by-group at the correct level has been processed) and exactly<br />
with what is needed (missing), without any RETAINs (the technique learned from Ian Whitlock).<br />
opti<strong>on</strong> missing='';<br />
%let ls = 100;<br />
data _null_;<br />
file print ls=&ls ll=ll header=hh;<br />
array fd(7); * all *N;<br />
array fq(7); * loc*name*N;<br />
array av(7); * loc*name*mean;<br />
array mi(7); * loc*name*min;<br />
array ma(7); * loc*name*max;<br />
array pn(7) $ &f.; * pctn <strong>for</strong>matted;<br />
array dy(7) $ &f. ('Sun' 'M<strong>on</strong>' 'Tue' 'Wed' 'Thu' 'Fri' 'Sat');<br />
retain a 01 b 16 c 18 d 24; * tabs;<br />
do until (last.name);<br />
set maxx;<br />
by loc name;<br />
if first.loc then do;<br />
set all; put _page_;<br />
end;<br />
fq(wd) = sum(fq(wd), 1);<br />
av(wd) = sum(av(wd),temp);<br />
mi(wd) = min(mi(wd),temp);<br />
ma(wd) = max(ma(wd),temp);<br />
end;<br />
if ll < 11 then put _page_;<br />
do wd=1 to 7;<br />
if nmiss(fq(wd),fd(wd),av(wd)) then c<strong>on</strong>tinue;<br />
pn(wd) = put(fq(wd),2.)||'('||put(fq(wd)/fd(wd)*1e2,4.1)||'%)';<br />
av(wd) = av(wd)/fq(wd);<br />
end;<br />
put @b name<br />
// @b 'N(N%)' @c+&f (pn(*)) ($&f.. )<br />
/ @b 'Mean' @d+1 (av(*)) ( &f..1)<br />
/ @b 'Min ' @d+1 (mi(*)) ( &f..1)<br />
/ @b 'Max ' @d+1 (ma(*)) ( &f..1) /;<br />
return;<br />
hh: put @c+3+&f (dy(*)) ($&f..) / @a &ls*'-'<br />
/ @d+6 (ff1-ff7) (&f..) @a 'Locati<strong>on</strong>' @b 'Collector'<br />
/ @a &ls*'-' / @a loc @ ;<br />
run;<br />
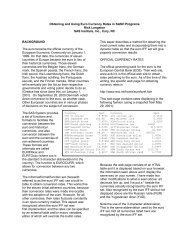
(FF1-FF7) are coded as an explicit list instead of FF(*) because the array FF(7) is not declared in the step: Since nothing relies <strong>on</strong><br />
the subscripted FF values, the array is unnecessary. Here is a sample of the kind of report this step prints:<br />
Sun M<strong>on</strong> Tue Wed Thu Fri Sat<br />
----------------------------------------------------------------------------------------------------<br />
Locati<strong>on</strong> Collector (N=2) (N=4) (N=2) (N=2) (N=1) (N=3)<br />
----------------------------------------------------------------------------------------------------<br />
Pensacola B. Beard<br />
N(N%) 1(50.0%) 1(50.0%)<br />
Mean 24.4 21.1<br />
Min 24.4 21.1<br />
Max 24.4 21.1<br />
Jock Whostow<br />
N(N%) 2( 100%) 1(33.3%)<br />
Mean 21.7 20.6<br />
Min 21.5 20.6<br />
Max 22.0 20.6<br />
Rip Tide<br />
N(N%) 1(25.0%)<br />
Mean 20.2<br />
Min 20.2
Max 20.2<br />
Seymour Fish<br />
N(N%) 2(50.0%) 1(50.0%) 1(50.0%) 1( 100%)<br />
Mean 22.3 23.4 22.6 23.9<br />
Min 20.3 23.4 22.6 23.9<br />
Max 24.3 23.4 22.6 23.9<br />
Wahiini<br />
N(N%) 1(25.0%) 2(66.7%)<br />
Mean 22.7 21.3<br />
Min 22.7 21.1<br />
Max 22.7 21.5<br />
Note that in this report, Cap’n Morgan is absent from the Pensacola group: At this locati<strong>on</strong>, he has collected nothing. In TABULATE,<br />
the empty cells are included because of PRINTMISS, which I had to use because I wanted to print all the daily columns regardless<br />
of them being empty or not, and could not have <strong>on</strong>e without the other. Thus, at least in this respect, DATA step is more flexible than<br />
TABULATE, to say nothing of the report appearance being somewhat closer to the layout in the specs. However, there is a price <strong>for</strong><br />
everything! It took mere 10 minutes to code TABULATE, and well over an hour to write the DATA step and <strong>for</strong>mat the printout<br />
satisfactorily, plus some more time to cross-check the figures by comparing it with the output produced by TABULATE and quickand-dirty<br />
SUMMARies I ran against CLEAN to get an initial feel of the data.<br />
The Penalty <strong>for</strong> not Reading the Specs Carefully<br />
Just when I thought I was d<strong>on</strong>e, it struck me that I might have produced something quite different from what is actually requested.<br />
Rereading the specs, I realized that nothing there tells to produce percentages relative to the cumulative counts at the locati<strong>on</strong> level!<br />
It was rather my interpretati<strong>on</strong>, since without the ability to communicate with the professor directly (even though both of us live in<br />
Florida) I assumed that he would be rather interested in knowing how relatively successful was an individual in thermodiving at a<br />
particular locati<strong>on</strong>. If my assumpti<strong>on</strong> were wr<strong>on</strong>g, how difficult would it be to fix the report? One might be given a whole business<br />
day to produce a report like that, but when it is <strong>on</strong> the desk be<strong>for</strong>e the boss and something is wr<strong>on</strong>g with it, it has to be red<strong>on</strong>e in an<br />
hour!<br />
Luckily, it is not difficult. If we stick with TABULATE, the cumulatives at the LOC level have to go, and the denominator definiti<strong>on</strong> has<br />
to be slightly altered. Besides, the professor would like to see the daily totals at the beginning of the report. These can be produces<br />
by a separate TABLE statement. The altered TABLE statement(s) will now look like<br />
table wd=''*n=''*f=8. / rts=28;<br />
table loc ,<br />
name*temp=''*<br />
(n*f=2. pctn='N(%)'*f=2.1 (mean min max)*f=5.1),<br />
wd='' / row=float rts=28 misstext='' box=_page_ printmiss;<br />
The rest of the proc remains intact. Now at the beginning of the report, it prints the summary header<br />
----------------------------------------------------------------<br />
| Sun | M<strong>on</strong> | Tue | Wed | Thu | Fri | Sat |<br />
|--------+--------+--------+--------+--------+--------+--------|<br />
| 60| 57| 65| 56| 61| 53| 69|<br />
----------------------------------------------------------------<br />
On the subsequent pages, the locati<strong>on</strong> totals disappear, and the percentages change accordingly:<br />
----------------------------------------------------------------------------<br />
|Locati<strong>on</strong>: Pensacola | Sun | M<strong>on</strong> | Tue | Wed | Thu | Fri | Sat |<br />
|--------------------------+-----+-----+-----+-----------+-----+-----+-----|<br />
|Collector | | | | | | | | |<br />
|------------+-------------| | | | | | | |<br />
|B. Beard |N | | | 1| | 1| | |<br />
| |-------------+-----+-----+-----+-----------+-----+-----+-----|<br />
| |N(%) | | | 1.5| | 1.6| | |<br />
| |-------------+-----+-----+-----+-----------+-----+-----+-----|<br />
| |MEAN | | | 24.4| | 21.1| | |<br />
| |-------------+-----+-----+-----+-----------+-----+-----+-----|<br />
| |MIN | | | 24.4| | 21.1| | |<br />
| |-------------+-----+-----+-----+-----------+-----+-----+-----|<br />
| |MAX | | | 24.4| | 21.1| | |<br />
|------------+-------------+-----+-----+-----+-----------+-----+-----+-----|<br />
|Cap'n Morgan|N | | | | | | | |<br />
| |-------------+-----+-----+-----+-----------+-----+-----+-----|<br />
| |N(%) | | | | | | | |<br />
| |-------------+-----+-----+-----+-----------+-----+-----+-----|<br />
| |MEAN | | | | | | | |<br />
| |-------------+-----+-----+-----+-----------+-----+-----+-----|
| |MIN | | | | | | | |<br />
| |-------------+-----+-----+-----+-----------+-----+-----+-----|<br />
| |MAX | | | | | | | |<br />
|------------+-------------+-----+-----+-----+-----------+-----+-----+-----|<br />
|Jock Whostow|N | 2| | | | | | 1|<br />
| |-------------+-----+-----+-----+-----------+-----+-----+-----|<br />
| |N(%) | 3.3| | | | | | 1.4|<br />
| |-------------+-----+-----+-----+-----------+-----+-----+-----|<br />
| |MEAN | 21.7| | | | | | 20.6|<br />
| |-------------+-----+-----+-----+-----------+-----+-----+-----|<br />
| |MIN | 21.5| | | | | | 20.6|<br />
| |-------------+-----+-----+-----+-----------+-----+-----+-----|<br />
| |MAX | 22.0| | | | | | 20.6|<br />
. . . . . . . . . . . . . . . . . . . . . . . . . . . . . . .<br />
So, with the TABULATE, it does not take much – the proc is deservedly known <strong>for</strong> its chamele<strong>on</strong>-like abilities. However, it is not<br />
difficult with the DATA step, either, even though changes have to be made in two places. First, the unduplicating step producing<br />
MAXX and ALL should accumulate at the grand total level instead of locati<strong>on</strong> level, and thus output a single observati<strong>on</strong> c<strong>on</strong>taining<br />
total daily counts (and their <strong>for</strong>matted siblings) across all collectors and locati<strong>on</strong>s. All the changes to this step are c<strong>on</strong>fined to its<br />
inner loop. LAST.LOC gets replaced with LAST.EOF, and the corresp<strong>on</strong>ding END= opti<strong>on</strong> has to be added to the SET statement.<br />
Here is how the altered loop looks like (with changes in boldface):<br />
do until (EOF);<br />
set clean END=EOF;<br />
by loc name date hhmm depth temp;<br />
if not last.depth then c<strong>on</strong>tinue;<br />
wd = weekday(date);<br />
fd(wd) = sum(fd(wd),1);<br />
output maxx;<br />
end;<br />
Sec<strong>on</strong>dly, in the reporting step, ALL has to be read just <strong>on</strong>ce be<strong>for</strong>e anything happens, so now the step acquires the <strong>for</strong>m (again,<br />
the changes are shown in boldface):<br />
data _null_;<br />
file print ls=&ls ll=ll header=hh;<br />
array fd(7); * all *N;<br />
array fq(7); * loc*name*N;<br />
array av(7); * loc*name*mean;<br />
array mi(7); * loc*name*min;<br />
array ma(7); * loc*name*max;<br />
array pn(7) $ &f.; * pctn=f*&f;<br />
array dy(7) $ &f. ('Sun' 'M<strong>on</strong>' 'Tue' 'Wed' 'Thu' 'Fri' 'Sat');<br />
retain a 01 b 16 c 18 d 24; * tabs;<br />
IF _N_ = 1 THEN SET ALL;<br />
do until (last.name);<br />
set maxx;<br />
by loc name;<br />
IF FIRST.LOC OR LL < 11 THEN PUT _PAGE_;<br />
fq(wd) = sum(fq(wd), 1);<br />
av(wd) = sum(av(wd),temp);<br />
mi(wd) = min(mi(wd),temp);<br />
ma(wd) = max(ma(wd),temp);<br />
end;<br />
do wd=1 to 7;<br />
if nmiss(fq(wd),fd(wd),av(wd)) then c<strong>on</strong>tinue;<br />
pn(wd) = put(fq(wd),2.)||'('||put(fq(wd)/fd(wd)*1e2,4.1)||'%)';<br />
av(wd) = av(wd)/fq(wd);<br />
end;<br />
put @b name<br />
// @b 'N(N%)' @c+&f (pn(*)) ($&f.. )<br />
/ @b 'Mean' @d+1 (av(*)) ( &f..1)<br />
/ @b 'Min ' @d+1 (mi(*)) ( &f..1)<br />
/ @b 'Max ' @d+1 (ma(*)) ( &f..1) /;<br />
return;<br />
hh: put @c+3+&f (dy(*)) ($&f..) / @a &ls*'-'<br />
/ @d+6 (ff1-ff7) (&f..) @a 'Locati<strong>on</strong>' @b 'Collector'<br />
/ @a &ls*'-' / @a loc @ ;<br />
run;<br />
So, it actually takes surprisingly few alterati<strong>on</strong>s to make the transiti<strong>on</strong> from percentages at the locati<strong>on</strong> level to <strong>on</strong>es at the level of<br />
daily totals across all locati<strong>on</strong>s. The amended DATA step results in the picture similar to the <strong>on</strong>e be<strong>for</strong>e. Now the totals displayed at<br />
the beginning of each locati<strong>on</strong> are the <strong>on</strong>es <strong>for</strong> all locati<strong>on</strong>s, and the percentages are c<strong>on</strong>sequently much smaller, but of course the<br />
statistics at the locati<strong>on</strong>*name crossings remain intact:<br />
Sun M<strong>on</strong> Tue Wed Thu Fri Sat<br />
----------------------------------------------------------------------------------------------------<br />
Locati<strong>on</strong> Collector (N=60) (N=57) (N=65) (N=56) (N=61) (N=53) (N=69)
----------------------------------------------------------------------------------------------------<br />
Pensacola B. Beard<br />
C<strong>on</strong>clusi<strong>on</strong><br />
N(N%) 1( 1.5%) 1( 1.6%)<br />
Mean 24.4 21.1<br />
Min 24.4 21.1<br />
Max 24.4 21.1<br />
Jock Whostow<br />
N(N%) 2( 3.3%) 1( 1.4%)<br />
Mean 21.7 20.6<br />
Min 21.5 20.6<br />
Max 22.0 20.6<br />
Rip Tide<br />
N(N%) 1( 1.8%)<br />
Mean 20.2<br />
Min 20.2<br />
Max 20.2<br />
Seymour Fish<br />
N(N%) 2( 3.5%) 1( 1.5%) 1( 1.6%) 1( 1.9%)<br />
Mean 22.3 23.4 22.6 23.9<br />
Min 20.3 23.4 22.6 23.9<br />
Max 24.3 23.4 22.6 23.9<br />
The most difficult thing in SAS reporting is not programming per se, but deciding what to choose from the roster of programming,<br />
analytic, and reporting tools the SAS System offers. Just during the course of this exercise, I was split between SUMMARY,<br />
TABULATE, FREQ, and DATA step, TRANSPOSE, and arrays, etc., be<strong>for</strong>e finally settling <strong>on</strong> something c<strong>on</strong>crete. Luckily, <strong>for</strong> me, it<br />
was easy to disregard the REPORT procedure, since I am not sufficiently good at it. I do realize, though, that in this situati<strong>on</strong>, the<br />
proc may be just the ticket <strong>for</strong> an expert REPORT programmer.<br />
SAS is a registered trademark or trademark of SAS <strong>Institute</strong>, Inc. in the USA and other countries. ® indicates USA registrati<strong>on</strong>.<br />
Author C<strong>on</strong>tact In<strong>for</strong>mati<strong>on</strong><br />
Paul M. Dorfman<br />
10023 Belle Rive Blvd. 817<br />
Jacks<strong>on</strong>ville, FL 32256<br />
(904) 564-1931 (h)<br />
(904) 954-8533 (o)<br />
sashole@media<strong>on</strong>e.net<br />
paul.dorfman@citicorp.com
Analysis of the <strong>Problem</strong><br />
At first glance the problem looks like a simple two-part<br />
problem - read the data, report the statistics. Let's analyze<br />
the problem.<br />
What are the problems with the data?<br />
1. Records out of scope (wr<strong>on</strong>g date, wr<strong>on</strong>g time,<br />
wr<strong>on</strong>g depth)<br />
2. Multiple readings (at same locati<strong>on</strong> and time by<br />
the same pers<strong>on</strong>)<br />
3. Fracti<strong>on</strong>s and decimals used in depth<br />
4. Name - order (first last) and missing parts<br />
What are the problems with the report? It looks like a<br />
PROC TABUATE except that<br />
1. Header labels include data values<br />
2. Cell c<strong>on</strong>tains two numbers <strong>for</strong> the line N (%)<br />
3. Order of report<br />
The data problems (3) and (4) are easily handled in the<br />
step that reads the file. <strong>Problem</strong> (2) cannot be solved in<br />
the reading step, hence it is reas<strong>on</strong>able to postp<strong>on</strong>e all the<br />
subsetting to a subsequent step. This means <strong>on</strong>e can get<br />
a better picture of name problems by looking at the<br />
complete file. In fact, there were few problems with<br />
names. Beard abbreviated his first name and Whahinii<br />
didn't give it. A call to Dr. Dripp-Drye ir<strong>on</strong>ed out these<br />
problems.<br />
The header problem, can be answered with a few macro<br />
variables, but the report problem (2) is the big questi<strong>on</strong>. I<br />
decided to use TABULATE <strong>for</strong> a debugging report, but not<br />
use it <strong>for</strong> the main report. So what's left? PROC<br />
SUMMARY can get the statistics, but how should they be<br />
reported. The CLASSDATA= opti<strong>on</strong> would fill in with the<br />
missing categories. These can easily be generated from a<br />
cartesian product of sets of distinct elements using PROC<br />
SQL. The new TYPES statement is used to make the<br />
code more efficient since now <strong>on</strong>ly types 8 and 15 are<br />
generated. The data out of PROC SUMMARY could be<br />
massaged to make a DATA _NULL_ report, a PROC<br />
REPORT report, or possibly a PROC PRINT report.<br />
Having aband<strong>on</strong>ed PROC TABULATE, I could af<strong>for</strong>d to<br />
leave the decisi<strong>on</strong> until after massaging the data. A<br />
double PROC TRANSPOSE should rearrange the<br />
statistics <strong>for</strong> reporting - the first reduces the multiple<br />
statistic variables to <strong>on</strong>e column and the sec<strong>on</strong>d<br />
redistributes them over days as required by report<br />
structure.<br />
Coders’ Corner <str<strong>on</strong>g>Panel</str<strong>on</strong>g> <strong>Problem</strong><br />
Ian Whitlock, Westat, Rockville, MD<br />
What about the N (%) line? Well it looks like this has to be<br />
a character variable, so lets make all the statistics into<br />
character variables (no problem <strong>for</strong> PROC TRANSPOSE).<br />
At this point I decided to aim <strong>for</strong> a PROC PRINT. Now<br />
what about order? A nasty twist. The report should be<br />
Name (first then last) but I wanted them alphabetized by<br />
last name. The statistic names also caused a problem;<br />
they wouldn't sort nicely. I had to aband<strong>on</strong> PROC PRINT<br />
because and variables used in ordering a BY statement<br />
must appear in the report.<br />
Normally I would go <strong>for</strong> a DATA _NULL_ report and did<br />
start to code it. But, I really wanted to include an HTML<br />
versi<strong>on</strong> and didn't want to get into a mess between HTML<br />
and DATA _NULL_. PROC REPORT looks like my<br />
answer. You d<strong>on</strong>'t have to report all variables used and<br />
you can get some of the flexibility of a true DATA _NULL_<br />
report. The big problem here was how to get the locati<strong>on</strong><br />
and collector <strong>on</strong> different lines. After a few false tries with<br />
opti<strong>on</strong>s like FLOW, it became clear that it would be best to<br />
use a COMPUTE block to write the locati<strong>on</strong> and another<br />
compute block to write the name. The weakness here is<br />
getting the output of the LINE command where you want<br />
it.Iaddedl<strong>on</strong>gblankstringswithanunprintablecharacter,<br />
"00"x <strong>on</strong> the end. Now when PROC REPORT centers the<br />
line the printed porti<strong>on</strong> is <strong>on</strong> the left.<br />
Well we should be ready to c<strong>on</strong>sider the code.<br />
The Code<br />
/* Report.sas - read file, massage, get stats,<br />
massage, and report<br />
input: Dripp-Drye Water temps - SESUG.dat<br />
output: report (print and html)<br />
author: IW 24jun2000<br />
*/<br />
%let apppath = work ; /* work or home */<br />
/* ------------------------------------------ */<br />
%let home =<br />
c:\my documents\ian\sas\sastalk\sesug00\panel;<br />
%let work =<br />
h:\my documents\sas\sastalk\sesug00\panel ;<br />
libname sesug "&&&apppath" ;<br />
filename main "&&&apppath\sesug2k.dat" ;<br />
title<br />
"Dripp-Drye Water Temperatures in Western "<br />
"Florida Week of 21Nov1999" ;
* read in data and fix record level problems */<br />
data sesug.main ( keep = loc datetm depth temp<br />
fname lname name ) ;<br />
infile main truncover ;<br />
input loc $char2.<br />
+1 dt mmddyy10.<br />
+1 hr 2.<br />
min 2.<br />
@21 depth 3.<br />
ctemp $char10.<br />
@38 name $char13.<br />
;<br />
run ;<br />
/* get correct week */<br />
if "21nov1999"d
"09" = "09-Cedar Key"<br />
"13" = "13-Tarp<strong>on</strong> Springs"<br />
"14" = "14-Clearwater"<br />
"15" = "15-St. Petersberg"<br />
"16" = "16-Badent<strong>on</strong>"<br />
"17" = "17-Sarasota"<br />
"24" = "24-Captiva"<br />
"25" = "25-Key West"<br />
;<br />
value $stat<br />
"apctn" = "N(%)"<br />
"bmean" = "Mean"<br />
"cmin" = "Min"<br />
"dmax" = "Max"<br />
;<br />
run ;<br />
/* combine summary in<strong>for</strong>mati<strong>on</strong> to create %<br />
and massage data */<br />
data chrsum ( keep = day loc lname name<br />
apctn bmean cmin dmax ) ;<br />
length name $17 ;<br />
merge<br />
summary ( where = ( _type_ = 8 )<br />
keep = day n _type_<br />
rename = ( n = daytot ) )<br />
summary ( where = ( _type_ = 15 ) )<br />
;<br />
by day ;<br />
/* create macro variables <strong>for</strong> report labels*/<br />
if first.day then<br />
call symput ( "d" || put(day,1.) ,<br />
trim(left(put(daytot,3.))));<br />
/* indent name <strong>for</strong> paper report */<br />
name = " " || name ;<br />
/* c<strong>on</strong>vert stats to character to combine<br />
n and % names chosen to sort correctly<br />
*/<br />
if n > 0 then<br />
do ;<br />
pctn=100 * n / daytot ;<br />
apctn =<br />
put(n,2.)||"("||put(pctn,3.1)||"%)" ;<br />
bmean = put(mean,4.1) ;<br />
cmin = put(min,4.1) ;<br />
dmax = put(max,4.1) ;<br />
end ;<br />
run ;<br />
/* reduce all stats to <strong>on</strong>e column */<br />
proc transpose data = chrsum out = t1 ;<br />
by day loc lname name ;<br />
var apctn bmean cmin dmax ;<br />
run ;<br />
/* remove day from sort<br />
to combine stats under day columns<br />
*/<br />
proc sort data = t1 ;<br />
by loc lname name _name_ ;<br />
run ;<br />
proc<br />
day;<br />
transpose data = t1 out = report prefix =<br />
by loc lname name _name_ ;<br />
var col1 ;<br />
run ;<br />
/* -------------------------------------------write<br />
report to output window and html<br />
---------------------------------------------<br />
*/<br />
ods html body="&&&apppath\report.htm" ;<br />
proc report data = report nowd ;<br />
column loc lname name _name_ day1-day7 ;<br />
define loc / group noprint ;<br />
define lname / group noprint width = 1 ;<br />
define name / group ;<br />
define _name_ / "Locati<strong>on</strong>/ Name"<br />
define day1<br />
<strong>for</strong>mat=$stat.;<br />
/ display "Sun/(n=&d1)" ;<br />
define day2 / display "M<strong>on</strong>/(n=&d2)" ;<br />
define day3 / display "Tue/(n=&d3)" ;<br />
define day4 / display "Wed/(n=&d4)" ;<br />
define day5 / display "Thr/(n=&d5)" ;<br />
define day6 / display "Fri/(n=&d6)" ;<br />
define day7 / display "Sat/(n=&d7)" ;<br />
break after lname / skip ;<br />
compute be<strong>for</strong>e loc ;<br />
x =<br />
put(loc, $loc20.)||repeat(" ",69)||"00"x;<br />
line " " ;<br />
line x $char91. ;<br />
endcomp ;<br />
compute be<strong>for</strong>e name ;<br />
x =<br />
put(name, $char17)||repeat(" ", 69)||"00"x ;<br />
line x $char91. ;<br />
endcomp ;<br />
run ;<br />
ods html close ;
C<strong>on</strong>clusi<strong>on</strong><br />
One should spend as much time analyzing the problem<br />
be<strong>for</strong>e coding as possible. One should plan the code <strong>for</strong><br />
flexibility, postp<strong>on</strong>ing decisi<strong>on</strong>s that can be delayed.<br />
Approximately half the code was need to fix the problems<br />
and produce the basic in<strong>for</strong>mati<strong>on</strong>. The remaining half<br />
was used to get a report in the precise <strong>for</strong>m required.<br />
Perhaps more time should have been spent investigating<br />
a TABULATE soluti<strong>on</strong>.<br />
The author may be c<strong>on</strong>tacted by mail at<br />
Ian Whitlock<br />
Westat<br />
1650 Research Boulevard<br />
Rockville, MD 20850<br />
or by e-mail<br />
whitloi1@westat.com<br />
Correcti<strong>on</strong>s<br />
The key <strong>for</strong>mat $LOC. was poorly executed. The<br />
locati<strong>on</strong> 22 was omitted and its name applied to 24.<br />
This had two disastrous c<strong>on</strong>sequences. Data <strong>for</strong><br />
locati<strong>on</strong> 22 were deleted and the report <strong>for</strong> locati<strong>on</strong><br />
24 was mislabeled.<br />
The sec<strong>on</strong>d biggest mistake due to a hasty reading<br />
of the problem specificati<strong>on</strong> was to take the<br />
maximum temperature <strong>for</strong> multiple readings instead<br />
of the maximum temperature at the maximum depth.<br />
One could questi<strong>on</strong> the basic INPUT statement <strong>on</strong><br />
the basis of the specs, however the data given<br />
support the INPUT statement. Of course, future<br />
data might not be readable and still be with in<br />
specificati<strong>on</strong>.<br />
No attempt was made to make the program<br />
parameter driven. On the other hand, any of the<br />
most probable changes covered by parameters are<br />
easily made and parameterizati<strong>on</strong> would not be<br />
difficult.<br />
SAS is a registered trademark or trademark of SAS<br />
<strong>Institute</strong> Inc. in the USA and other countries. ®<br />
indicates USA registrati<strong>on</strong>.
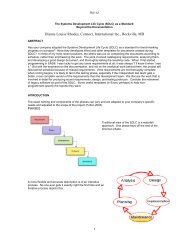
Report Dripp-Drye Water Temperatures in West Florida Week of 21Nov1999 1<br />
20:03 Friday, July 21, 2000<br />
Locati<strong>on</strong> Sun M<strong>on</strong> Tue Wed Thr Fri Sat<br />
Name (n=51) (n=43) (n=53) (n=49) (n=48) (n=40) (n=53)<br />
00-Pensacola<br />
Bob Beard<br />
N(%) 1(1.9%) 1(2.1%)<br />
Mean 24.4 21.1<br />
Min 24.4 21.1<br />
Max 24.4 21.1<br />
Seymour Fish<br />
N(%) 2(4.7%) 1(1.9%) 1(2.1%) 1(2.5%)<br />
Mean 22.3 23.4 22.6 23.9<br />
Min 20.3 23.4 22.6 23.9<br />
Max 24.3 23.4 22.6 23.9<br />
Cap'n Morgan<br />
N(%)<br />
Mean<br />
Min<br />
Max<br />
Rip Tide<br />
N(%) 1(2.3%)<br />
Mean 20.2<br />
Min 20.2<br />
Max 20.2<br />
Frank Wahiini<br />
N(%) 1(2.3%) 2(3.8%)<br />
Mean 22.7 21.3<br />
Min 22.7 21.1<br />
Max 22.7 21.5<br />
Jock Whostow<br />
N(%) 2(3.9%) 1(1.9%)<br />
Mean 21.7 20.6<br />
Min 21.5 20.6<br />
Max 22.0 20.6