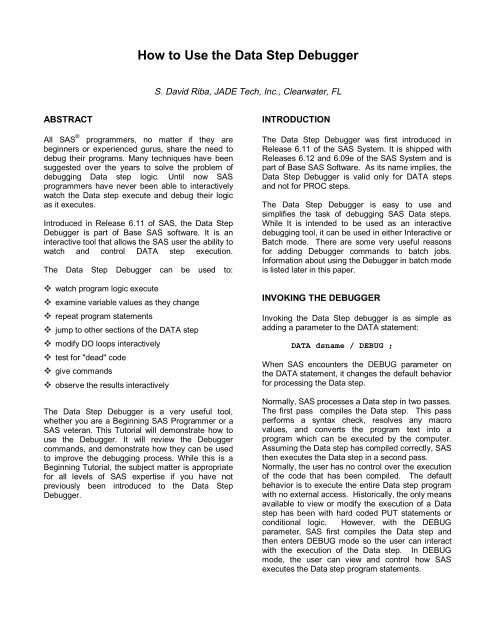
How to Use the Data Step Debugger - Institute for Advanced Analytics
How to Use the Data Step Debugger - Institute for Advanced Analytics
How to Use the Data Step Debugger - Institute for Advanced Analytics
You also want an ePaper? Increase the reach of your titles
YUMPU automatically turns print PDFs into web optimized ePapers that Google loves.
ABSTRACT<br />
All SAS ® programmers, no matter if <strong>the</strong>y are<br />
beginners or experienced gurus, share <strong>the</strong> need <strong>to</strong><br />
debug <strong>the</strong>ir programs. Many techniques have been<br />
suggested over <strong>the</strong> years <strong>to</strong> solve <strong>the</strong> problem of<br />
debugging <strong>Data</strong> step logic. Until now SAS<br />
programmers have never been able <strong>to</strong> interactively<br />
watch <strong>the</strong> <strong>Data</strong> step execute and debug <strong>the</strong>ir logic<br />
as it executes.<br />
Introduced in Release 6.11 of SAS, <strong>the</strong> <strong>Data</strong> <strong>Step</strong><br />
<strong>Debugger</strong> is part of Base SAS software. It is an<br />
interactive <strong>to</strong>ol that allows <strong>the</strong> SAS user <strong>the</strong> ability <strong>to</strong><br />
watch and control DATA step execution.<br />
The <strong>Data</strong> <strong>Step</strong> <strong>Debugger</strong> can be used <strong>to</strong>:<br />
watch program logic execute<br />
examine variable values as <strong>the</strong>y change<br />
repeat program statements<br />
jump <strong>to</strong> o<strong>the</strong>r sections of <strong>the</strong> DATA step<br />
modify DO loops interactively<br />
test <strong>for</strong> "dead" code<br />
give commands<br />
observe <strong>the</strong> results interactively<br />
<strong>How</strong> <strong>to</strong> <strong>Use</strong> <strong>the</strong> <strong>Data</strong> <strong>Step</strong> <strong>Debugger</strong><br />
The <strong>Data</strong> <strong>Step</strong> <strong>Debugger</strong> is a very useful <strong>to</strong>ol,<br />
whe<strong>the</strong>r you are a Beginning SAS Programmer or a<br />
SAS veteran. This Tu<strong>to</strong>rial will demonstrate how <strong>to</strong><br />
use <strong>the</strong> <strong>Debugger</strong>. It will review <strong>the</strong> <strong>Debugger</strong><br />
commands, and demonstrate how <strong>the</strong>y can be used<br />
<strong>to</strong> improve <strong>the</strong> debugging process. While this is a<br />
Beginning Tu<strong>to</strong>rial, <strong>the</strong> subject matter is appropriate<br />
<strong>for</strong> all levels of SAS expertise if you have not<br />
previously been introduced <strong>to</strong> <strong>the</strong> <strong>Data</strong> <strong>Step</strong><br />
<strong>Debugger</strong>.<br />
S. David Riba, JADE Tech, Inc., Clearwater, FL<br />
INTRODUCTION<br />
The <strong>Data</strong> <strong>Step</strong> <strong>Debugger</strong> was first introduced in<br />
Release 6.11 of <strong>the</strong> SAS System. It is shipped with<br />
Releases 6.12 and 6.09e of <strong>the</strong> SAS System and is<br />
part of Base SAS Software. As its name implies, <strong>the</strong><br />
<strong>Data</strong> <strong>Step</strong> <strong>Debugger</strong> is valid only <strong>for</strong> DATA steps<br />
and not <strong>for</strong> PROC steps.<br />
The <strong>Data</strong> <strong>Step</strong> <strong>Debugger</strong> is easy <strong>to</strong> use and<br />
simplifies <strong>the</strong> task of debugging SAS <strong>Data</strong> steps.<br />
While It is intended <strong>to</strong> be used as an interactive<br />
debugging <strong>to</strong>ol, it can be used in ei<strong>the</strong>r Interactive or<br />
Batch mode. There are some very useful reasons<br />
<strong>for</strong> adding <strong>Debugger</strong> commands <strong>to</strong> batch jobs.<br />
In<strong>for</strong>mation about using <strong>the</strong> <strong>Debugger</strong> in batch mode<br />
is listed later in this paper.<br />
INVOKING THE DEBUGGER<br />
Invoking <strong>the</strong> <strong>Data</strong> <strong>Step</strong> debugger is as simple as<br />
adding a parameter <strong>to</strong> <strong>the</strong> DATA statement:<br />
DATA dsname / DEBUG ;<br />
When SAS encounters <strong>the</strong> DEBUG parameter on<br />
<strong>the</strong> DATA statement, it changes <strong>the</strong> default behavior<br />
<strong>for</strong> processing <strong>the</strong> <strong>Data</strong> step.<br />
Normally, SAS processes a <strong>Data</strong> step in two passes.<br />
The first pass compiles <strong>the</strong> <strong>Data</strong> step. This pass<br />
per<strong>for</strong>ms a syntax check, resolves any macro<br />
values, and converts <strong>the</strong> program text in<strong>to</strong> a<br />
program which can be executed by <strong>the</strong> computer.<br />
Assuming <strong>the</strong> <strong>Data</strong> step has compiled correctly, SAS<br />
<strong>the</strong>n executes <strong>the</strong> <strong>Data</strong> step in a second pass.<br />
Normally, <strong>the</strong> user has no control over <strong>the</strong> execution<br />
of <strong>the</strong> code that has been compiled. The default<br />
behavior is <strong>to</strong> execute <strong>the</strong> entire <strong>Data</strong> step program<br />
with no external access. His<strong>to</strong>rically, <strong>the</strong> only means<br />
available <strong>to</strong> view or modify <strong>the</strong> execution of a <strong>Data</strong><br />
step has been with hard coded PUT statements or<br />
conditional logic. <strong>How</strong>ever, with <strong>the</strong> DEBUG<br />
parameter, SAS first compiles <strong>the</strong> <strong>Data</strong> step and<br />
<strong>the</strong>n enters DEBUG mode so <strong>the</strong> user can interact<br />
with <strong>the</strong> execution of <strong>the</strong> <strong>Data</strong> step. In DEBUG<br />
mode, <strong>the</strong> user can view and control how SAS<br />
executes <strong>the</strong> <strong>Data</strong> step program statements.
DEBUGGER WINDOWS<br />
Once <strong>the</strong> <strong>Data</strong> <strong>Step</strong> <strong>Debugger</strong> has been invoked, an<br />
interactive environment is displayed. The <strong>Debugger</strong><br />
environment consists of two windows -- a SOURCE<br />
window and a LOG window.<br />
The SOURCE window displays <strong>the</strong> original <strong>Data</strong><br />
step source code. The currently executing line is<br />
highlighted in <strong>the</strong> SOURCE window.<br />
The LOG window is similar <strong>to</strong> <strong>the</strong> Log window in <strong>the</strong><br />
Program Edi<strong>to</strong>r, with one major exception. The<br />
<strong>Debugger</strong> LOG window contains an additional<br />
command line. This command line is <strong>for</strong> issuing<br />
commands <strong>to</strong> <strong>the</strong> <strong>Debugger</strong>.<br />
A typical <strong>Data</strong> <strong>Step</strong> <strong>Debugger</strong> session might look<br />
like this:<br />
The <strong>to</strong>p window is <strong>the</strong> <strong>Debugger</strong> Log window. The<br />
results from executing <strong>the</strong> <strong>Data</strong> step are displayed<br />
here. The <strong>Debugger</strong> command line can be found at<br />
<strong>the</strong> bot<strong>to</strong>m of <strong>the</strong> <strong>Debugger</strong> Log window. The<br />
<strong>Debugger</strong> command line follows <strong>the</strong> right arrow sign<br />
at <strong>the</strong> bot<strong>to</strong>m of <strong>the</strong> Log window > below <strong>the</strong> row of<br />
dashes.<br />
The bot<strong>to</strong>m window is <strong>the</strong> SOURCE window. Here,<br />
<strong>the</strong> <strong>Data</strong> step code is displayed, and <strong>the</strong> current line<br />
being executed is highlighted. The line numbers<br />
displayed in <strong>the</strong> <strong>Debugger</strong> Log window are <strong>the</strong> same<br />
as <strong>the</strong> line numbers displayed in <strong>the</strong> <strong>Debugger</strong><br />
Source window.<br />
The position and characteristics of each window can<br />
be cus<strong>to</strong>mized, <strong>the</strong> same as <strong>the</strong> SAS Display<br />
Manager windows. Once a window has been<br />
redefined, issue <strong>the</strong> WSAVE command <strong>to</strong><br />
permanently s<strong>to</strong>re those definitions.<br />
DEBUGGER EXPRESSIONS<br />
Since <strong>the</strong> <strong>Data</strong> <strong>Step</strong> <strong>Debugger</strong> is different from <strong>the</strong><br />
SAS Program Edi<strong>to</strong>r, it has different programming<br />
requirements than <strong>the</strong> Program Edi<strong>to</strong>r.<br />
The commands that are issued from <strong>the</strong> <strong>Debugger</strong><br />
command line must follow <strong>the</strong> following rules:<br />
There is a limited set of <strong>Debugger</strong> commands.<br />
Commands that are issued during a <strong>Debugger</strong><br />
session can include any valid SAS opera<strong>to</strong>r.<br />
SAS functions can not be used in a <strong>Debugger</strong><br />
command.<br />
All commands must fit on one line. With one<br />
exception (DO blocks), <strong>Debugger</strong> expressions<br />
can not be continued on ano<strong>the</strong>r line.<br />
<strong>Debugger</strong> commands can be assigned <strong>to</strong><br />
Function Keys. This saves considerable time,<br />
as well as lessening <strong>the</strong> opportunity <strong>for</strong> errors, if<br />
frequently used commands are assigned <strong>to</strong><br />
<strong>Debugger</strong> function keys.<br />
Macros can be issued from <strong>the</strong> <strong>Debugger</strong><br />
command line.<br />
The RECALL command will recall <strong>Debugger</strong><br />
commands from <strong>the</strong> command stack. By default, <strong>the</strong><br />
F4 key is assigned <strong>the</strong> value RECALL. Up <strong>to</strong> 20<br />
previous commands can be RECALLed from <strong>the</strong><br />
<strong>Debugger</strong> command stack.<br />
DEBUGGER COMMANDS<br />
There are several categories of commands that can<br />
be issued <strong>to</strong> <strong>the</strong> <strong>Data</strong> <strong>Step</strong> <strong>Debugger</strong>. These<br />
commands are issued on <strong>the</strong> <strong>Debugger</strong> Command<br />
Line, which is at <strong>the</strong> bot<strong>to</strong>m of <strong>the</strong> <strong>Debugger</strong> LOG<br />
window. These commands are also available from<br />
<strong>the</strong> <strong>Debugger</strong> PMenu.<br />
The <strong>Debugger</strong> commands can be grouped as<br />
follows:<br />
Control Program Execution<br />
Manipulate <strong>Data</strong> <strong>Step</strong> Variables<br />
Manipulate <strong>Debugger</strong> Requests<br />
Tailor <strong>the</strong> <strong>Debugger</strong><br />
Terminate <strong>the</strong> <strong>Debugger</strong><br />
Control <strong>the</strong> <strong>Debugger</strong> Windows<br />
Each of <strong>the</strong>se groups will be discussed in turn on <strong>the</strong><br />
following pages.
DEBUGGER COMMANDS TO CONTROL<br />
PROGRAM EXECUTION<br />
There are three commands that control <strong>the</strong> order of<br />
execution of a <strong>Data</strong> <strong>Step</strong>. These commands are:<br />
GO<br />
JUMP<br />
STEP<br />
GO<br />
Starts or resumes execution of <strong>the</strong> <strong>Data</strong> step. When<br />
a GO command is issued, execution continues until<br />
a BREAK point or WATCH variable changes, or until<br />
<strong>the</strong> <strong>Data</strong> step terminates. In addition, GO can be<br />
modified by a line number. Thus, GO 35 will<br />
continue <strong>to</strong> execute all program code until line 35,<br />
and <strong>the</strong>n will s<strong>to</strong>p and await <strong>the</strong> next debugger<br />
command.<br />
GO can be shortened <strong>to</strong> G.<br />
JUMP<br />
Changes <strong>the</strong> point <strong>to</strong> resume execution of <strong>the</strong> <strong>Data</strong><br />
step. JUMP requires a valid line number or label <strong>for</strong><br />
<strong>the</strong> next program statement <strong>to</strong> execute. With <strong>the</strong><br />
JUMP command, <strong>the</strong> normal order that a <strong>Data</strong> step<br />
is processed can be modified under user control.<br />
Sections of <strong>Data</strong> step code can be repeated, code<br />
can be skipped, conditional logic blocks can be<br />
entered or terminated, etc.<br />
For example, <strong>to</strong> move directly <strong>to</strong> <strong>the</strong> labeled section<br />
HEADER:<br />
JUMP header<br />
While it is possible <strong>to</strong> do so, it is unwise <strong>to</strong> JUMP<br />
in<strong>to</strong> <strong>the</strong> middle of a DO loop or in<strong>to</strong> a label that is <strong>the</strong><br />
target of a LINK - RETURN group. Directly JUMPing<br />
in<strong>to</strong> ei<strong>the</strong>r of <strong>the</strong>se program groups bypasses <strong>the</strong><br />
normal controls and unexpected results can occur.<br />
JUMP can be shortened <strong>to</strong> J.<br />
STEP<br />
Executes statements one at a time. STEP can take<br />
a numeric parameter, which will execute <strong>the</strong> next X<br />
statements (i.e. STEP 4 will execute <strong>the</strong> next four<br />
statements). By default, <strong>the</strong> ENTER key steps<br />
through <strong>the</strong> program sequentially, one line at a time.<br />
<strong>How</strong>ever, this can be modified with <strong>the</strong> ENTER<br />
command, which will be reviewed later in this paper.<br />
STEP can be shortened <strong>to</strong> ST<br />
DEBUGGER COMMANDS TO MANIPULATE<br />
DATA STEP VARIABLES<br />
There are four commands that allow <strong>the</strong> user <strong>to</strong><br />
examine and change <strong>the</strong> values of <strong>Data</strong> step<br />
variables. These commands are:<br />
CALCULATE<br />
DESCRIBE<br />
EXAMINE<br />
SET<br />
CALCULATE<br />
Evaluates debugger expressions and displays <strong>the</strong><br />
results. It is important <strong>to</strong> note that CALCULATE can<br />
not evaluate an expression that uses a function.<br />
<strong>How</strong>ever, calculate can be used with variable names<br />
and numeric values. The results of <strong>the</strong> calculation<br />
are displayed in <strong>the</strong> LOG window.<br />
CALCULATE var1 / var2 * 100<br />
CALCULATE can be shortened <strong>to</strong> CAL.<br />
DESCRIBE<br />
Displays <strong>the</strong> attributes of a variable. DESCRIBE<br />
takes as a parameter <strong>the</strong> name of a variable or<br />
_ALL_. DESCRIBE will display <strong>the</strong> Name, Type,<br />
Length, Label, In<strong>for</strong>mat, and Format <strong>for</strong> a variable. If<br />
an attribute is not currently defined <strong>for</strong> <strong>the</strong> variable, it<br />
is not displayed.<br />
The results are displayed in <strong>the</strong> LOG window.<br />
DESCRIBE _ALL_<br />
DESCRIBE can be shortened <strong>to</strong> DES or DESC.<br />
EXAMINE<br />
Displays <strong>the</strong> current value of a variable or list of<br />
variables. Like DESCRIBE, EXAMINE takes as a<br />
parameter <strong>the</strong> name of a variable or _ALL_.<br />
EXAMINE var1 var2 var3 ... varn<br />
In addition, <strong>the</strong> <strong>for</strong>mat used <strong>to</strong> display <strong>the</strong> variable<br />
value can be changed. EXAMINE can be modified<br />
with a valid <strong>for</strong>mat.<br />
For example, <strong>to</strong> examine a date variable which does<br />
not have a <strong>for</strong>mat assigned (or <strong>to</strong> change <strong>the</strong><br />
assigned <strong>for</strong>mat used <strong>for</strong> display purposes):<br />
EXAMINE dob mmddyy8.<br />
The results are displayed in <strong>the</strong> LOG window.<br />
EXAMINE can be shortened <strong>to</strong> E or EX.<br />
SET
Assigns new values <strong>to</strong> a variable. SET takes <strong>the</strong><br />
argument Variable = Expression. The variable <strong>to</strong> be<br />
changed can also be used as part of <strong>the</strong> expression.<br />
SET value = value + 1<br />
Unlike <strong>the</strong> default behavior exhibited during SAS<br />
program execution, <strong>the</strong> expression <strong>to</strong> be evaluated<br />
must be <strong>the</strong> same type as <strong>the</strong> variable <strong>to</strong> be<br />
assigned. Thus, if <strong>the</strong> variable is character, <strong>the</strong><br />
expression can not be numeric. There is no implied<br />
type conversion in <strong>the</strong> <strong>Debugger</strong>.<br />
SET immediately changes <strong>the</strong> value of <strong>the</strong> variable,<br />
but does not display any in<strong>for</strong>mation in <strong>the</strong> LOG<br />
window.<br />
SET can be shortened <strong>to</strong> SE.<br />
DEBUGGER COMMANDS TO MANIPULATE<br />
DEBUGGER REQUESTS<br />
There are five commands that allow <strong>the</strong> user <strong>to</strong><br />
manipulate <strong>the</strong> debugger. These commands are:<br />
BREAK<br />
DELETE<br />
LIST<br />
TRACE<br />
WATCH<br />
BREAK<br />
Sets Break Point <strong>to</strong> s<strong>to</strong>p execution at an executable<br />
statement. Multiple Break Points can be set in a<br />
<strong>Data</strong> step. Once a Break Point is set, <strong>the</strong> debugger<br />
will continue <strong>to</strong> execute program statements until <strong>the</strong><br />
Break condition is met. When <strong>the</strong> Break condition is<br />
met, <strong>the</strong> debugger will s<strong>to</strong>p executing at <strong>the</strong><br />
specified line and await fur<strong>the</strong>r commands.<br />
A more complete description of <strong>the</strong> BREAK<br />
command options follows this section.<br />
BREAK can be shortened <strong>to</strong> B.<br />
DELETE<br />
Deletes a Break Point or Watch variable. Individual<br />
Break Points, Watch variables, or all Break Points or<br />
Watch variables can be deleted.<br />
At a minimum DELETE takes one required<br />
parameter. Ei<strong>the</strong>r BREAK (or B) or WATCH (or W)<br />
must be specified after <strong>the</strong> DELETE command.<br />
Additional parameters, as appropriate, must <strong>the</strong>n be<br />
supplied. For example, _ALL_ will delete all<br />
currently defined Break Points or Watch variables:<br />
DELETE W _all_<br />
For Break Points, <strong>the</strong> same parameters that are<br />
used <strong>to</strong> define <strong>the</strong> Break Point can be supplied <strong>to</strong><br />
DELETE <strong>the</strong> Break Point. These are ei<strong>the</strong>r a line<br />
number, a statement label, or * <strong>for</strong> <strong>the</strong> current line.<br />
For Watch variables, <strong>the</strong> name(s) of <strong>the</strong> variables<br />
will delete <strong>the</strong> Watch on each named variable.<br />
DELETE can be shortened <strong>to</strong> D.<br />
LIST<br />
Displays a list of <strong>the</strong> requested items. LIST will<br />
display in<strong>for</strong>mation about <strong>the</strong> following six types of<br />
items, if <strong>the</strong>y are currently defined:<br />
BREAK (or B) current breakpoints<br />
WATCH (or W) current watch variables<br />
FILES (or F) current external files written<br />
INFILES (or I) current external files read<br />
DATASETS (or D) Input/Output datasets<br />
_ALL_ values of all of <strong>the</strong> above<br />
LIST requires one of <strong>the</strong> above arguments as a<br />
parameter.<br />
LIST _all_<br />
LIST can be shortened <strong>to</strong> L.<br />
TRACE<br />
Displays a record of program execution in <strong>the</strong> LOG<br />
window. The value of TRACE can be turned ON or<br />
OFF. By default, TRACE is set <strong>to</strong> OFF. With<br />
TRACE turned ON, <strong>the</strong> LOG window will contain a<br />
record of all actions taken during <strong>the</strong> debugging<br />
session. With no parameters, <strong>the</strong> TRACE command<br />
will display <strong>the</strong> current value (ON or OFF) of <strong>the</strong><br />
TRACE command.<br />
TRACE on<br />
TRACE can be shortened <strong>to</strong> T.<br />
WATCH<br />
Suspends execution when <strong>the</strong> value of a variable<br />
changes. Multiple variables can be defined with one<br />
WATCH command. When <strong>the</strong> value of a Watch<br />
variable changes, <strong>the</strong> log displays <strong>the</strong> old variable<br />
value, <strong>the</strong> new variable value, and <strong>the</strong> line number.<br />
Execution of <strong>the</strong> program <strong>the</strong>n s<strong>to</strong>ps and awaits<br />
fur<strong>the</strong>r commands.<br />
WATCH var1 var2 ... varn<br />
WATCH can be shortened <strong>to</strong> W.<br />
THE BREAK COMMAND
The BREAK command suspends execution of a<br />
<strong>Data</strong> step when a condition is met. The BREAK<br />
command can be shortened <strong>to</strong> B.<br />
The simplest <strong>for</strong>m of <strong>the</strong> BREAK command is:<br />
BREAK location<br />
where location can be ei<strong>the</strong>r a line number, a<br />
statement label, or * <strong>for</strong> <strong>the</strong> current line.<br />
Once a Breakpoint has been set, <strong>the</strong> SAS debugger<br />
will continue <strong>to</strong> execute program statements until <strong>the</strong><br />
line (or label) is about <strong>to</strong> be executed. At that point,<br />
execution will s<strong>to</strong>p and <strong>the</strong> debugger will wait <strong>for</strong> <strong>the</strong><br />
next command.<br />
In addition, <strong>the</strong> BREAK command can be modified<br />
by:<br />
AFTER count<br />
WHEN expression<br />
DO group<br />
These can also be combined <strong>for</strong> a compound<br />
BREAK command.<br />
AFTER count<br />
S<strong>to</strong>ps execution when <strong>the</strong> BREAK condition has<br />
been executed <strong>the</strong> number of times specified by<br />
COUNT. For example:<br />
BREAK * AFTER 5<br />
Will s<strong>to</strong>p at <strong>the</strong> current line on <strong>the</strong> sixth pass.<br />
WHEN expression<br />
S<strong>to</strong>ps execution when <strong>the</strong> WHEN expression<br />
evaluates as TRUE. If both AFTER and WHEN are<br />
specified, AFTER is evaluated first. The WHEN<br />
expression is evaluated only if <strong>the</strong> AFTER count<br />
condition is satisfied. Like <strong>the</strong> CALCULATE<br />
command, <strong>the</strong> WHEN expression can not contain<br />
SAS functions.<br />
BREAK * WHEN (var = expression)<br />
DO group<br />
Like <strong>the</strong> DO statement in Base SAS, DO group<br />
processing allows multiple debugger commands <strong>to</strong><br />
be executed. An END statement is required <strong>to</strong><br />
terminate <strong>the</strong> sequence of commands <strong>to</strong> be<br />
executed. Unlike <strong>the</strong> o<strong>the</strong>r debugger commands,<br />
however, DO groups can span multiple command<br />
lines.<br />
The simplest <strong>for</strong>m of <strong>the</strong> DO group is :<br />
BREAK * DO; command; command; END;<br />
Multiple debugger commands can be specified<br />
between <strong>the</strong> DO and END statements. When <strong>the</strong><br />
debugger encounters this syntax, <strong>the</strong> <strong>Data</strong> step will<br />
continue <strong>to</strong> execute until <strong>the</strong> BREAK condition is<br />
met. When <strong>the</strong> debugger suspends execution at <strong>the</strong><br />
Break Point, <strong>the</strong> commands between <strong>the</strong> DO and<br />
END statements will be acted upon.<br />
Multiple commands on <strong>the</strong> same line must be<br />
separated by semicolons. Commands can span<br />
multiple lines. In addition, DO groups can include IF<br />
- THEN and IF - THEN - ELSE conditional logic.<br />
Thus, <strong>the</strong> BREAK command can be used <strong>to</strong><br />
conditionally execute o<strong>the</strong>r commands as follows:<br />
BREAK * DO ;<br />
IF (condition-is-true) THEN command ;<br />
ELSE IF (condition-is-true) THEN DO;<br />
command ;<br />
command ;<br />
END ;<br />
ELSE command ;<br />
END ;<br />
Note <strong>the</strong> use of semicolons. Without a semicolon <strong>to</strong><br />
terminate each command, <strong>the</strong> debugger would<br />
immediately act on <strong>the</strong> command ra<strong>the</strong>r than waiting<br />
on <strong>the</strong> BREAK condition. The above would be<br />
evaluated and acted upon when <strong>the</strong> BREAK<br />
condition is satisfied. At that point in <strong>the</strong> processing,<br />
<strong>the</strong> debugger would act on <strong>the</strong> conditional<br />
commands, and <strong>the</strong>n wait <strong>for</strong> fur<strong>the</strong>r commands<br />
(unless one of <strong>the</strong> commands was GO).<br />
All of <strong>the</strong> BREAK command options can be<br />
combined as appropriate. In addition, regularly used<br />
BREAK commands can be assigned <strong>to</strong> function keys<br />
<strong>to</strong> minimize typing during a debugger session.<br />
DEBUGGER COMMANDS TO TAILOR AND<br />
TERMINATE THE DEBUGGER<br />
There are two commands that allow <strong>the</strong> user <strong>to</strong> tailor<br />
and terminate <strong>the</strong> <strong>Data</strong> <strong>Step</strong> <strong>Debugger</strong>. These<br />
commands are:<br />
ENTER<br />
QUIT<br />
ENTER<br />
Assigns one or more <strong>Debugger</strong> commands <strong>to</strong> <strong>the</strong><br />
ENTER key. By default, <strong>the</strong> ENTER key is<br />
programmed <strong>to</strong> execute <strong>the</strong> command STEP 1.
<strong>How</strong>ever, <strong>the</strong> ENTER key can be reprogrammed <strong>to</strong><br />
any valid combination of debugger commands.<br />
For example, if breakpoints and watch variables are<br />
set, it might be useful <strong>to</strong> continue execution until <strong>the</strong><br />
program s<strong>to</strong>ps at a breakpoint or watch variable and<br />
<strong>the</strong>n examine <strong>the</strong> values of all variables. To do this,<br />
<strong>the</strong> ENTER key can be reprogrammed <strong>to</strong>:<br />
ENTER g ; e _all_<br />
QUIT<br />
Terminates <strong>the</strong> <strong>Debugger</strong>. The currently open<br />
<strong>Data</strong>set(s) is closed, any open files are closed, and<br />
<strong>the</strong> <strong>Debugger</strong> terminates.<br />
It is important <strong>to</strong> note that when <strong>the</strong> <strong>Data</strong> step<br />
completes execution, <strong>the</strong> <strong>Debugger</strong> environment<br />
does not au<strong>to</strong>matically close. In order <strong>to</strong> exit <strong>the</strong><br />
<strong>Debugger</strong>, <strong>the</strong> QUIT command must be issued.<br />
QUIT can be shortened <strong>to</strong> Q.<br />
COMMANDS TO CONTROL DEBUGGER<br />
WINDOWS<br />
There are two global commands that can be issued.<br />
Both of <strong>the</strong>se commands are not <strong>Debugger</strong><br />
commands, but must be entered from <strong>the</strong> Command<br />
Line, Command Bar, Pmenu, or <strong>the</strong> appropriate<br />
Function Key. These commands are:<br />
SWAP<br />
HELP<br />
SWAP<br />
Changes <strong>the</strong> active window. The SWAP command<br />
<strong>to</strong>ggles between <strong>the</strong> <strong>Debugger</strong> SOURCE and <strong>the</strong><br />
LOG windows.<br />
By default, Shift F3 is defined as SWAP.<br />
HELP<br />
Opens <strong>the</strong> <strong>Debugger</strong> command help window. All of<br />
<strong>the</strong> current SAS documentation on <strong>the</strong> <strong>Data</strong> <strong>Step</strong><br />
<strong>Debugger</strong> is contained in <strong>the</strong> HELP file.<br />
By default, F1 opens <strong>Debugger</strong> Help.<br />
DEBUGGING DATA STEPS CREATED BY A<br />
MACRO<br />
SAS default behavior in resolving Macro code<br />
creates a problem when using <strong>the</strong> <strong>Data</strong> <strong>Step</strong><br />
<strong>Debugger</strong>. The <strong>Debugger</strong> source window displays<br />
<strong>the</strong> original source code that is being stepped<br />
through during <strong>the</strong> debug session. <strong>How</strong>ever, since a<br />
Macro is resolved at compile time and <strong>the</strong> source<br />
code is modified prior <strong>to</strong> execution, <strong>the</strong> original<br />
source code being executed is not available <strong>to</strong> <strong>the</strong><br />
<strong>Debugger</strong> <strong>to</strong> display. In this case, <strong>the</strong> <strong>Debugger</strong> will<br />
still step through <strong>the</strong> <strong>Data</strong> step program code.<br />
<strong>How</strong>ever <strong>the</strong> SOURCE window is blank, since <strong>the</strong>re<br />
is no valid source code <strong>to</strong> display.<br />
To resolve this problem, SAS recommends a three<br />
step approach. SAS recommends that <strong>the</strong> Macro<br />
code be executed, <strong>the</strong> resolved data step code be<br />
saved, and <strong>the</strong> resolved code rerun with <strong>the</strong><br />
<strong>Debugger</strong> turned on.<br />
The specific steps are as follows:<br />
Enable <strong>the</strong> System option MPRINT<br />
Invoke <strong>the</strong> Macro<br />
Route statements in <strong>the</strong> SAS log displayed by<br />
MPRINT <strong>to</strong> a file<br />
Edit <strong>the</strong> file <strong>to</strong> remove line headers and extra<br />
text like notes and warnings<br />
Add <strong>the</strong> DEBUG option <strong>to</strong> <strong>the</strong> DATA statement<br />
Rerun in <strong>Debugger</strong><br />
There is a new system option that was introduced in<br />
Version 7 of <strong>the</strong> SAS System. The MFILE option<br />
routes macro MPRINT output <strong>to</strong> an external file.<br />
Using MFILE, <strong>the</strong> above steps would change<br />
slightly:<br />
Enable <strong>the</strong> System option MPRINT<br />
Enable <strong>the</strong> System option MFILE<br />
Define a fileref named MPRINT pointing <strong>to</strong> an<br />
existing external file<br />
Invoke <strong>the</strong> Macro<br />
Edit <strong>the</strong> file <strong>to</strong> remove line headers and extra<br />
text like notes and warnings<br />
Add <strong>the</strong> DEBUG option <strong>to</strong> <strong>the</strong> DATA statement<br />
Rerun in <strong>Debugger</strong><br />
Note that <strong>the</strong> MFILE option appends output <strong>to</strong> <strong>the</strong><br />
external file defined in a fileref named MPRINT. The<br />
external file must exist or MPRINT will fail.
DATA STEP DEBUGGER MACROS<br />
It is possible <strong>to</strong> define Macros which contain multiple<br />
debugger commands <strong>for</strong> use during a <strong>Debugger</strong><br />
session. Once defined, <strong>Debugger</strong> macros are<br />
s<strong>to</strong>red in <strong>the</strong> Macro library <strong>for</strong> <strong>the</strong> duration of <strong>the</strong><br />
SAS session.<br />
<strong>Debugger</strong> macros can also contain replaceable<br />
parameters. Thus, a single debugger macro can be<br />
defined with user definable parameters in a similar<br />
manner <strong>to</strong> <strong>the</strong> SAS macro facility.<br />
<strong>Debugger</strong> macros can be defined with <strong>the</strong> following<br />
syntax:<br />
%MACRO name; command(s); %MEND name;<br />
The Macro name can be any valid SAS name.<br />
Multiple commands are separated by semicolons.<br />
All commands must be entered on <strong>the</strong> same line.<br />
In addition <strong>to</strong> macros defined in <strong>the</strong> <strong>Debugger</strong>, <strong>the</strong><br />
<strong>Debugger</strong> recognizes macros defined from <strong>the</strong><br />
Program Edi<strong>to</strong>r. While <strong>the</strong>se macros must contain<br />
valid <strong>Debugger</strong> commands, <strong>the</strong> commands do not<br />
have <strong>to</strong> be typed on a single line. The <strong>Data</strong> <strong>Step</strong><br />
<strong>Debugger</strong> treats all macros <strong>the</strong> same, regardless if<br />
<strong>the</strong>y were defined in <strong>the</strong> Program Edi<strong>to</strong>r or during a<br />
debugging session.<br />
To invoke a macro in <strong>the</strong> <strong>Debugger</strong>, type <strong>the</strong> macro<br />
name from <strong>the</strong> <strong>Debugger</strong> command line.<br />
%macroname<br />
USING THE DISPLAY MANAGER TO<br />
ASSIGN DEBUGGER COMMANDS TO<br />
FUNCTION KEYS<br />
The <strong>Data</strong> <strong>Step</strong> <strong>Debugger</strong> uses a separate set of<br />
Function Key definitions. In addition <strong>to</strong> <strong>the</strong> Display<br />
Manager Key definitions s<strong>to</strong>red in <strong>the</strong> user’s profile,<br />
<strong>the</strong> <strong>Data</strong> <strong>Step</strong> <strong>Debugger</strong> s<strong>to</strong>res Function Key<br />
definitions in a keys entry named DSDKEYS. Like<br />
Display Manager key definitions, <strong>the</strong> <strong>Debugger</strong> key<br />
definitions can be cus<strong>to</strong>mized.<br />
To assign <strong>Debugger</strong> commands <strong>to</strong> a Function Key,<br />
prefix <strong>the</strong> command with DSD. Each command in a<br />
multiple command string must be separated by a<br />
semicolon.<br />
For example, <strong>to</strong> define a function <strong>to</strong> Examine <strong>the</strong><br />
values of all variables and <strong>the</strong>n STep <strong>to</strong> <strong>the</strong> next<br />
program statement, a Function Key can be defined<br />
as:<br />
dsd e _all_; dsd st<br />
Since <strong>the</strong> Function Key definitions are s<strong>to</strong>red in <strong>the</strong><br />
user’s Profile, <strong>the</strong>se definitions will remain in effect<br />
until <strong>the</strong>y are changed.<br />
USING THE INTERACTIVE DEBUGGER IN<br />
BATCH MODE<br />
Yes. The interactive <strong>Data</strong> <strong>Step</strong> <strong>Debugger</strong> can be<br />
used in batch mode. While <strong>the</strong> <strong>Debugger</strong> is<br />
intended as an interactive <strong>to</strong>ol, it can be useful when<br />
running batch SAS jobs. Any <strong>Debugger</strong> command<br />
can be used, plus <strong>the</strong>re is an undocumented<br />
command that is only valid in batch mode.<br />
To run <strong>the</strong> <strong>Debugger</strong> in batch mode, <strong>the</strong> parameter<br />
on <strong>the</strong> DATA statement is slightly different. Instead<br />
of / DEBUG <strong>to</strong> invoke <strong>the</strong> <strong>Debugger</strong>, <strong>for</strong> batch mode<br />
use / LDEBUG.<br />
DATA dsname / LDEBUG ;<br />
This will invoke <strong>the</strong> <strong>Debugger</strong>, but will not open <strong>the</strong><br />
interactive SOURCE and LOG windows.<br />
When running in batch mode, <strong>the</strong> <strong>Debugger</strong><br />
commands are entered AFTER <strong>the</strong> RUN statement<br />
at <strong>the</strong> end of <strong>the</strong> DATA step. Each command that<br />
would be typed in interactively, must be listed. It is<br />
very important <strong>to</strong> terminate <strong>the</strong> <strong>Debugger</strong> with a<br />
QUIT command. In addition, <strong>the</strong> <strong>Debugger</strong> in batch<br />
mode can not be used with a CARDS statement or a<br />
%INCLUDE statement.<br />
Below is a sample of <strong>the</strong> <strong>Debugger</strong> commands <strong>for</strong> a<br />
batch job:<br />
DATA CHECKIN / LDEBUG;<br />
SET HOSPITAL;<br />
STAY=ENDDT-STRTDT;<br />
RUN;<br />
GO;<br />
WATCH ENDDT;<br />
EX ENDDT MMDDYY10. STRTDT MMDDYY10.;<br />
GO;<br />
QUIT;<br />
Each <strong>Debugger</strong> command is listed after <strong>the</strong> RUN<br />
statement which marks <strong>the</strong> DATA step boundary.<br />
The <strong>Debugger</strong> is terminated with <strong>the</strong> QUIT<br />
command. Between <strong>the</strong>m are <strong>the</strong> commands that<br />
would have been entered interactively from <strong>the</strong><br />
<strong>Debugger</strong> command line.<br />
There is one additional undocumented command<br />
which is only available <strong>to</strong> <strong>the</strong> <strong>Debugger</strong> in batch<br />
mode.
PRINT<br />
The PRINT command takes as an argument <strong>the</strong> line<br />
number or range of line numbers from <strong>the</strong> SOURCE<br />
window. It <strong>the</strong>n prints those line numbers <strong>to</strong> <strong>the</strong><br />
Log.<br />
WHY USE THE INTERACTIVE DEBUGGER IN<br />
BATCH MODE?<br />
An unintended side effect of <strong>the</strong> ability <strong>to</strong> use <strong>the</strong><br />
<strong>Data</strong> <strong>Step</strong> <strong>Debugger</strong> in batch mode is its high<br />
degree of usefulness <strong>for</strong> Source Code Control and<br />
Source Code Maintenance issues.<br />
The traditional method of debugging SAS programs<br />
has relied on PUT statements and o<strong>the</strong>r external<br />
means of tracking <strong>the</strong> progress of <strong>Data</strong> step<br />
execution. Typically, when a SAS job is debugged<br />
and placed in<strong>to</strong> production <strong>the</strong>se extra statements<br />
are removed. The job <strong>the</strong>n needs <strong>to</strong> be tested <strong>to</strong><br />
verify that nothing was “broken” in <strong>the</strong> process of<br />
removing <strong>the</strong>se extra statements. Future<br />
modifications <strong>to</strong> production jobs require <strong>the</strong> same<br />
process, and have <strong>the</strong> potential <strong>for</strong> unintended<br />
consequences when something changes that was<br />
not planned.<br />
Using <strong>the</strong> <strong>Data</strong> <strong>Step</strong> <strong>Debugger</strong>, no code is changed.<br />
In fact, all interactions occur outside of <strong>the</strong> <strong>Data</strong><br />
step, so maintenance and source code control are<br />
unaffected. For testing purposes, using <strong>the</strong> batch<br />
mode of <strong>the</strong> <strong>Debugger</strong> might be an ideal solution.<br />
All <strong>Debugger</strong> commands can be entered after <strong>the</strong><br />
<strong>Data</strong> step, and each debugging session will be<br />
consistent with prior sessions.<br />
INVOKING DEBUGGER CODE IN BATCH<br />
MODE<br />
One additional recommendation and <strong>the</strong> <strong>Data</strong> <strong>Step</strong><br />
<strong>Debugger</strong> becomes <strong>the</strong> ideal debugging situation<br />
when source code control is an issue. Replacing <strong>the</strong><br />
/ DEBUG parameter with a macro value allows <strong>the</strong><br />
source code <strong>to</strong> be unchanged between test and<br />
production versions, yet allows <strong>to</strong>tal debugging<br />
flexibility.<br />
For example:<br />
%LET dmode = / LDEBUG ;<br />
DATA dsname &dmode ;<br />
To turn off DEBUG mode, change <strong>the</strong> macro value<br />
<strong>to</strong>:<br />
%LET dmode = ;<br />
Finally, establish a macro flag <strong>to</strong> determine if <strong>the</strong><br />
program should be debugged:<br />
%LET debug = Y ;<br />
Using <strong>the</strong> previous example, <strong>the</strong> completed code<br />
would now look like this:<br />
%LET debug = Y ;<br />
%LET dmode = ;<br />
%MACRO do_debug ;<br />
%IF &debug = Y %THEN<br />
%LET dmode = / LDEBUG ;<br />
%MEND do_debug ;<br />
%do_debug ;<br />
DATA CHECKIN &dmode;<br />
SET HOSPITAL;<br />
STAY=ENDDT-STRTDT;<br />
RUN;<br />
GO;<br />
WATCH ENDDT;<br />
EX ENDDT MMDDYY10. STRTDT MMDDYY10.;<br />
GO;<br />
QUIT;<br />
Thus, no source code needs <strong>to</strong> be changed in order<br />
<strong>to</strong> take advantage of <strong>the</strong> <strong>Data</strong> <strong>Step</strong> <strong>Debugger</strong><br />
whe<strong>the</strong>r it is interactive or batch mode. The only<br />
final step necessary be<strong>for</strong>e production is <strong>to</strong> remove<br />
<strong>the</strong> <strong>Debugger</strong> statements which are OUTSIDE of <strong>the</strong><br />
production SAS code.<br />
CONCLUSION<br />
The <strong>Data</strong> <strong>Step</strong> <strong>Debugger</strong> is a useful <strong>to</strong>ol <strong>for</strong> all SAS<br />
users, from <strong>the</strong> beginner <strong>to</strong> <strong>the</strong> advanced guru. It is<br />
an easy <strong>to</strong> user, interactive environment that allows<br />
<strong>to</strong>tal control of <strong>the</strong> execution stage of <strong>Data</strong> step<br />
processing. As this paper demonstrated, <strong>the</strong><br />
<strong>Debugger</strong> can also be very useful in non-interactive<br />
batch mode. The <strong>Data</strong> <strong>Step</strong> <strong>Debugger</strong> has been<br />
part of Base SAS software since Release 6.11. This<br />
paper has reviewed <strong>the</strong> use of <strong>the</strong> <strong>Debugger</strong> and <strong>the</strong><br />
<strong>Debugger</strong> command set.<br />
REFERENCES<br />
SAS <strong>Institute</strong>, Inc., SAS ® Online Doc, Version 7-1<br />
Cary, NC. SAS <strong>Institute</strong> Inc., 1999.<br />
AUTHOR<br />
The author may be contacted at:<br />
S. David Riba<br />
JADE Tech, Inc.
P O Box 4517<br />
Clearwater, FL 33758<br />
(727) 726-6099<br />
INTERNET: dave@JADETEK.COM<br />
This paper is available <strong>for</strong> download from <strong>the</strong><br />
author’s Web site:<br />
HTTP://WWW.JADETEK.COM/JADETECH.HTM<br />
ACKNOWLEDGMENTS<br />
The author would like <strong>to</strong> gratefully acknowledge <strong>the</strong><br />
assistance of Sharon Hamrick of SAS <strong>Institute</strong><br />
Technical Support in reviewing this paper.<br />
TRADEMARK INFORMATION<br />
SAS is a registered trademark of SAS <strong>Institute</strong> Inc. in <strong>the</strong><br />
USA and o<strong>the</strong>r countries. ® indicates USA registration.<br />
AUTHOR BIO<br />
S. David Riba is CEO of JADE Tech, Inc., a SAS<br />
<strong>Institute</strong> Quality Partner who specializes entirely in<br />
applications development, consulting and training in<br />
<strong>the</strong> SAS System. Dave has presented papers and<br />
assisted in various capacities at SUGI, SESUG,<br />
NESUG, MWSUG, SCSUG, and PharmaSUG.<br />
Dave is an unrepentent SAS bigot. His major areas<br />
of interest are efficient programming techniques and<br />
applications development using <strong>the</strong> SAS System.<br />
His SAS software product specialties are SAS/AF<br />
and FRAME technology, SAS/EIS, SAS/IntrNet,<br />
AppDev Studio, and CFO/Vision. Dave is a SAS<br />
Certified Professional.<br />
Dave is <strong>the</strong> founder and President of <strong>the</strong> Florida Gulf<br />
Coast SAS <strong>Use</strong>rs Group. He chartered and served<br />
as Co-Chair of <strong>the</strong> first SouthEast SAS <strong>Use</strong>rs Group<br />
conference, SESUG '93, and serves as President of<br />
<strong>the</strong> Executive Council of <strong>the</strong> SouthEast SAS <strong>Use</strong>rs<br />
Group. He also serves on <strong>the</strong> Executive Council of<br />
CONSUG, <strong>the</strong> Consultant's SAS <strong>Use</strong>rs Group. His<br />
first SUGI was in 1983, and he has been actively<br />
involved in both SUGI and <strong>the</strong> Regional SAS <strong>Use</strong>r<br />
Group community since <strong>the</strong>n.<br />
Dave is currently <strong>the</strong> Co-Chair of SSU 2001, <strong>the</strong><br />
combined SouthEast and SouthCentral SAS <strong>Use</strong>rs<br />
Group conference <strong>to</strong> be held in New Orleans in<br />
August, 2001.


