12-02-Cahier-R- ... e-Chevallier-Gastineau.pdf - Base ...
12-02-Cahier-R- ... e-Chevallier-Gastineau.pdf - Base ...
12-02-Cahier-R- ... e-Chevallier-Gastineau.pdf - Base ...

Create successful ePaper yourself
Turn your PDF publications into a flip-book with our unique Google optimized e-Paper software.
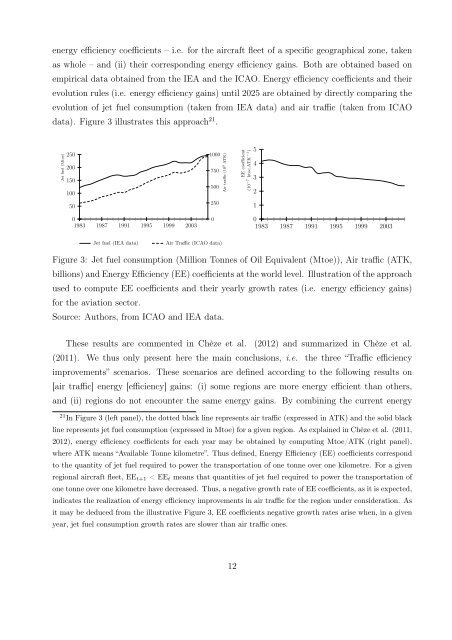
energy efficiency coefficients – i.e. for the aircraft fleet of a specific geographical zone, taken<br />
as whole – and (ii) their corresponding energy efficiency gains. Both are obtained based on<br />
empirical data obtained from the IEA and the ICAO. Energy efficiency coefficients and their<br />
evolution rules (i.e. energy efficiency gains) until 2<strong>02</strong>5 are obtained by directly comparing the<br />
evolution of jet fuel consumption (taken from IEA data) and air traffic (taken from ICAO<br />
data). Figure 3 illustrates this approach 21 .<br />
Jet fuel (Mtoe)<br />
250<br />
200<br />
150<br />
100<br />
50<br />
0<br />
1983 1987 1991 1995 1999 2003<br />
1000<br />
750<br />
500<br />
250<br />
Jet fuel (IEA data) Air Traffic (ICAO data)<br />
0<br />
Air traffic (10 9 ATK)<br />
EE coefficient<br />
(10 −7 ktoe.ATK −1 )<br />
5<br />
4<br />
3<br />
2<br />
1<br />
0<br />
1983 1987 1991 1995 1999 2003<br />
Figure 3: Jet fuel consumption (Million Tonnes of Oil Equivalent (Mtoe)), Air traffic (ATK,<br />
billions) and Energy Efficiency (EE) coefficients at the world level. Illustration of the approach<br />
used to compute EE coefficients and their yearly growth rates (i.e. energy efficiency gains)<br />
for the aviation sector.<br />
Source: Authors, from ICAO and IEA data.<br />
These results are commented in Chèze et al. (20<strong>12</strong>) and summarized in Chèze et al.<br />
(2011). We thus only present here the main conclusions, i.e. the three “Traffic efficiency<br />
improvements” scenarios. These scenarios are defined according to the following results on<br />
[air traffic] energy [efficiency] gains: (i) some regions are more energy efficient than others,<br />
and (ii) regions do not encounter the same energy gains. By combining the current energy<br />
21 In Figure 3 (left panel), the dotted black line represents air traffic (expressed in ATK) and the solid black<br />
line represents jet fuel consumption (expressed in Mtoe) for a given region. As explained in Chèze et al. (2011,<br />
20<strong>12</strong>), energy efficiency coefficients for each year may be obtained by computing Mtoe/ATK (right panel),<br />
where ATK means “Available Tonne kilometre”. Thus defined, Energy Efficiency (EE) coefficients correspond<br />
to the quantity of jet fuel required to power the transportation of one tonne over one kilometre. For a given<br />
regional aircraft fleet, EEt+1 < EEt means that quantities of jet fuel required to power the transportation of<br />
one tonne over one kilometre have decreased. Thus, a negative growth rate of EE coefficients, as it is expected,<br />
indicates the realization of energy efficiency improvements in air traffic for the region under consideration. As<br />
it may be deduced from the illustrative Figure 3, EE coefficients negative growth rates arise when, in a given<br />
year, jet fuel consumption growth rates are slower than air traffic ones.<br />
<strong>12</strong>