12-02-Cahier-R- ... e-Chevallier-Gastineau.pdf - Base ...
12-02-Cahier-R- ... e-Chevallier-Gastineau.pdf - Base ...
12-02-Cahier-R- ... e-Chevallier-Gastineau.pdf - Base ...

Create successful ePaper yourself
Turn your PDF publications into a flip-book with our unique Google optimized e-Paper software.
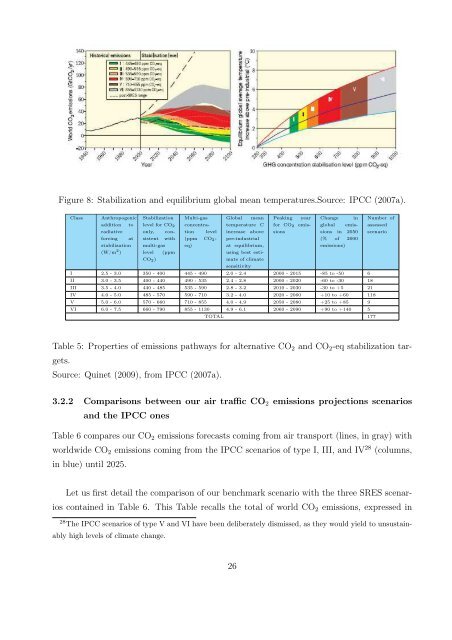
Figure 8: Stabilization and equilibrium global mean temperatures.Source: IPCC (2007a).<br />
Class Anthropogenic<br />
addition to<br />
radiative<br />
forcing at<br />
stabilization<br />
(W/m 2 )<br />
Stabilization<br />
level for CO2<br />
only, con-<br />
sistent with<br />
multi-gas<br />
level (ppm<br />
CO2)<br />
Multi-gas<br />
concentra-<br />
tion level<br />
(ppm CO2-<br />
eq)<br />
Global mean<br />
temperature C<br />
increase above<br />
pre-industrial<br />
at equilibrium,<br />
using best esti-<br />
mate of climate<br />
sensitivity<br />
Peaking year<br />
for CO2 emis-<br />
sions<br />
Change in<br />
global emis-<br />
sions in 2050<br />
(% of 2000<br />
emissions)<br />
I 2.5 - 3.0 350 - 400 445 - 490 2.0 - 2.4 2000 - 2015 -85 to -50 6<br />
II 3.0 - 3.5 400 - 440 490 - 535 2.4 - 2.8 2000 - 2<strong>02</strong>0 -60 to -30 18<br />
III 3.5 - 4.0 440 - 485 535 - 590 2.8 - 3.2 2010 - 2030 -30 to +5 21<br />
IV 4.0 - 5.0 485 - 570 590 - 710 3.2 - 4.0 2<strong>02</strong>0 - 2060 +10 to +60 118<br />
V 5.0 - 6.0 570 - 660 710 - 855 4.0 - 4.9 2050 - 2080 +25 to +85 9<br />
VI 6.0 - 7.5 660 - 790 855 - 1130 4.9 - 6.1 2060 - 2090 +90 to +140 5<br />
TOTAL 177<br />
Number of<br />
assessed<br />
scenario<br />
Table 5: Properties of emissions pathways for alternative CO2 and CO2-eq stabilization tar-<br />
gets.<br />
Source: Quinet (2009), from IPCC (2007a).<br />
3.2.2 Comparisons between our air traffic CO2 emissions projections scenarios<br />
and the IPCC ones<br />
Table 6 compares our CO2 emissions forecasts coming from air transport (lines, in gray) with<br />
worldwide CO2 emissions coming from the IPCC scenarios of type I, III, and IV 28 (columns,<br />
in blue) until 2<strong>02</strong>5.<br />
Let us first detail the comparison of our benchmark scenario with the three SRES scenar-<br />
ios contained in Table 6. This Table recalls the total of world CO2 emissions, expressed in<br />
28 The IPCC scenarios of type V and VI have been deliberately dismissed, as they would yield to unsustain-<br />
ably high levels of climate change.<br />
26