12-02-Cahier-R- ... e-Chevallier-Gastineau.pdf - Base ...
12-02-Cahier-R- ... e-Chevallier-Gastineau.pdf - Base ...
12-02-Cahier-R- ... e-Chevallier-Gastineau.pdf - Base ...

You also want an ePaper? Increase the reach of your titles
YUMPU automatically turns print PDFs into web optimized ePapers that Google loves.
CO2 emissions (Mt p.y.)<br />
Notes:<br />
2000<br />
1800<br />
1600<br />
1400<br />
<strong>12</strong>00<br />
1000<br />
800<br />
600<br />
400<br />
200<br />
<br />
<br />
<br />
<br />
0<br />
1995 2000 2005 2010 2015 2<strong>02</strong>0 2<strong>02</strong>5 2030<br />
Eyers et al. (2004)<br />
Horton (2006)<br />
<br />
<br />
<br />
<br />
<br />
×<br />
<br />
Vedantham and Oppenheimer (1998)<br />
Berghof et al. (2005)<br />
Brannigan et al. (2009)<br />
<br />
<br />
×<br />
<br />
<br />
<br />
<br />
<br />
<br />
×<br />
<br />
Owen and Lee (2006)<br />
<br />
<br />
<br />
<br />
Owen et al. (2010)<br />
Benchmark scenario (this study)<br />
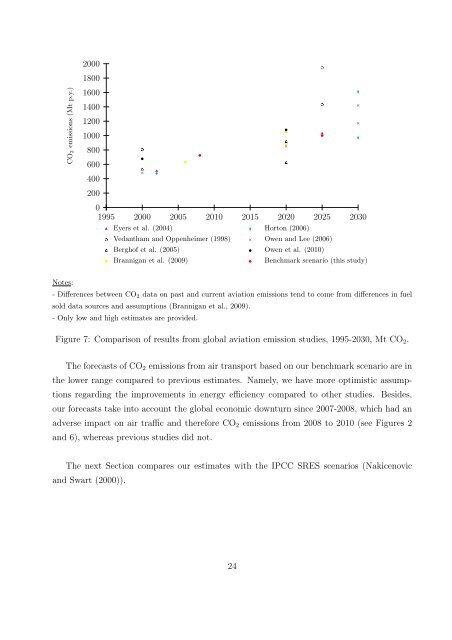
- Differences between CO2 data on past and current aviation emissions tend to come from differences in fuel<br />
sold data sources and assumptions (Brannigan et al., 2009).<br />
- Only low and high estimates are provided.<br />
Figure 7: Comparison of results from global aviation emission studies, 1995-2030, Mt CO2.<br />
The forecasts of CO2 emissions from air transport based on our benchmark scenario are in<br />
the lower range compared to previous estimates. Namely, we have more optimistic assump-<br />
tions regarding the improvements in energy efficiency compared to other studies. Besides,<br />
our forecasts take into account the global economic downturn since 2007-2008, which had an<br />
adverse impact on air traffic and therefore CO2 emissions from 2008 to 2010 (see Figures 2<br />
and 6), whereas previous studies did not.<br />
The next Section compares our estimates with the IPCC SRES scenarios (Nakicenovic<br />
and Swart (2000)).<br />
24<br />
×<br />
×