12-02-Cahier-R- ... e-Chevallier-Gastineau.pdf - Base ...
12-02-Cahier-R- ... e-Chevallier-Gastineau.pdf - Base ...
12-02-Cahier-R- ... e-Chevallier-Gastineau.pdf - Base ...

You also want an ePaper? Increase the reach of your titles
YUMPU automatically turns print PDFs into web optimized ePapers that Google loves.
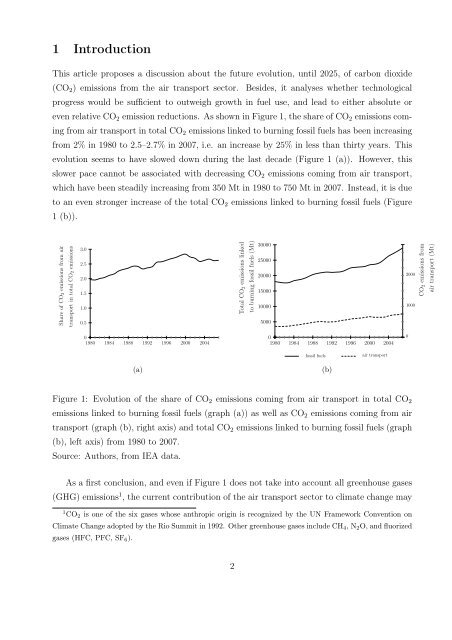
1 Introduction<br />
This article proposes a discussion about the future evolution, until 2<strong>02</strong>5, of carbon dioxide<br />
(CO2) emissions from the air transport sector. Besides, it analyses whether technological<br />
progress would be sufficient to outweigh growth in fuel use, and lead to either absolute or<br />
even relative CO2 emission reductions. As shown in Figure 1, the share of CO2 emissions com-<br />
ing from air transport in total CO2 emissions linked to burning fossil fuels has been increasing<br />
from 2% in 1980 to 2.5–2.7% in 2007, i.e. an increase by 25% in less than thirty years. This<br />
evolution seems to have slowed down during the last decade (Figure 1 (a)). However, this<br />
slower pace cannot be associated with decreasing CO2 emissions coming from air transport,<br />
which have been steadily increasing from 350 Mt in 1980 to 750 Mt in 2007. Instead, it is due<br />
to an even stronger increase of the total CO2 emissions linked to burning fossil fuels (Figure<br />
1 (b)).<br />
Share of CO2 emissions from air<br />
transport in total CO2 emissions<br />
3.0<br />
2.5<br />
2.0<br />
1.5<br />
1.0<br />
0.5<br />
0<br />
1980 1984 1988 1992 1996 2000 2004<br />
Total CO2 emissions linked<br />
to burning fossil fuels (Mt)<br />
30000<br />
25000<br />
20000<br />
15000<br />
10000<br />
5000<br />
0<br />
1980 1984 1988 1992 1996 2000 2004<br />
fossil fuels<br />
(a) (b)<br />
air transport<br />
Figure 1: Evolution of the share of CO2 emissions coming from air transport in total CO2<br />
emissions linked to burning fossil fuels (graph (a)) as well as CO2 emissions coming from air<br />
transport (graph (b), right axis) and total CO2 emissions linked to burning fossil fuels (graph<br />
(b), left axis) from 1980 to 2007.<br />
Source: Authors, from IEA data.<br />
As a first conclusion, and even if Figure 1 does not take into account all greenhouse gases<br />
(GHG) emissions 1 , the current contribution of the air transport sector to climate change may<br />
1 CO2 is one of the six gases whose anthropic origin is recognized by the UN Framework Convention on<br />
Climate Change adopted by the Rio Summit in 1992. Other greenhouse gases include CH4, N2O, and fluorized<br />
gases (HFC, PFC, SF6).<br />
2<br />
2000<br />
1000<br />
0<br />
CO2 emissions from<br />
air transport (Mt)