12-02-Cahier-R- ... e-Chevallier-Gastineau.pdf - Base ...
12-02-Cahier-R- ... e-Chevallier-Gastineau.pdf - Base ...
12-02-Cahier-R- ... e-Chevallier-Gastineau.pdf - Base ...

You also want an ePaper? Increase the reach of your titles
YUMPU automatically turns print PDFs into web optimized ePapers that Google loves.
Notes:<br />
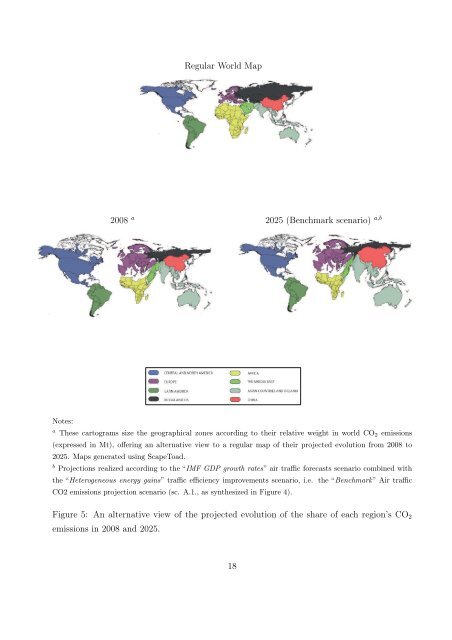
Regular World Map<br />
2008 a 2<strong>02</strong>5 (Benchmark scenario) a,b<br />
a These cartograms size the geographical zones according to their relative weight in world CO2 emissions<br />
(expressed in Mt), offering an alternative view to a regular map of their projected evolution from 2008 to<br />
2<strong>02</strong>5. Maps generated using ScapeToad.<br />
b Projections realized according to the “IMF GDP growth rates” air traffic forecasts scenario combined with<br />
the “Heterogeneous energy gains” traffic efficiency improvements scenario, i.e. the “Benchmark” Air traffic<br />
CO2 emissions projection scenario (sc. A.1., as synthesized in Figure 4).<br />
Figure 5: An alternative view of the projected evolution of the share of each region’s CO2<br />
emissions in 2008 and 2<strong>02</strong>5.<br />
18