Transportation and Warehousing Industry - Boston Redevelopment ...
Transportation and Warehousing Industry - Boston Redevelopment ...
Transportation and Warehousing Industry - Boston Redevelopment ...

You also want an ePaper? Increase the reach of your titles
YUMPU automatically turns print PDFs into web optimized ePapers that Google loves.
Peter Meade, Director<br />
John F. Palmieri, Director<br />
<strong>Transportation</strong> <strong>and</strong> <strong>Warehousing</strong> <strong>Industry</strong><br />
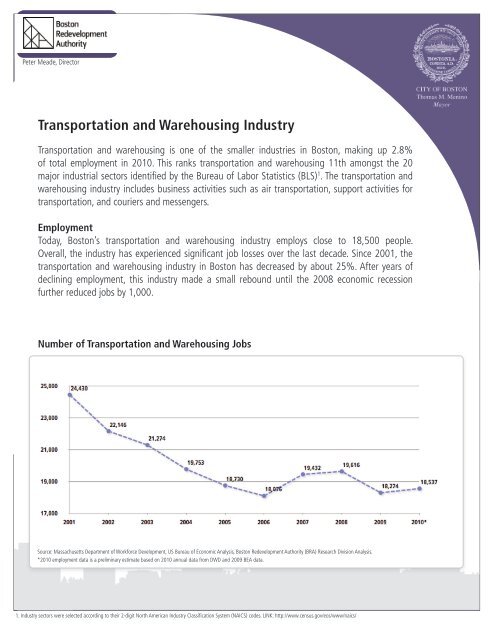
<strong>Transportation</strong> <strong>and</strong> warehousing is one of the smaller industries in <strong>Boston</strong>, making up 2.8%<br />
of total employment in 2010. This ranks transportation <strong>and</strong> warehousing 11th amongst the 20<br />
major industrial sectors identified by the Bureau of Labor Statistics (BLS) 1 . The transportation <strong>and</strong><br />
warehousing industry includes business activities such as air transportation, support activities for<br />
transportation, <strong>and</strong> couriers <strong>and</strong> messengers.<br />
Figure Employment 1:<br />
Today, <strong>Boston</strong>’s transportation <strong>and</strong> warehousing industry employs close to 18,500 people.<br />
Overall, the industry has experienced significant job losses over the last decade. Since 2001, the<br />
transportation <strong>and</strong> warehousing industry in <strong>Boston</strong> has decreased by about 25%. After years of<br />
declining employment, this industry made a small rebound until the 2008 economic recession<br />
further reduced jobs by 1,000.<br />
Number of <strong>Transportation</strong> <strong>and</strong> <strong>Warehousing</strong> Jobs<br />
Source: Massachusetts Department of Workforce Development, US Bureau of Economic Analysis, <strong>Boston</strong> <strong>Redevelopment</strong> Authority (BRA) Research Division Analysis.<br />
*2010 employment data is a preliminary estimate based on 2010 annual data from DWD <strong>and</strong> 2009 BEA data.<br />
1. <strong>Industry</strong> sectors were selected according to their 2-digit North American <strong>Industry</strong> Classification System (NAICS) codes. LINK: http://www.census.gov/eos/www/naics/
<strong>Transportation</strong> <strong>and</strong><br />
<strong>Warehousing</strong> <strong>Industry</strong><br />
The largest occupations in the transportation <strong>and</strong> warehousing industry in <strong>Boston</strong> include truck<br />
drivers, school bus drivers, laborers, <strong>and</strong> material movers. Below is a list of the top ten transportation <strong>and</strong><br />
warehousing occupations in <strong>Boston</strong> by employment. These ten occupations make up approximately 60%<br />
of the transportation <strong>and</strong> warehousing industry.<br />
Top Ten <strong>Transportation</strong> <strong>and</strong> <strong>Warehousing</strong> Occupations by Employment<br />
Job Title: Total<br />
Truck Drivers, Heavy <strong>and</strong> Tractor-Trailer .................................................1,949<br />
Bus Drivers, School ................................................................................1,814<br />
Reservation <strong>and</strong> <strong>Transportation</strong> Ticket Agents <strong>and</strong> Travel Clerks ...........1,584<br />
Laborers <strong>and</strong> Freight, Stock, <strong>and</strong> Material Movers, H<strong>and</strong> .....................1,016<br />
Taxi Drivers <strong>and</strong> Chauffeurs ................................................................... 660<br />
Flight Attendants ................................................................................... 636<br />
Concierges ............................................................................................. 572<br />
Truck Drivers, Light or Delivery Services .................................................. 522<br />
Tour Guides <strong>and</strong> Escorts ........................................................................ 506<br />
Industrial Truck <strong>and</strong> Tractor Operators .................................................... 410<br />
Source: Labor Market Assessment Tool 2.0, (BRA) Research Division Analysis.<br />
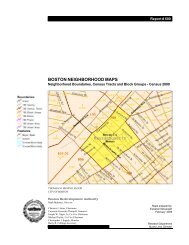
Major Employers in <strong>Transportation</strong> <strong>and</strong> <strong>Warehousing</strong><br />
The city’s largest employers in the transportation <strong>and</strong> warehousing industry include Massport, United<br />
Vision Logistics, Logan International Airport, Iron Mountain, Servisair, Continental Airlines, <strong>and</strong> Paul Revere<br />
<strong>Transportation</strong>. <strong>Transportation</strong> <strong>and</strong> warehousing establishments are scattered across the city, in particular they<br />
are concentrated downtown <strong>and</strong> in East <strong>Boston</strong>. The attached map depicts the transportation <strong>and</strong> warehousing<br />
establishments by size in <strong>Boston</strong>.<br />
2
<strong>Transportation</strong> <strong>and</strong><br />
<strong>Warehousing</strong> <strong>Industry</strong><br />
Education, Skill Requirements, <strong>and</strong> Wages<br />
Overall, the educational requirements for the transportation <strong>and</strong> warehousing industry are modest.<br />
Close to 87% of jobs in transportation <strong>and</strong> warehousing require some college or less. This is higher than<br />
<strong>Boston</strong> as a whole, where approximately 58% of jobs require some college or less. The <strong>Industry</strong>-to-Metro<br />
wage ratio shows how wages by educational requirement look different between an industry <strong>and</strong> the Metro<br />
<strong>Boston</strong> average for the same education level. In general, the average wages for jobs in transportation <strong>and</strong><br />
warehousing are lower than all jobs in the region by educational requirement.<br />
Education Requirements <strong>and</strong> Wages<br />
Source: Labor Market Assessment Tool 2.0, (BRA) Research Division Analysis.<br />
The <strong>Boston</strong> <strong>Redevelopment</strong> Authority’s Labor Market Assessment Tool (LMAT) 2 also has different measures<br />
for job training, called job zones. The lower the job zone number, the less training, education, <strong>and</strong> previous<br />
work experience needed to perform the job. Overall, close to 95% of jobs in transportation <strong>and</strong> warehousing<br />
are in job zones 1, 2, <strong>and</strong> 3. These indicate the transportation industries overall require modest skills. Most<br />
occupations in transportation <strong>and</strong> warehousing require some preparation, such as a high school diploma <strong>and</strong><br />
previous transportation/warehousing-related skills.<br />
2. For more detailed information on LMAT, please see Introducing the Labor Market Assessment Tool-<strong>Boston</strong> <strong>Redevelopment</strong> Authority Research Division-publication 613.<br />
LINK: http://www.bostonredevelopmentauthority.org/PDF/ResearchPublications/LMAT%20Introduction.pdf<br />
3
<strong>Transportation</strong> <strong>and</strong><br />
<strong>Warehousing</strong> <strong>Industry</strong><br />
Job Zones <strong>and</strong> Wages<br />
Source: Labor Market Assessment Tool 2.0, (BRA) Research Division Analysis.<br />
Sector Trends<br />
A location quotient (LQ) is used to assess the degree of regional specialization in an industry as compared to the<br />
national average. An LQ of “1” indicates that an industry is concentrated in a region’s economy in a proportion<br />
similar to the US overall. An LQ over “1” indicates that the industry is an area of concentration for the region. With<br />
a location quotient of 0.88, the transportation <strong>and</strong> warehousing industry accounts for a smaller proportion of total<br />
jobs in <strong>Boston</strong> than at the national level.<br />
In the coming years, employment in the transportation <strong>and</strong> warehousing industry in <strong>Boston</strong> is expected to decrease.<br />
Using New Engl<strong>and</strong> Economic Partnership (NEEP) projections, we estimate the transportation <strong>and</strong> warehousing<br />
industry will decrease by approximately 2.3%—or 426 jobs—by 2015 3 . This change would account for a 1.0%<br />
decrease of the city’s total employment change during the 5-year period<br />
3. Projections for 2010-2015 are based upon the New Engl<strong>and</strong> Economic Partnership (NEEP) May 2011 forecast.<br />
4
<strong>Transportation</strong> <strong>and</strong><br />
<strong>Warehousing</strong> <strong>Industry</strong><br />
<strong>Transportation</strong> <strong>and</strong> <strong>Warehousing</strong> <strong>Industry</strong><br />
Establishments by Employment Size<br />
Sources: InfoUSA Business Database 2010, BRA Research Division Analysis, BRA Office of Digital Cartography & GIS<br />
5
<strong>Transportation</strong> <strong>and</strong><br />
<strong>Warehousing</strong> <strong>Industry</strong><br />
City of <strong>Boston</strong> - <strong>Industry</strong> Profiles<br />
Rank <strong>Industry</strong>:<br />
1. Health Care <strong>and</strong> Social Assistance <strong>Industry</strong> 122,532 26,390 18.5% 1.67 $67,333 13,117<br />
2. Public Administration 78,354 (11,619) 11.8% 0.84 $66,111 2,911<br />
State Government 39,185 12,474 5.9% 1.95 - 1,456<br />
Local Government 22,983 (19,428) 3.5% 0.42 - 854<br />
Federal Government 16,184 1,354 2.4% 1.48 - 601<br />
3. Finance <strong>and</strong> Insurance <strong>Industry</strong> 78,407 (5,993) 11.8% 2.28 $170,624 1,695<br />
4. Professional, Scientific <strong>and</strong> Technical<br />
Services <strong>Industry</strong> 73,897 1,692 11.2% 1.62 $108,504 7,550<br />
5. Educational Services <strong>Industry</strong> 50,247 6,585 7.6% 3.28 $64,627 5,376<br />
6. Accommodation <strong>and</strong> Food<br />
Services <strong>Industry</strong> 49,577 6,143 7.5% 1.06 $25,956 4,622<br />
7. Administrative <strong>and</strong> Support <strong>and</strong> Waste<br />
Management Remediation Services <strong>Industry</strong> 32,124 (7,675) 4.9% 1.01 $46,005 3,286<br />
8. Retail Trade <strong>Industry</strong> 30,477 (360) 4.6% 0.45 $30,664 655<br />
9. Other Services (except Public Administration) 29,279 2,967 4.4% 0.89 $37,933 1,264<br />
10. Real Estate <strong>and</strong> Rental <strong>and</strong> Leasing <strong>Industry</strong> 21,382 2,227 3.2% 0.75 $80,999 465<br />
11. <strong>Transportation</strong> <strong>and</strong> <strong>Warehousing</strong> <strong>Industry</strong> 18,537 (5,893) 2.8% 0.88 $49,115 (426)<br />
12. Information <strong>Industry</strong> 16,407 (5,844) 2.5% 1.28 $88,463 1,583<br />
13. Arts, Entertainment, <strong>and</strong> Recreation <strong>Industry</strong> 14,712 2,452 2.2% 1.00 $79,502 1,383<br />
14. Construction <strong>Industry</strong> 13,864 (5,794) 2.1% 0.41 $90,825 28<br />
15. Manufacturing <strong>Industry</strong> 9,545 (8,596) 1.4% 0.20 $73,448 175<br />
16. Wholesale Trade <strong>Industry</strong> 9,256 (1,672) 1.4% 0.41 $79,231 283<br />
17. Management of Companies <strong>and</strong> Enterprises 6,243 (4,022) 0.9% 0.86 $122,906 643<br />
18. Utilities <strong>Industry</strong> 2,441 (249) 0.4% - $102,170 63<br />
19. Agriculture, Forestry, Fishing <strong>and</strong> Hunting <strong>and</strong> Mining 180 (1) 0.0% - $51,720 26<br />
Total 657,461 (9,262) 99.3% - $78,375 47,610<br />
• Projections for 2010-2015 are based upon the New Engl<strong>and</strong> Economic Partnership (NEEP) May 2011 forecast.<br />
• 2010 employment data is a preliminary estimate based on 2010 annual data from DWD <strong>and</strong> 2009 BEA data.<br />
• Because of low employment, Agriculture <strong>and</strong> Mining were combined for this table.<br />
Produced by the Research Division, July 2012 | www.braresearch.org<br />
Alvaro Lima, Director of Research<br />
Mark Melnik<br />
John Avault<br />
Nanette Dyer Blake<br />
Derek Shooster<br />
Nicoya Borella<br />
Creative Direction + Design: Amber Maher-Gilbert: SilverPixStudioS<br />
# OF<br />
EMPLOYEES<br />
CHANGE IN JOBS<br />
2001-2010<br />
% OF TOTAL<br />
EMPLOYMENT<br />
LOCATION<br />
QUOTIENT<br />
AVERAGE<br />
WAGES<br />
JOBS ADDED<br />
BY 2015<br />
6