Investor Relations and Regulation FD
Investor Relations and Regulation FD
Investor Relations and Regulation FD

You also want an ePaper? Increase the reach of your titles
YUMPU automatically turns print PDFs into web optimized ePapers that Google loves.
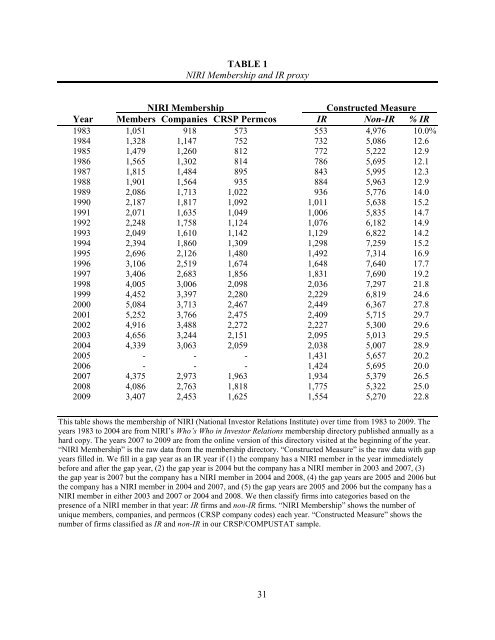
TABLE 1<br />
NIRI Membership <strong>and</strong> IR proxy<br />
NIRI Membership Constructed Measure<br />
Year Members Companies CRSP Permcos IR Non-IR % IR<br />
1983 1,051 918 573 553 4,976 10.0%<br />
1984 1,328 1,147 752 732 5,086 12.6<br />
1985 1,479 1,260 812 772 5,222 12.9<br />
1986 1,565 1,302 814 786 5,695 12.1<br />
1987 1,815 1,484 895 843 5,995 12.3<br />
1988 1,901 1,564 935 884 5,963 12.9<br />
1989 2,086 1,713 1,022 936 5,776 14.0<br />
1990 2,187 1,817 1,092 1,011 5,638 15.2<br />
1991 2,071 1,635 1,049 1,006 5,835 14.7<br />
1992 2,248 1,758 1,124 1,076 6,182 14.9<br />
1993 2,049 1,610 1,142 1,129 6,822 14.2<br />
1994 2,394 1,860 1,309 1,298 7,259 15.2<br />
1995 2,696 2,126 1,480 1,492 7,314 16.9<br />
1996 3,106 2,519 1,674 1,648 7,640 17.7<br />
1997 3,406 2,683 1,856 1,831 7,690 19.2<br />
1998 4,005 3,006 2,098 2,036 7,297 21.8<br />
1999 4,452 3,397 2,280 2,229 6,819 24.6<br />
2000 5,084 3,713 2,467 2,449 6,367 27.8<br />
2001 5,252 3,766 2,475 2,409 5,715 29.7<br />
2002 4,916 3,488 2,272 2,227 5,300 29.6<br />
2003 4,656 3,244 2,151 2,095 5,013 29.5<br />
2004 4,339 3,063 2,059 2,038 5,007 28.9<br />
2005 - - - 1,431 5,657 20.2<br />
2006 - - - 1,424 5,695 20.0<br />
2007 4,375 2,973 1,963 1,934 5,379 26.5<br />
2008 4,086 2,763 1,818 1,775 5,322 25.0<br />
2009 3,407 2,453 1,625 1,554 5,270 22.8<br />
This table shows the membership of NIRI (National <strong>Investor</strong> <strong>Relations</strong> Institute) over time from 1983 to 2009. The<br />
years 1983 to 2004 are from NIRI’s Who’s Who in <strong>Investor</strong> <strong>Relations</strong> membership directory published annually as a<br />
hard copy. The years 2007 to 2009 are from the online version of this directory visited at the beginning of the year.<br />
“NIRI Membership” is the raw data from the membership directory. “Constructed Measure” is the raw data with gap<br />
years filled in. We fill in a gap year as an IR year if (1) the company has a NIRI member in the year immediately<br />
before <strong>and</strong> after the gap year, (2) the gap year is 2004 but the company has a NIRI member in 2003 <strong>and</strong> 2007, (3)<br />
the gap year is 2007 but the company has a NIRI member in 2004 <strong>and</strong> 2008, (4) the gap years are 2005 <strong>and</strong> 2006 but<br />
the company has a NIRI member in 2004 <strong>and</strong> 2007, <strong>and</strong> (5) the gap years are 2005 <strong>and</strong> 2006 but the company has a<br />
NIRI member in either 2003 <strong>and</strong> 2007 or 2004 <strong>and</strong> 2008. We then classify firms into categories based on the<br />
presence of a NIRI member in that year: IR firms <strong>and</strong> non-IR firms. “NIRI Membership” shows the number of<br />
unique members, companies, <strong>and</strong> permcos (CRSP company codes) each year. “Constructed Measure” shows the<br />
number of firms classified as IR <strong>and</strong> non-IR in our CRSP/COMPUSTAT sample.<br />
31