Investor Relations and Regulation FD
Investor Relations and Regulation FD
Investor Relations and Regulation FD

You also want an ePaper? Increase the reach of your titles
YUMPU automatically turns print PDFs into web optimized ePapers that Google loves.
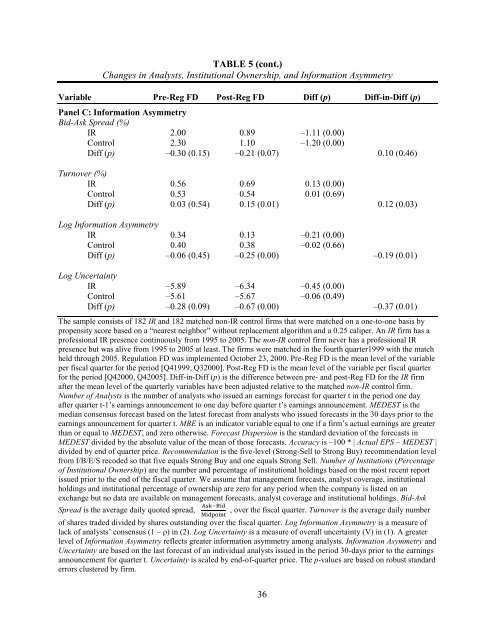
TABLE 5 (cont.)<br />
Changes in Analysts, Institutional Ownership, <strong>and</strong> Information Asymmetry<br />
Variable Pre-Reg <strong>FD</strong> Post-Reg <strong>FD</strong> Diff (p) Diff-in-Diff (p)<br />
Panel C: Information Asymmetry<br />
Bid-Ask Spread (%)<br />
IR 2.00 0.89 –1.11 (0.00)<br />
Control 2.30 1.10 –1.20 (0.00)<br />
Diff (p) –0.30 (0.15) –0.21 (0.07) 0.10 (0.46)<br />
Turnover (%)<br />
IR 0.56 0.69 0.13 (0.00)<br />
Control 0.53 0.54 0.01 (0.69)<br />
Diff (p) 0.03 (0.54) 0.15 (0.01) 0.12 (0.03)<br />
Log Information Asymmetry<br />
IR 0.34 0.13 –0.21 (0.00)<br />
Control 0.40 0.38 –0.02 (0.66)<br />
Diff (p) –0.06 (0.45) –0.25 (0.00) –0.19 (0.01)<br />
Log Uncertainty<br />
IR –5.89 –6.34 –0.45 (0.00)<br />
Control –5.61 –5.67 –0.06 (0.49)<br />
Diff (p) –0.28 (0.09) –0.67 (0.00) –0.37 (0.01)<br />
The sample consists of 182 IR <strong>and</strong> 182 matched non-IR control firms that were matched on a one-to-one basis by<br />
propensity score based on a “nearest neighbor” without replacement algorithm <strong>and</strong> a 0.25 caliper. An IR firm has a<br />
professional IR presence continuously from 1995 to 2005. The non-IR control firm never has a professional IR<br />
presence but was alive from 1995 to 2005 at least. The firms were matched in the fourth quarter1999 with the match<br />
held through 2005. <strong>Regulation</strong> <strong>FD</strong> was implemented October 23, 2000. Pre-Reg <strong>FD</strong> is the mean level of the variable<br />
per fiscal quarter for the period [Q41999, Q32000]. Post-Reg <strong>FD</strong> is the mean level of the variable per fiscal quarter<br />
for the period [Q42000, Q42005]. Diff-in-Diff (p) is the difference between pre- <strong>and</strong> post-Reg <strong>FD</strong> for the IR firm<br />
after the mean level of the quarterly variables have been adjusted relative to the matched non-IR control firm.<br />
Number of Analysts is the number of analysts who issued an earnings forecast for quarter t in the period one day<br />
after quarter t-1’s earnings announcement to one day before quarter t’s earnings announcement. MEDEST is the<br />
median consensus forecast based on the latest forecast from analysts who issued forecasts in the 30 days prior to the<br />
earnings announcement for quarter t. MBE is an indicator variable equal to one if a firm’s actual earnings are greater<br />
than or equal to MEDEST, <strong>and</strong> zero otherwise. Forecast Dispersion is the st<strong>and</strong>ard deviation of the forecasts in<br />
MEDEST divided by the absolute value of the mean of those forecasts. Accuracy is –100 * | Actual EPS – MEDEST |<br />
divided by end of quarter price. Recommendation is the five-level (Strong-Sell to Strong Buy) recommendation level<br />
from I/B/E/S recoded so that five equals Strong Buy <strong>and</strong> one equals Strong Sell. Number of Institutions (Percentage<br />
of Institutional Ownership) are the number <strong>and</strong> percentage of institutional holdings based on the most recent report<br />
issued prior to the end of the fiscal quarter. We assume that management forecasts, analyst coverage, institutional<br />
holdings <strong>and</strong> institutional percentage of ownership are zero for any period when the company is listed on an<br />
exchange but no data are available on management forecasts, analyst coverage <strong>and</strong> institutional holdings. Bid-Ask<br />
Spread is the average daily quoted spread, , over the fiscal quarter. Turnover is the average daily number<br />
of shares traded divided by shares outst<strong>and</strong>ing over the fiscal quarter. Log Information Asymmetry is a measure of<br />
lack of analysts’ consensus (1 – ρ) in (2). Log Uncertainty is a measure of overall uncertainty (V) in (1). A greater<br />
level of Information Asymmetry reflects greater information asymmetry among analysts. Information Asymmetry <strong>and</strong><br />
Uncertainty are based on the last forecast of an individual analysts issued in the period 30-days prior to the earnings<br />
announcement for quarter t. Uncertainty is scaled by end-of-quarter price. The p-values are based on robust st<strong>and</strong>ard<br />
errors clustered by firm.<br />
36