SSG No 4 - Shipgaz
SSG No 4 - Shipgaz
SSG No 4 - Shipgaz

Create successful ePaper yourself
Turn your PDF publications into a flip-book with our unique Google optimized e-Paper software.
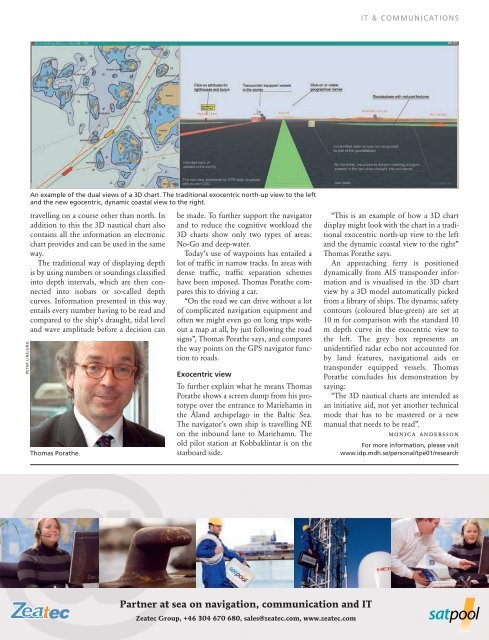
and the new egocentric, dynamic coastal view to the right.<br />
travelling on a course other than north. In<br />
addition to this the 3D nautical chart also<br />
contains all the information an electronic<br />
chart provides and can be used in the same<br />
way.<br />
The traditional way of displaying depth<br />
is by using numbers or soundings classified<br />
into depth intervals, which are then connected<br />
into isobars or so-called depth<br />
curves. Information presented in this way<br />
entails every number having to be read and<br />
compared to the ship’s draught, tidal level<br />
and wave amplitude before a decision can<br />
Thomas Porathe.<br />
be made. To further support the navigator<br />
and to reduce the cognitive workload the<br />
3D charts show only two types of areas:<br />
<strong>No</strong>-Go and deep-water.<br />
Today’s use of waypoints has entailed a<br />
lot of traffic in narrow tracks. In areas with<br />
dense traffic, traffic separation schemes<br />
have been imposed. Thomas Porathe compares<br />
this to driving a car.<br />
“On the road we can drive without a lot<br />
of complicated navigation equipment and<br />
often we might even go on long trips without<br />
a map at all, by just following the road<br />
signs”, Thomas Porathe says, and compares<br />
the way points on the GPS navigator function<br />
to roads.<br />
Exocentric view<br />
To further explain what he means Thomas<br />
Porathe shows a screen dump from his prototype<br />
over the entrance to Mariehamn in<br />
the Åland archipelago in the Baltic Sea.<br />
The navigator’s own ship is travelling NE<br />
on the inbound lane to Mariehamn. The<br />
old pilot station at Kobbaklintar is on the<br />
starboard side.<br />
PETER LINEJUNG An example of the dual views of a 3D chart. The traditional exocentric north-up view to the left<br />
Partner at sea on navigation, communication and IT<br />
Zeatec Group, +46 304 670 680, sales@zeatec.com, www.zeatec.com<br />
IT & COMMUNICATIONS<br />
“This is an example of how a 3D chart<br />
display might look with the chart in a traditional<br />
exocentric north-up view to the left<br />
and the dynamic coastal view to the right”<br />
Thomas Porathe says.<br />
An approaching ferry is positioned<br />
dynamically from AIS transponder information<br />
and is visualised in the 3D chart<br />
view by a 3D model automatically picked<br />
from a library of ships. The dynamic safety<br />
contours (coloured blue-green) are set at<br />
10 m for comparison with the standard 10<br />
m depth curve in the exocentric view to<br />
the left. The grey box represents an<br />
unidentified radar echo not accounted for<br />
by land features, navigational aids or<br />
transponder equipped vessels. Thomas<br />
Porathe concludes his demonstration by<br />
saying:<br />
“The 3D nautical charts are intended as<br />
an initiative aid, not yet another technical<br />
mode that has to be mastered or a new<br />
manual that needs to be read”.<br />
monica andersson<br />
For more information, please visit<br />
www.idp.mdh.se/personal/tpe01/research