Separate Realities: The Dream and the Iceberg - Scarecrow Press
Separate Realities: The Dream and the Iceberg - Scarecrow Press
Separate Realities: The Dream and the Iceberg - Scarecrow Press

Create successful ePaper yourself
Turn your PDF publications into a flip-book with our unique Google optimized e-Paper software.
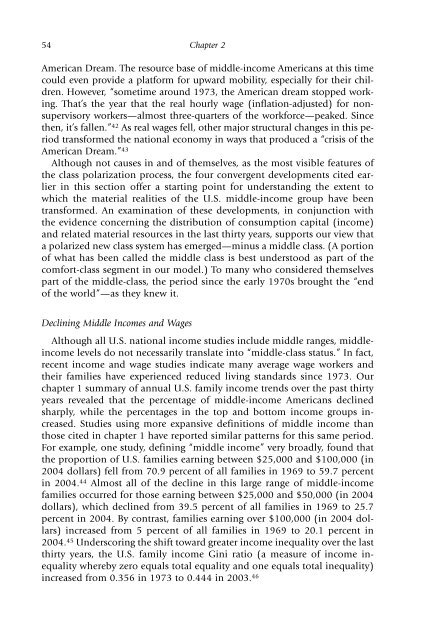
54 Chapter 2<br />
American <strong>Dream</strong>. <strong>The</strong> resource base of middle-income Americans at this time<br />
could even provide a platform for upward mobility, especially for <strong>the</strong>ir children.<br />
However, “sometime around 1973, <strong>the</strong> American dream stopped working.<br />
That’s <strong>the</strong> year that <strong>the</strong> real hourly wage (inflation-adjusted) for nonsupervisory<br />
workers—almost three-quarters of <strong>the</strong> workforce—peaked. Since<br />
<strong>the</strong>n, it’s fallen.” 42 As real wages fell, o<strong>the</strong>r major structural changes in this period<br />
transformed <strong>the</strong> national economy in ways that produced a “crisis of <strong>the</strong><br />
American <strong>Dream</strong>.” 43<br />
Although not causes in <strong>and</strong> of <strong>the</strong>mselves, as <strong>the</strong> most visible features of<br />
<strong>the</strong> class polarization process, <strong>the</strong> four convergent developments cited earlier<br />
in this section offer a starting point for underst<strong>and</strong>ing <strong>the</strong> extent to<br />
which <strong>the</strong> material realities of <strong>the</strong> U.S. middle-income group have been<br />
transformed. An examination of <strong>the</strong>se developments, in conjunction with<br />
<strong>the</strong> evidence concerning <strong>the</strong> distribution of consumption capital (income)<br />
<strong>and</strong> related material resources in <strong>the</strong> last thirty years, supports our view that<br />
a polarized new class system has emerged—minus a middle class. (A portion<br />
of what has been called <strong>the</strong> middle class is best understood as part of <strong>the</strong><br />
comfort-class segment in our model.) To many who considered <strong>the</strong>mselves<br />
part of <strong>the</strong> middle-class, <strong>the</strong> period since <strong>the</strong> early 1970s brought <strong>the</strong> “end<br />
of <strong>the</strong> world”—as <strong>the</strong>y knew it.<br />
Declining Middle Incomes <strong>and</strong> Wages<br />
Although all U.S. national income studies include middle ranges, middleincome<br />
levels do not necessarily translate into “middle-class status.” In fact,<br />
recent income <strong>and</strong> wage studies indicate many average wage workers <strong>and</strong><br />
<strong>the</strong>ir families have experienced reduced living st<strong>and</strong>ards since 1973. Our<br />
chapter 1 summary of annual U.S. family income trends over <strong>the</strong> past thirty<br />
years revealed that <strong>the</strong> percentage of middle-income Americans declined<br />
sharply, while <strong>the</strong> percentages in <strong>the</strong> top <strong>and</strong> bottom income groups increased.<br />
Studies using more expansive definitions of middle income than<br />
those cited in chapter 1 have reported similar patterns for this same period.<br />
For example, one study, defining “middle income” very broadly, found that<br />
<strong>the</strong> proportion of U.S. families earning between $25,000 <strong>and</strong> $100,000 (in<br />
2004 dollars) fell from 70.9 percent of all families in 1969 to 59.7 percent<br />
in 2004. 44 Almost all of <strong>the</strong> decline in this large range of middle-income<br />
families occurred for those earning between $25,000 <strong>and</strong> $50,000 (in 2004<br />
dollars), which declined from 39.5 percent of all families in 1969 to 25.7<br />
percent in 2004. By contrast, families earning over $100,000 (in 2004 dollars)<br />
increased from 5 percent of all families in 1969 to 20.1 percent in<br />
2004. 45 Underscoring <strong>the</strong> shift toward greater income inequality over <strong>the</strong> last<br />
thirty years, <strong>the</strong> U.S. family income Gini ratio (a measure of income inequality<br />
whereby zero equals total equality <strong>and</strong> one equals total inequality)<br />
increased from 0.356 in 1973 to 0.444 in 2003. 46