EGR 680 S'11 Assignment #8 - Claymore
EGR 680 S'11 Assignment #8 - Claymore
EGR 680 S'11 Assignment #8 - Claymore

You also want an ePaper? Increase the reach of your titles
YUMPU automatically turns print PDFs into web optimized ePapers that Google loves.
<strong>EGR</strong><strong>680</strong> S’11 4<br />
8. Under Debugger window, select Run -> Connect to Target. Accept the default settings<br />
and click OK. Then select Run -> Run to start the debugger. Your software will be<br />
downloaded and processor will be suspended automatically (breakpoint) at the first statement<br />
in the main. Keep your Hyper Terminal window and Debugger window in such a way<br />
that you can see both of them simultaneously.<br />
9. Now select Control -> Continue so that your application runs and halts at another<br />
breakpoint. You should see some message displayed in your Hyper Terminal based on your<br />
placement of breakpoint. You can keep pressing ‘C’ and your application will run and stop at<br />
the next breakpoint.<br />
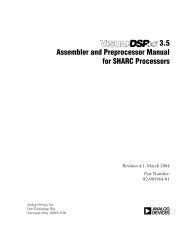
10. You might want to keep track of the variables that you have declared in your software<br />
while running your program. For that, go to View -> Local Variables and you should see<br />
Local Variables window as shown in Figure 5.<br />
Figure 5: Local Variables window<br />
11. You can change the dip-switch settings and then press ‘C’ or you can press ‘C’ while<br />
keeping the pushbutton pressed and you will see the new value highlighted in green.<br />
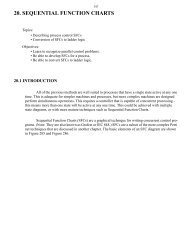
12. You can also look at the memory map by clicking on View -> Memory and it displays a<br />
Memory window as shown in Figure 6. You can type in the address of the memory in<br />
Address field and hit Enter.<br />
Figure 6: Memory Window<br />
Copyright 2011 GVSU School of Engineering