EGR 680 S'11 Assignment #8 - Claymore
EGR 680 S'11 Assignment #8 - Claymore
EGR 680 S'11 Assignment #8 - Claymore

Create successful ePaper yourself
Turn your PDF publications into a flip-book with our unique Google optimized e-Paper software.
<strong>EGR</strong><strong>680</strong> S’11 1<br />
Objectives<br />
Due Date: None<br />
Software Debugging and Writing Test benches<br />
• To guide you through the process of software debugging<br />
• To learn writing test benches in Verilog<br />
Part I – Software Debugging<br />
Copyright 2011 GVSU School of Engineering<br />
<strong>EGR</strong> <strong>680</strong> S’11<br />
<strong>Assignment</strong> <strong>#8</strong><br />
1. Copy your Lab6 project into C:\lab8 directory. Open XPS and browse to the folder<br />
containing your project. Click system.xmp to open the project.<br />
2. Start a terminal session<br />
• Baud rate: 115200<br />
• Data bits: 8<br />
• Parity: none<br />
• Stop bits: 1<br />
• Flow control: none<br />
3. Connect and power up the board. Download the bitstream by selecting Device Configuration<br />
Download Bitstream<br />
Note: Once the bitstream is downloaded, you should see the DONE LED ON and Dip- Switch<br />
and Push Button status displayed on terminal window.<br />
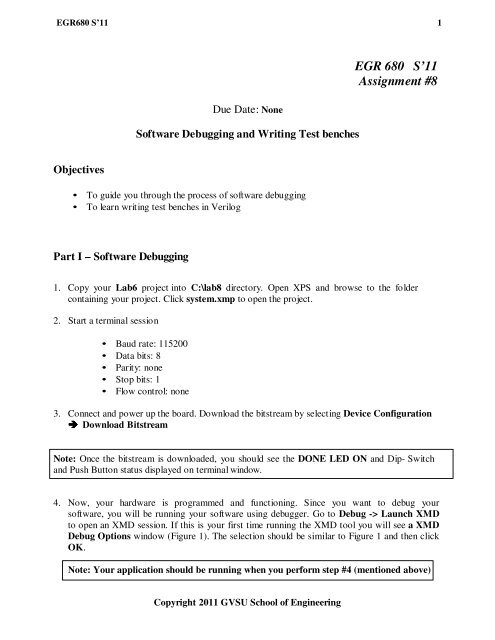
4. Now, your hardware is programmed and functioning. Since you want to debug your<br />
software, you will be running your software using debugger. Go to Debug -> Launch XMD<br />
to open an XMD session. If this is your first time running the XMD tool you will see a XMD<br />
Debug Options window (Figure 1). The selection should be similar to Figure 1 and then click<br />
OK.<br />
Note: Your application should be running when you perform step #4 (mentioned above)
<strong>EGR</strong><strong>680</strong> S’11 2<br />
Figure 1: Setting up XMD Debug options<br />
5. Either you will see a DOS window as shown in Figure 2 or you might have to click on Debug<br />
-> Launch XMD t o see a DOS window. This will halt the running process (your<br />
program). Make sure that your Power PC (ppc) target is connected to XMD at port 1234 and<br />
power is applied to the board.<br />
Figure 2: XMD connected to Power PC at port 1234<br />
Copyright 2011 GVSU School of Engineering
<strong>EGR</strong><strong>680</strong> S’11 3<br />
6. Select Debug -> Launch Software Debugger to open another window (Debugger) as<br />
shown in Figure 3. Select TestApp_Peripheral as the software application then click OK.<br />
Figure 3: Software Debugger<br />
7. You will set the breakpoint by clicking on the line (left side) and the breakpoint should be set<br />
(indicated by red dot) as shown in Figure 4.<br />
Figure 4: Setting Breakpoint<br />
Copyright 2011 GVSU School of Engineering
<strong>EGR</strong><strong>680</strong> S’11 4<br />
8. Under Debugger window, select Run -> Connect to Target. Accept the default settings<br />
and click OK. Then select Run -> Run to start the debugger. Your software will be<br />
downloaded and processor will be suspended automatically (breakpoint) at the first statement<br />
in the main. Keep your Hyper Terminal window and Debugger window in such a way<br />
that you can see both of them simultaneously.<br />
9. Now select Control -> Continue so that your application runs and halts at another<br />
breakpoint. You should see some message displayed in your Hyper Terminal based on your<br />
placement of breakpoint. You can keep pressing ‘C’ and your application will run and stop at<br />
the next breakpoint.<br />
10. You might want to keep track of the variables that you have declared in your software<br />
while running your program. For that, go to View -> Local Variables and you should see<br />
Local Variables window as shown in Figure 5.<br />
Figure 5: Local Variables window<br />
11. You can change the dip-switch settings and then press ‘C’ or you can press ‘C’ while<br />
keeping the pushbutton pressed and you will see the new value highlighted in green.<br />
12. You can also look at the memory map by clicking on View -> Memory and it displays a<br />
Memory window as shown in Figure 6. You can type in the address of the memory in<br />
Address field and hit Enter.<br />
Figure 6: Memory Window<br />
Copyright 2011 GVSU School of Engineering
<strong>EGR</strong><strong>680</strong> S’11 5<br />
13. You need to type in the memory location pertaining to your Dip-switch and Push button GPIO<br />
and then run your program. You should see the change in the value at that memory location.<br />
14. You can click on Run -> Disconnect to terminate the debugging session and close the tools.<br />
Part II – Writing Test Benches in Verilog (using Tasks)<br />
Based on the material (on Tasks and Functions) distributed/discussed in lecture, lets see how a<br />
test bench can be written using Tasks.<br />
1. Download “memory_trans.v” and “memory_test.v” from the course website. Create a<br />
project in Xilinx ISE and add both the verilog files into your project.<br />
NOTE: memory_test.v is created by selecting New Source and then selecting Verilog Test<br />
Fixture.<br />
2. The design involves a 2K memory (8-bit data and 8-bit address bus). The test bench uses two<br />
tasks (one to write the data to memory and other to read the contents of memory). You will<br />
run the simulation and verify if you actually read the correct data from the memory.<br />
3. If you don’t read the correct data then you need to identify the problems and make<br />
appropriate changes to the test bench.<br />
Conclusion<br />
Software debugging was performed using Xilinx’s built-in software debugger. Test bench was<br />
written in Verilog using tasks and the functionality of the sample design was verified using<br />
Xilinx simulator.<br />
Laboratory Deliverables<br />
• None<br />
Copyright 2011 GVSU School of Engineering