Physiological Data Reference Values for Tapir Species
Physiological Data Reference Values for Tapir Species
Physiological Data Reference Values for Tapir Species

You also want an ePaper? Increase the reach of your titles
YUMPU automatically turns print PDFs into web optimized ePapers that Google loves.
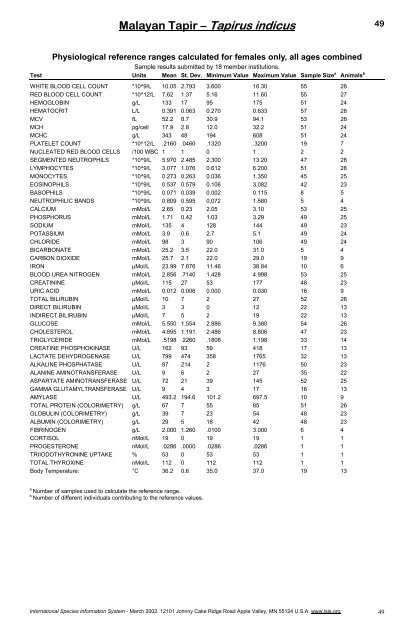
Malayan <strong>Tapir</strong> – <strong>Tapir</strong>us indicus<br />
<strong>Physiological</strong> reference ranges calculated <strong>for</strong> females only, all ages combined<br />
Sample results submitted by 18 member institutions.<br />
Test Units Mean St. Dev. Minimum Value Maximum Value Sample Size a Animals b<br />
WHITE BLOOD CELL COUNT *10^9/L 10.05 2.793 3.600 16.30 55 28<br />
RED BLOOD CELL COUNT *10^12/L 7.62 1.37 5.16 11.60 55 27<br />
HEMOGLOBIN g/L 133 17 95 175 51 24<br />
HEMATOCRIT L/L 0.391 0.063 0.270 0.633 57 28<br />
MCV fL 52.2 8.7 30.9 94.1 53 26<br />
MCH pg/cell 17.9 2.8 12.0 32.2 51 24<br />
MCHC g/L 343 48 194 608 51 24<br />
PLATELET COUNT *10^12/L .2160 .0460 .1320 .3200 19 7<br />
NUCLEATED RED BLOOD CELLS /100 WBC 1 1 0 1 2 2<br />
SEGMENTED NEUTROPHILS *10^9/L 5.970 2.485 2.300 13.20 47 28<br />
LYMPHOCYTES *10^9/L 3.077 1.076 0.612 6.200 51 28<br />
MONOCYTES *10^9/L 0.273 0.263 0.036 1.350 45 25<br />
EOSINOPHILS *10^9/L 0.537 0.579 0.106 3.082 42 23<br />
BASOPHILS *10^9/L 0.071 0.039 0.002 0.115 8 5<br />
NEUTROPHILIC BANDS *10^9/L 0.809 0.595 0.072 1.580 5 4<br />
CALCIUM mMol/L 2.65 0.23 2.05 3.10 53 25<br />
PHOSPHORUS mMol/L 1.71 0.42 1.03 3.29 49 25<br />
SODIUM mMol/L 135 4 128 144 49 23<br />
POTASSIUM mMol/L 3.9 0.6 2.7 5.1 49 24<br />
CHLORIDE mMol/L 98 3 90 106 49 24<br />
BICARBONATE mMol/L 25.2 3.5 22.0 31.0 5 4<br />
CARBON DIOXIDE mMol/L 25.7 2.1 22.0 29.0 19 9<br />
IRON µMol/L 23.99 7.876 11.46 38.84 10 6<br />
BLOOD UREA NITROGEN mMol/L 2.856 .7140 1.428 4.998 53 25<br />
CREATININE µMol/L 115 27 53 177 48 23<br />
URIC ACID mMol/L 0.012 0.006 0.000 0.030 16 9<br />
TOTAL BILIRUBIN µMol/L 10 7 2 27 52 26<br />
DIRECT BILIRUBIN µMol/L 3 3 0 12 22 13<br />
INDIRECT BILIRUBIN µMol/L 7 5 2 19 22 13<br />
GLUCOSE mMol/L 5.550 1.554 2.886 9.380 54 26<br />
CHOLESTEROL mMol/L 4.895 1.191 2.486 8.806 47 23<br />
TRIGLYCERIDE mMol/L .5198 .2260 .1808 1.198 33 14<br />
CREATINE PHOSPHOKINASE U/L 162 93 59 418 17 13<br />
LACTATE DEHYDROGENASE U/L 799 474 358 1765 32 13<br />
ALKALINE PHOSPHATASE U/L 87 214 2 1176 50 23<br />
ALANINE AMINOTRANSFERASE U/L 9 6 2 27 35 22<br />
ASPARTATE AMINOTRANSFERASE U/L 72 21 39 145 52 25<br />
GAMMA GLUTAMYLTRANSFERASE U/L 9 4 3 17 16 13<br />
AMYLASE U/L 493.2 194.6 101.2 697.5 10 9<br />
TOTAL PROTEIN (COLORIMETRY) g/L 67 7 55 85 51 26<br />
GLOBULIN (COLORIMETRY) g/L 39 7 23 54 48 23<br />
ALBUMIN (COLORIMETRY) g/L 29 5 18 42 48 23<br />
FIBRINOGEN g/L 2.000 1.260 .0100 3.000 6 4<br />
CORTISOL nMol/L 19 0 19 19 1 1<br />
PROGESTERONE nMol/L .0286 .0000 .0286 .0286 1 1<br />
TRIIODOTHYRONINE UPTAKE % 53 0 53 53 1 1<br />
TOTAL THYROXINE nMol/L 112 0 112 112 1 1<br />
Body Temperature: °C 36.2 0.6 35.0 37.0 19 13<br />
a Number of samples used to calculate the reference range.<br />
b Number of different individuals contributing to the reference values.<br />
International <strong>Species</strong> In<strong>for</strong>mation System - March 2002. 12101 Johnny Cake Ridge Road Apple Valley, MN 55124 U.S.A. www.isis.org<br />
49<br />
49