Physiological Data Reference Values for Tapir Species
Physiological Data Reference Values for Tapir Species
Physiological Data Reference Values for Tapir Species

Create successful ePaper yourself
Turn your PDF publications into a flip-book with our unique Google optimized e-Paper software.
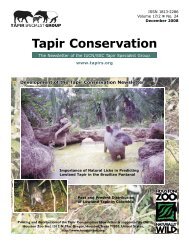
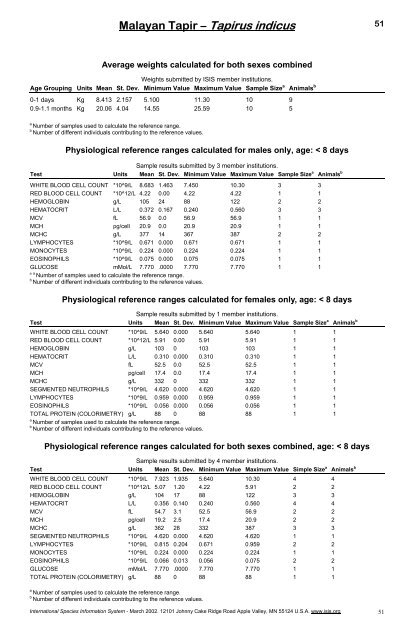
Malayan <strong>Tapir</strong> – <strong>Tapir</strong>us indicus<br />
Average weights calculated <strong>for</strong> both sexes combined<br />
Weights submitted by ISIS member institutions.<br />
Age Grouping Units Mean St. Dev. Minimum Value Maximum Value Sample Size a Animals b<br />
0-1 days Kg 8.413 2.157 5.100 11.30 10 9<br />
0.9-1.1 months Kg 20.06 4.04 14.55 25.59 10 5<br />
a Number of samples used to calculate the reference range.<br />
b Number of different individuals contributing to the reference values.<br />
<strong>Physiological</strong> reference ranges calculated <strong>for</strong> males only, age: < 8 days<br />
Sample results submitted by 3 member institutions.<br />
Test Units Mean St. Dev. Minimum Value Maximum Value Sample Size a Animals b<br />
WHITE BLOOD CELL COUNT *10^9/L 8.683 1.463 7.450 10.30 3 3<br />
RED BLOOD CELL COUNT *10^12/L 4.22 0.00 4.22 4.22 1 1<br />
HEMOGLOBIN g/L 105 24 88 122 2 2<br />
HEMATOCRIT L/L 0.372 0.167 0.240 0.560 3 3<br />
MCV fL 56.9 0.0 56.9 56.9 1 1<br />
MCH pg/cell 20.9 0.0 20.9 20.9 1 1<br />
MCHC g/L 377 14 367 387 2 2<br />
LYMPHOCYTES *10^9/L 0.671 0.000 0.671 0.671 1 1<br />
MONOCYTES *10^9/L 0.224 0.000 0.224 0.224 1 1<br />
EOSINOPHILS *10^9/L 0.075 0.000 0.075 0.075 1 1<br />
GLUCOSE mMol/L 7.770 .0000 7.770 7.770 1 1<br />
a a Number of samples used to calculate the reference range.<br />
b Number of different individuals contributing to the reference values.<br />
<strong>Physiological</strong> reference ranges calculated <strong>for</strong> females only, age: < 8 days<br />
Sample results submitted by 1 member institutions.<br />
Test Units Mean St. Dev. Minimum Value Maximum Value Sample Size a Animals b<br />
WHITE BLOOD CELL COUNT *10^9/L 5.640 0.000 5.640 5.640 1 1<br />
RED BLOOD CELL COUNT *10^12/L 5.91 0.00 5.91 5.91 1 1<br />
HEMOGLOBIN g/L 103 0 103 103 1 1<br />
HEMATOCRIT L/L 0.310 0.000 0.310 0.310 1 1<br />
MCV fL 52.5 0.0 52.5 52.5 1 1<br />
MCH pg/cell 17.4 0.0 17.4 17.4 1 1<br />
MCHC g/L 332 0 332 332 1 1<br />
SEGMENTED NEUTROPHILS *10^9/L 4.620 0.000 4.620 4.620 1 1<br />
LYMPHOCYTES *10^9/L 0.959 0.000 0.959 0.959 1 1<br />
EOSINOPHILS *10^9/L 0.056 0.000 0.056 0.056 1 1<br />
TOTAL PROTEIN (COLORIMETRY) g/L 88 0 88 88 1 1<br />
a<br />
Number of samples used to calculate the reference range.<br />
b<br />
Number of different individuals contributing to the reference values.<br />
<strong>Physiological</strong> reference ranges calculated <strong>for</strong> both sexes combined, age: < 8 days<br />
Sample results submitted by 4 member institutions.<br />
Test Units Mean St. Dev. Minimum Value Maximum Value Simple Size a Animals b<br />
WHITE BLOOD CELL COUNT *10^9/L 7.923 1.935 5.640 10.30 4 4<br />
RED BLOOD CELL COUNT *10^12/L 5.07 1.20 4.22 5.91 2 2<br />
HEMOGLOBIN g/L 104 17 88 122 3 3<br />
HEMATOCRIT L/L 0.356 0.140 0.240 0.560 4 4<br />
MCV fL 54.7 3.1 52.5 56.9 2 2<br />
MCH pg/cell 19.2 2.5 17.4 20.9 2 2<br />
MCHC g/L 362 28 332 387 3 3<br />
SEGMENTED NEUTROPHILS *10^9/L 4.620 0.000 4.620 4.620 1 1<br />
LYMPHOCYTES *10^9/L 0.815 0.204 0.671 0.959 2 2<br />
MONOCYTES *10^9/L 0.224 0.000 0.224 0.224 1 1<br />
EOSINOPHILS *10^9/L 0.066 0.013 0.056 0.075 2 2<br />
GLUCOSE mMol/L 7.770 .0000 7.770 7.770 1 1<br />
TOTAL PROTEIN (COLORIMETRY) g/L 88 0 88 88 1 1<br />
a Number of samples used to calculate the reference range.<br />
b Number of different individuals contributing to the reference values.<br />
International <strong>Species</strong> In<strong>for</strong>mation System - March 2002. 12101 Johnny Cake Ridge Road Apple Valley, MN 55124 U.S.A. www.isis.org<br />
51<br />
51