Physiological Data Reference Values for Tapir Species
Physiological Data Reference Values for Tapir Species
Physiological Data Reference Values for Tapir Species

Create successful ePaper yourself
Turn your PDF publications into a flip-book with our unique Google optimized e-Paper software.
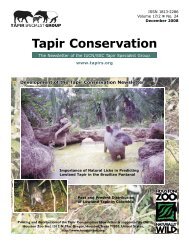
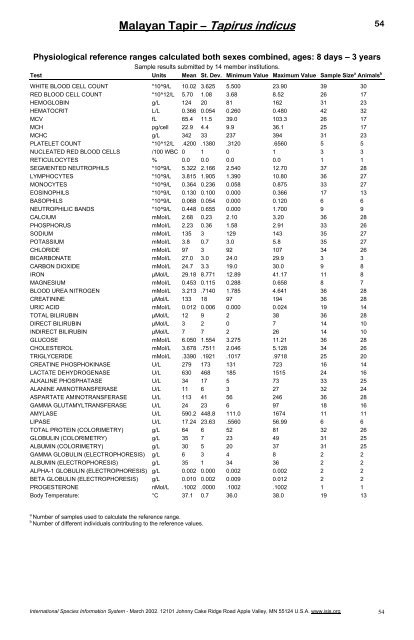
Malayan <strong>Tapir</strong> – <strong>Tapir</strong>us indicus<br />
<strong>Physiological</strong> reference ranges calculated both sexes combined, ages: 8 days – 3 years<br />
Sample results submitted by 14 member institutions.<br />
Test Units Mean St. Dev. Minimum Value Maximum Value Sample Size a Animals b<br />
WHITE BLOOD CELL COUNT *10^9/L 10.02 3.625 5.500 23.90 39 30<br />
RED BLOOD CELL COUNT *10^12/L 5.70 1.08 3.68 8.52 26 17<br />
HEMOGLOBIN g/L 124 20 81 162 31 23<br />
HEMATOCRIT L/L 0.366 0.054 0.260 0.480 42 32<br />
MCV fL 65.4 11.5 39.0 103.3 26 17<br />
MCH pg/cell 22.9 4.4 9.9 36.1 25 17<br />
MCHC g/L 342 33 237 394 31 23<br />
PLATELET COUNT *10^12/L .4200 .1380 .3120 .6560 5 5<br />
NUCLEATED RED BLOOD CELLS /100 WBC 0 1 0 1 3 3<br />
RETICULOCYTES % 0.0 0.0 0.0 0.0 1 1<br />
SEGMENTED NEUTROPHILS *10^9/L 5.322 2.166 2.540 12.70 37 28<br />
LYMPHOCYTES *10^9/L 3.815 1.905 1.390 10.80 36 27<br />
MONOCYTES *10^9/L 0.364 0.236 0.058 0.875 33 27<br />
EOSINOPHILS *10^9/L 0.130 0.100 0.000 0.366 17 13<br />
BASOPHILS *10^9/L 0.068 0.054 0.000 0.120 6 6<br />
NEUTROPHILIC BANDS *10^9/L 0.448 0.655 0.000 1.700 9 9<br />
CALCIUM mMol/L 2.68 0.23 2.10 3.20 36 28<br />
PHOSPHORUS mMol/L 2.23 0.36 1.58 2.91 33 26<br />
SODIUM mMol/L 135 3 129 143 35 27<br />
POTASSIUM mMol/L 3.8 0.7 3.0 5.8 35 27<br />
CHLORIDE mMol/L 97 3 92 107 34 26<br />
BICARBONATE mMol/L 27.0 3.0 24.0 29.9 3 3<br />
CARBON DIOXIDE mMol/L 24.7 3.3 19.0 30.0 9 8<br />
IRON µMol/L 29.18 8.771 12.89 41.17 11 8<br />
MAGNESIUM mMol/L 0.453 0.115 0.288 0.658 8 7<br />
BLOOD UREA NITROGEN mMol/L 3.213 .7140 1.785 4.641 36 28<br />
CREATININE µMol/L 133 18 97 194 36 28<br />
URIC ACID mMol/L 0.012 0.006 0.000 0.024 19 14<br />
TOTAL BILIRUBIN µMol/L 12 9 2 38 36 28<br />
DIRECT BILIRUBIN µMol/L 3 2 0 7 14 10<br />
INDIRECT BILIRUBIN µMol/L 7 7 2 26 14 10<br />
GLUCOSE mMol/L 6.050 1.554 3.275 11.21 36 28<br />
CHOLESTEROL mMol/L 3.678 .7511 2.046 5.128 34 26<br />
TRIGLYCERIDE mMol/L .3390 .1921 .1017 .9718 25 20<br />
CREATINE PHOSPHOKINASE U/L 279 173 131 723 16 14<br />
LACTATE DEHYDROGENASE U/L 630 468 185 1515 24 16<br />
ALKALINE PHOSPHATASE U/L 34 17 5 73 33 25<br />
ALANINE AMINOTRANSFERASE U/L 11 6 3 27 32 24<br />
ASPARTATE AMINOTRANSFERASE U/L 113 41 56 246 36 28<br />
GAMMA GLUTAMYLTRANSFERASE U/L 24 23 6 97 18 16<br />
AMYLASE U/L 590.2 448.8 111.0 1674 11 11<br />
LIPASE U/L 17.24 23.63 .5560 56.99 6 6<br />
TOTAL PROTEIN (COLORIMETRY) g/L 64 6 52 81 32 26<br />
GLOBULIN (COLORIMETRY) g/L 35 7 23 49 31 25<br />
ALBUMIN (COLORIMETRY) g/L 30 5 20 37 31 25<br />
GAMMA GLOBULIN (ELECTROPHORESIS) g/L 6 3 4 8 2 2<br />
ALBUMIN (ELECTROPHORESIS) g/L 35 1 34 36 2 2<br />
ALPHA-1 GLOBULIN (ELECTROPHORESIS) g/L 0.002 0.000 0.002 0.002 2 2<br />
BETA GLOBULIN (ELECTROPHORESIS) g/L 0.010 0.002 0.009 0.012 2 2<br />
PROGESTERONE nMol/L .1002 .0000 .1002 .1002 1 1<br />
Body Temperature: °C 37.1 0.7 36.0 38.0 19 13<br />
a Number of samples used to calculate the reference range.<br />
b Number of different individuals contributing to the reference values.<br />
International <strong>Species</strong> In<strong>for</strong>mation System - March 2002. 12101 Johnny Cake Ridge Road Apple Valley, MN 55124 U.S.A. www.isis.org<br />
54<br />
54