Physiological Data Reference Values for Tapir Species
Physiological Data Reference Values for Tapir Species
Physiological Data Reference Values for Tapir Species
You also want an ePaper? Increase the reach of your titles
YUMPU automatically turns print PDFs into web optimized ePapers that Google loves.
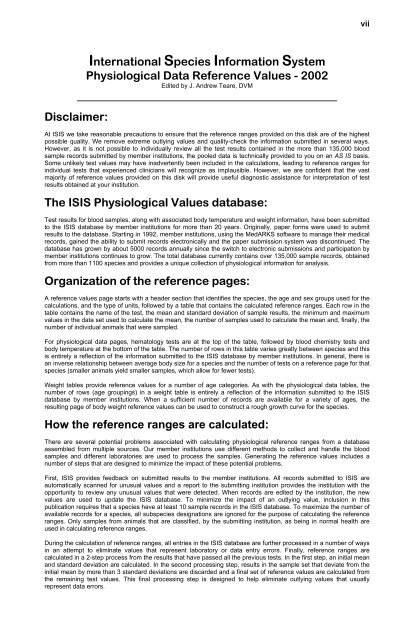
Disclaimer:<br />
International <strong>Species</strong> In<strong>for</strong>mation System<br />
<strong>Physiological</strong> <strong>Data</strong> <strong>Reference</strong> <strong>Values</strong> - 2002<br />
Edited by J. Andrew Teare, DVM<br />
At ISIS we take reasonable precautions to ensure that the reference ranges provided on this disk are of the highest<br />
possible quality. We remove extreme outlying values and quality-check the in<strong>for</strong>mation submitted in several ways.<br />
However, as it is not possible to individually review all the test results contained in the more than 135,000 blood<br />
sample records submitted by member institutions, the pooled data is technically provided to you on an AS IS basis.<br />
Some unlikely test values may have inadvertently been included in the calculations, leading to reference ranges <strong>for</strong><br />
individual tests that experienced clinicians will recognize as implausible. However, we are confident that the vast<br />
majority of reference values provided on this disk will provide useful diagnostic assistance <strong>for</strong> interpretation of test<br />
results obtained at your institution.<br />
The ISIS <strong>Physiological</strong> <strong>Values</strong> database:<br />
Test results <strong>for</strong> blood samples, along with associated body temperature and weight in<strong>for</strong>mation, have been submitted<br />
to the ISIS database by member institutions <strong>for</strong> more than 20 years. Originally, paper <strong>for</strong>ms were used to submit<br />
results to the database. Starting in 1992, member institutions, using the MedARKS software to manage their medical<br />
records, gained the ability to submit records electronically and the paper submission system was discontinued. The<br />
database has grown by about 5000 records annually since the switch to electronic submissions and participation by<br />
member institutions continues to grow. The total database currently contains over 135,000 sample records, obtained<br />
from more than 1100 species and provides a unique collection of physiological in<strong>for</strong>mation <strong>for</strong> analysis.<br />
Organization of the reference pages:<br />
A reference values page starts with a header section that identifies the species, the age and sex groups used <strong>for</strong> the<br />
calculations, and the type of units, followed by a table that contains the calculated reference ranges. Each row in the<br />
table contains the name of the test, the mean and standard deviation of sample results, the minimum and maximum<br />
values in the data set used to calculate the mean, the number of samples used to calculate the mean and, finally, the<br />
number of individual animals that were sampled.<br />
For physiological data pages, hematology tests are at the top of the table, followed by blood chemistry tests and<br />
body temperature at the bottom of the table. The number of rows in this table varies greatly between species and this<br />
is entirely a reflection of the in<strong>for</strong>mation submitted to the ISIS database by member institutions. In general, there is<br />
an inverse relationship between average body size <strong>for</strong> a species and the number of tests on a reference page <strong>for</strong> that<br />
species (smaller animals yield smaller samples, which allow <strong>for</strong> fewer tests).<br />
Weight tables provide reference values <strong>for</strong> a number of age categories. As with the physiological data tables, the<br />
number of rows (age groupings) in a weight table is entirely a reflection of the in<strong>for</strong>mation submitted to the ISIS<br />
database by member institutions. When a sufficient number of records are available <strong>for</strong> a variety of ages, the<br />
resulting page of body weight reference values can be used to construct a rough growth curve <strong>for</strong> the species.<br />
How the reference ranges are calculated:<br />
There are several potential problems associated with calculating physiological reference ranges from a database<br />
assembled from multiple sources. Our member institutions use different methods to collect and handle the blood<br />
samples and different laboratories are used to process the samples. Generating the reference values includes a<br />
number of steps that are designed to minimize the impact of these potential problems.<br />
First, ISIS provides feedback on submitted results to the member institutions. All records submitted to ISIS are<br />
automatically scanned <strong>for</strong> unusual values and a report to the submitting institution provides the institution with the<br />
opportunity to review any unusual values that were detected. When records are edited by the institution, the new<br />
values are used to update the ISIS database. To minimize the impact of an outlying value, inclusion in this<br />
publication requires that a species have at least 10 sample records in the ISIS database. To maximize the number of<br />
available records <strong>for</strong> a species, all subspecies designations are ignored <strong>for</strong> the purpose of calculating the reference<br />
ranges. Only samples from animals that are classified, by the submitting institution, as being in normal health are<br />
used in calculating reference ranges.<br />
During the calculation of reference ranges, all entries in the ISIS database are further processed in a number of ways<br />
in an attempt to eliminate values that represent laboratory or data entry errors. Finally, reference ranges are<br />
calculated in a 2-step process from the results that have passed all the previous tests. In the first step, an initial mean<br />
and standard deviation are calculated. In the second processing step, results in the sample set that deviate from the<br />
initial mean by more than 3 standard deviations are discarded and a final set of reference values are calculated from<br />
the remaining test values. This final processing step is designed to help eliminate outlying values that usually<br />
represent data errors.<br />
vii


