Fundamentals of Survey Research Methodology - Mitre
Fundamentals of Survey Research Methodology - Mitre
Fundamentals of Survey Research Methodology - Mitre
You also want an ePaper? Increase the reach of your titles
YUMPU automatically turns print PDFs into web optimized ePapers that Google loves.
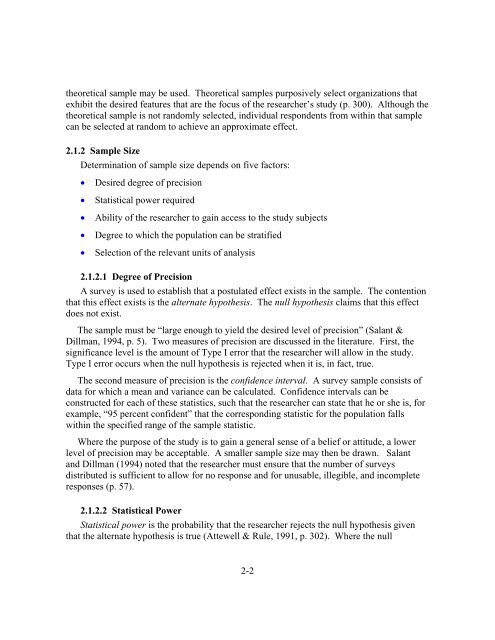
theoretical sample may be used. Theoretical samples purposively select organizations that<br />
exhibit the desired features that are the focus <strong>of</strong> the researcher’s study (p. 300). Although the<br />
theoretical sample is not randomly selected, individual respondents from within that sample<br />
can be selected at random to achieve an approximate effect.<br />
2.1.2 Sample Size<br />
Determination <strong>of</strong> sample size depends on five factors:<br />
• Desired degree <strong>of</strong> precision<br />
• Statistical power required<br />
• Ability <strong>of</strong> the researcher to gain access to the study subjects<br />
• Degree to which the population can be stratified<br />
• Selection <strong>of</strong> the relevant units <strong>of</strong> analysis<br />
2.1.2.1 Degree <strong>of</strong> Precision<br />
A survey is used to establish that a postulated effect exists in the sample. The contention<br />
that this effect exists is the alternate hypothesis. The null hypothesis claims that this effect<br />
does not exist.<br />
The sample must be “large enough to yield the desired level <strong>of</strong> precision” (Salant &<br />
Dillman, 1994, p. 5). Two measures <strong>of</strong> precision are discussed in the literature. First, the<br />
significance level is the amount <strong>of</strong> Type I error that the researcher will allow in the study.<br />
Type I error occurs when the null hypothesis is rejected when it is, in fact, true.<br />
The second measure <strong>of</strong> precision is the confidence interval. A survey sample consists <strong>of</strong><br />
data for which a mean and variance can be calculated. Confidence intervals can be<br />
constructed for each <strong>of</strong> these statistics, such that the researcher can state that he or she is, for<br />
example, “95 percent confident” that the corresponding statistic for the population falls<br />
within the specified range <strong>of</strong> the sample statistic.<br />
Where the purpose <strong>of</strong> the study is to gain a general sense <strong>of</strong> a belief or attitude, a lower<br />
level <strong>of</strong> precision may be acceptable. A smaller sample size may then be drawn. Salant<br />
and Dillman (1994) noted that the researcher must ensure that the number <strong>of</strong> surveys<br />
distributed is sufficient to allow for no response and for unusable, illegible, and incomplete<br />
responses (p. 57).<br />
2.1.2.2 Statistical Power<br />
Statistical power is the probability that the researcher rejects the null hypothesis given<br />
that the alternate hypothesis is true (Attewell & Rule, 1991, p. 302). Where the null<br />
2-2


