Advice: Make sure that all numerical answers are accompanied by their units. Matlab code for Fig. 2.11: % bandplot for delta-function results %uses fbands to get ga for a particular ka %24APR06 %ka=ka/pi and ga=ga/pi ka=[0 0.2 0.4 0.6 0.8 1.0]; ga1=[0.8364 0.8500 0.8871 0.9367 0.9814 1.0000]; ga2=[2.0000 1.9637 1.8804 1.7887 1.7171 1.6984]; ga3=[2.5678 2.6099 2.7112 2.8343 2.9475 3.0000]; ga4=[4.0000 3.9331 3.7981 3.6533 3.5285 3.4723]; ga5=[4.3988 4.4681 4.6105 4.7701 4.9205 5.0000]; plot(ka,ga1.^2,’o’,-ka,ga1.^2,’o’, ka,ga2.^2,’o’,-ka,ga2.^2,’o’, ... ka,ga3.^2,’o’,-ka,ga3.^2,’o’, ka,ga4.^2,’o’,-ka,ga4.^2,’o’, ... ka,ga5.^2,’o’,-ka,ga5.^2,’o’) hold on; %fitting parabola to valence band Evb= ....... (fill in your expression); plot(ka,Evb, -ka,Evb) 000 111 000 111 000 111 000 111 000 111 000 111 000 111 000 111 000 111 000 111 Figure 1: (Fig. 2.2 of text book) Example of a 2-D crystal comprising simple face-centred rectangular arrays of unshaded and shaded atoms. The Wigner-Seitz primitive unit cell is shown by the solid lines. These lines connect the perpendicular bisectors of the lines joining one unshaded atom to each neighbouring unshaded atom. One atom from the shaded array falls within the primitive unit cell; thus, this crystal structure has a basis of two atoms. 2 00 11 00 11 00 11 00 11 00 11 00 11 00 11 00 11 00 11 00 11 00 11 00 11 00 11 00 11
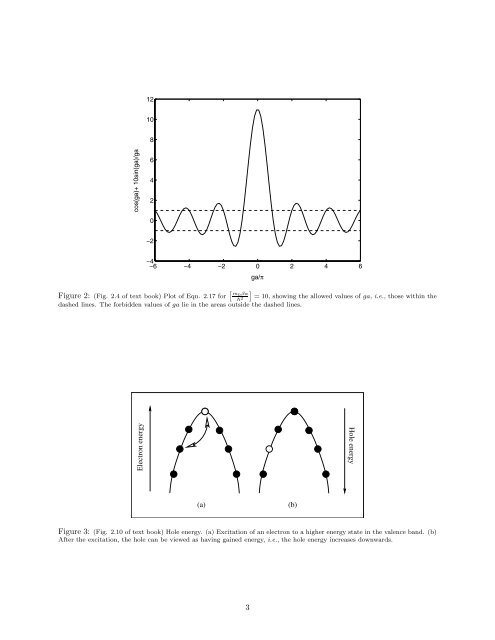
cos(ga)+ 10sin(ga)/ga 12 10 8 6 4 2 0 −2 −4 −6 −4 −2 0 2 4 6 Figure 2: (Fig. 2.4 of text book) Plot of Eqn. 2.17 for m0βa ¯h 2 = 10, showing the allowed values of ga, i.e., those within the dashed lines. The forbidden values of ga lie in the areas outside the dashed lines. Electron energy (a) Figure 3: (Fig. 2.10 of text book) Hole energy. (a) Excitation of an electron to a higher energy state in the valence band. (b) After the excitation, the hole can be viewed as having gained energy, i.e., the hole energy increases downwards. 3 ga/π (b) Hole energy