Characterization of downy mildew isolates of Sclerospora ...
Characterization of downy mildew isolates of Sclerospora ...
Characterization of downy mildew isolates of Sclerospora ...

You also want an ePaper? Increase the reach of your titles
YUMPU automatically turns print PDFs into web optimized ePapers that Google loves.
44<br />
A S. Jogaiah et al.<br />
Kalukombu, MBH110, 7042S, MLBH104,<br />
HHB67, ICMP451, 843B, 852B, 700651, P310-<br />
17, 1P18292, 1P18293 and H77/833-2 known<br />
resistant and susceptible pearl millet lines <strong>of</strong><br />
diverse geographical origin as potential differential<br />
lines. The number or pathotype designation<br />
given to an isolate is determined by the cultivars<br />
<strong>of</strong> the differential set that are infected by that<br />
isolate.<br />
Inoculation <strong>of</strong> differential cultivars<br />
Sporangia from each isolate were harvested from<br />
infected leaves during early morning and incubated<br />
for 15 min in dark and the released zoospores<br />
were suspended at a concentration <strong>of</strong> 4 x<br />
10 4 zoospores/ml and inoculated to two-day old<br />
seedlings sown in earthen pot (12-15 cm diameter)<br />
for three continuous days. 10 seedlings <strong>of</strong><br />
each cultivar were inoculated in each experiment,<br />
and the whole experiment was repeated at least<br />
twice. Inoculated plants were grown under 95%<br />
humidity for 15 days and then evaluated for <strong>downy</strong><br />
<strong>mildew</strong> disease symptoms, symptoms were<br />
evaluated on a four-level scale described as 0-5%<br />
= highly resistant, 5.1-10% = resistant, 10.1-25% =<br />
susceptible and 25.1-100% = highly susceptible.<br />
Molecular characterization <strong>of</strong> six S. graminicola<br />
pathotypes<br />
DNA isolation<br />
Six pathotypes, which were identified based on<br />
host differential cultivars, were used for molecular<br />
characterization. Sporangia <strong>of</strong> six different pathotypes<br />
were harvested in a sterilized MIRA cloth<br />
dispensed in ice cold sterile deionized water and<br />
fungal DNA was extracted (Sastry et al., 1995).<br />
PCR amplification and electrophoresis<br />
Twenty RAPD primers <strong>of</strong> 10-base oligonucleotide<br />
and 20 microsatellite repeat primers (ISSR) was<br />
used for PCR amplification. Amplification <strong>of</strong> DNA<br />
was performed in 10mM <strong>of</strong> Tris-HCl pH 9.0,<br />
50mM <strong>of</strong> KCl, 1.5mM <strong>of</strong> MgCl2, 0.2 mM <strong>of</strong><br />
dNTPs, 0.2µM <strong>of</strong> primer, 0.6 units <strong>of</strong> Taq DNA<br />
Polymerase enzyme (Bangalore Genei, Bangalore,<br />
India) and 50ng <strong>of</strong> DNA per 20 µl reaction using a<br />
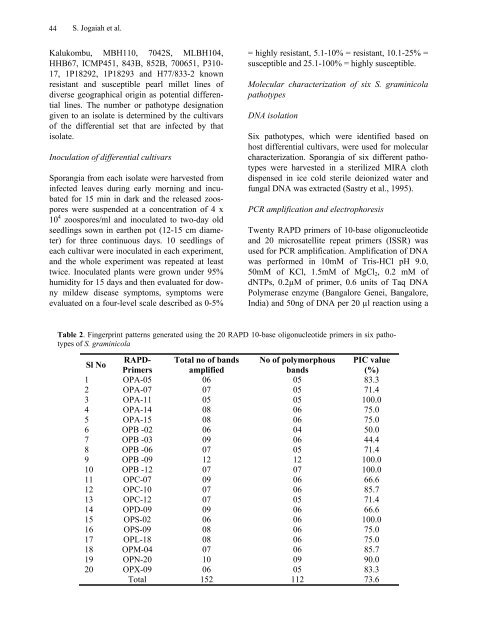
Table 2. Fingerprint patterns generated using the 20 RAPD 10-base oligonucleotide primers in six pathotypes<br />
<strong>of</strong> S. graminicola<br />
Sl No<br />
RAPD-<br />
Primers<br />
Total no <strong>of</strong> bands<br />
amplified<br />
No <strong>of</strong> polymorphous<br />
bands<br />
PIC value<br />
(%)<br />
1 OPA-05 06 05 83.3<br />
2 OPA-07 07 05 71.4<br />
3 OPA-11 05 05 100.0<br />
4 OPA-14 08 06 75.0<br />
5 OPA-15 08 06 75.0<br />
6 OPB -02 06 04 50.0<br />
7 OPB -03 09 06 44.4<br />
8 OPB -06 07 05 71.4<br />
9 OPB -09 12 12 100.0<br />
10 OPB -12 07 07 100.0<br />
11 OPC-07 09 06 66.6<br />
12 OPC-10 07 06 85.7<br />
13 OPC-12 07 05 71.4<br />
14 OPD-09 09 06 66.6<br />
15 OPS-02 06 06 100.0<br />
16 OPS-09 08 06 75.0<br />
17 OPL-18 08 06 75.0<br />
18 OPM-04 07 06 85.7<br />
19 OPN-20 10 09 90.0<br />
20 OPX-09 06 05 83.3<br />
Total 152 112 73.6