Characterization of downy mildew isolates of Sclerospora ...
Characterization of downy mildew isolates of Sclerospora ...
Characterization of downy mildew isolates of Sclerospora ...
Create successful ePaper yourself
Turn your PDF publications into a flip-book with our unique Google optimized e-Paper software.
ands by OPN-20.<br />
The microsatellite primers used included seventeen<br />
3 ’ anchored, one tri nucleotide and two<br />
tetra nucleotide microsatellite repeat primers<br />
(ISSR). Scoring <strong>of</strong> bands was carried out considering<br />
the dark and prominent bands. However,<br />
bands <strong>of</strong> lower intensity but with high reproducibility<br />
were also included in analysis (Table 3).<br />
Out <strong>of</strong> the 20 ISSR primers screened, trinucleotide<br />
primer-18 (TAG) 4 failed to amplify the<br />
template DNA at different annealing temperatures<br />
during repeated trials. A total <strong>of</strong> 297 bands<br />
were obtained from PCR amplification with 19<br />
primers using template DNA from six pathotypes.<br />
Subsequent scoring <strong>of</strong> the bands revealed<br />
82.15% polymorphism between S. graminicola<br />
pathotypes. The results indicated that ISSR<br />
fingerprints <strong>of</strong> S. graminicola detected a high<br />
level <strong>of</strong> diversity among the <strong>isolates</strong> and that<br />
ISSR markers could be a powerful alternative<br />
for fingerprinting and diversity analysis. Dinucleotide<br />
repeat 17899 B (CA)6 GC produced a<br />
maximum <strong>of</strong> 19 bands showing 100% polymorphism<br />
(Figure 2), followed by 18 bands by trinucleotide<br />
repeat 17899 A (CA)6 AG and HB 15<br />
(GTG)3 GC. Further, a unique band <strong>of</strong> approximately<br />
600 bp band was detected in <strong>isolates</strong> Sg<br />
Downy <strong>mildew</strong> <strong>isolates</strong> <strong>of</strong> <strong>Sclerospora</strong> graminicola 49<br />
A<br />
048, Sg 153, Sg 212, DM-11 and DM-90 from<br />
PCR amplification with Dinucleotide Repeat<br />
17898 A (CA)6 AC which was found to be associated<br />
to S. graminicola pathotype-1.<br />
Genetic distance was calculated for RAPD and<br />
ISSR fingerprints obtained to establish the relatedness<br />
between the <strong>isolates</strong>. In RAPD, the maximum<br />
distance index obtained was 0.1312 between pathotype-2<br />
and pathotype-3, which originated from<br />
Mysore, Karnataka and Aurangabad, Maharashtra<br />
respectively. The minimum distance index value <strong>of</strong><br />
0.0231 was obtained between pathotype-1 and<br />
pathotype-4 <strong>of</strong> Gulbarga, Karnataka and ICRISAT,<br />
Andhra Pradesh respectively, while in ISSR 0.1302<br />
was maximum between pathotype-4 and pathotype-<br />
6 from ICRISAT, Andhra Pradesh and Hissar,<br />
Haryana and minimum distance <strong>of</strong> 0.0124 from<br />
pathotype-1 and pathotype-5 <strong>of</strong> Gulbarga, Karnataka<br />
and Dhule, Maharashtra. The distance matrix<br />
based on RAPD and ISSR data sets was used to<br />
construct a dendrogram. The UPGMA Dendrogram<br />
obtained from the cluster analysis <strong>of</strong> RAPD and<br />
ISSR data gave similar clustering pattern, with<br />
similarity coefficient ranging from 0.27 to 0.88 and<br />
0.40 to 0.83 in RAPD and ISSR respectively.<br />
The dendrogram based on RAPD showed some<br />
variation in the clustering <strong>of</strong> the S. graminicola<br />
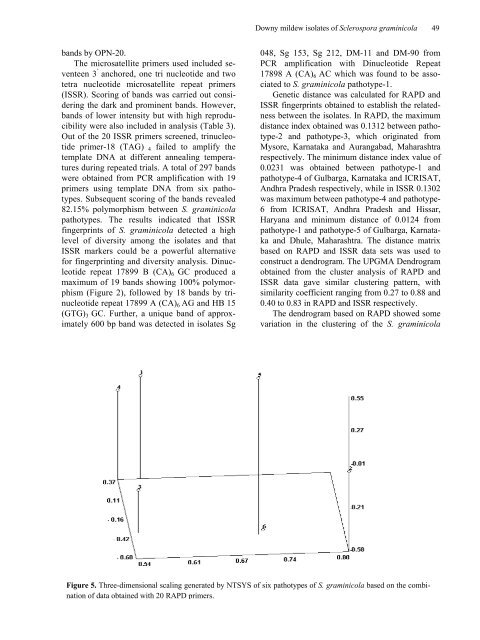
Figure 5. Three-dimensional scaling generated by NTSYS <strong>of</strong> six pathotypes <strong>of</strong> S. graminicola based on the combination<br />
<strong>of</strong> data obtained with 20 RAPD primers.


