a thermodynamic approach to cement hydration - Eawag-Empa ...
a thermodynamic approach to cement hydration - Eawag-Empa ...
a thermodynamic approach to cement hydration - Eawag-Empa ...

You also want an ePaper? Increase the reach of your titles
YUMPU automatically turns print PDFs into web optimized ePapers that Google loves.
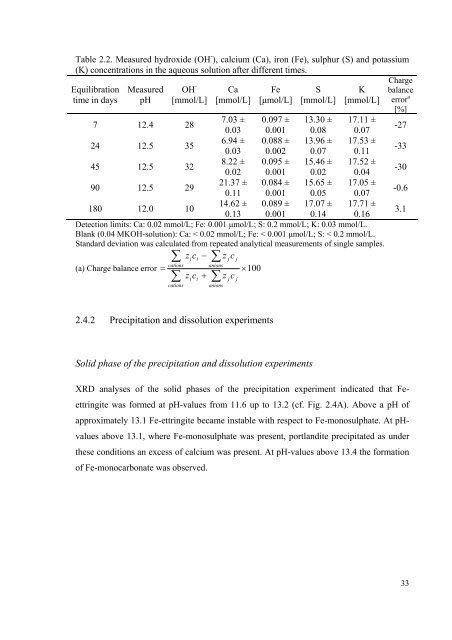
Table 2.2. Measured hydroxide (OH - ), calcium (Ca), iron (Fe), sulphur (S) and potassium<br />
(K) concentrations in the aqueous solution after different times.<br />
Equilibration Measured OH<br />
time in days pH<br />
-<br />
Ca Fe S K<br />
Charge<br />
balance<br />
[mmol/L] [mmol/L] [μmol/L] [mmol/L] [mmol/L] error a<br />
[%]<br />
7 12.4 28<br />
7.03 ±<br />
0.03<br />
0.097 ±<br />
0.001<br />
13.30 ±<br />
0.08<br />
17.11 ±<br />
0.07<br />
-27<br />
24 12.5 35<br />
6.94 ±<br />
0.03<br />
0.088 ±<br />
0.002<br />
13.96 ±<br />
0.07<br />
17.53 ±<br />
0.11<br />
-33<br />
45 12.5 32<br />
8.22 ±<br />
0.02<br />
0.095 ±<br />
0.001<br />
15.46 ±<br />
0.02<br />
17.52 ±<br />
0.04<br />
-30<br />
90 12.5 29<br />
21.37 ±<br />
0.11<br />
0.084 ±<br />
0.001<br />
15.65 ±<br />
0.05<br />
17.05 ±<br />
0.07<br />
-0.6<br />
180 12.0 10<br />
14.62 ±<br />
0.13<br />
0.089 ±<br />
0.001<br />
17.07 ±<br />
0.14<br />
17.71 ±<br />
0.16<br />
3.1<br />
Detection limits: Ca: 0.02 mmol/L; Fe: 0.001 μmol/L; S: 0.2 mmol/L; K: 0.03 mmol/L.<br />
Blank (0.04 MKOH-solution): Ca: < 0.02 mmol/L; Fe: < 0.001 μmol/L; S: < 0.2 mmol/L.<br />
Standard deviation was calculated from repeated analytical measurements of single samples.<br />
∑ zi<br />
ci<br />
− ∑ z jc<br />
j<br />
cations<br />
(a) Charge balance error =<br />
z c<br />
anions<br />
+ z c<br />
× 100<br />
∑ i i ∑<br />
cations anions<br />
2.4.2 Precipitation and dissolution experiments<br />
Solid phase of the precipitation and dissolution experiments<br />
j<br />
j<br />
XRD analyses of the solid phases of the precipitation experiment indicated that Fe-<br />
ettringite was formed at pH-values from 11.6 up <strong>to</strong> 13.2 (cf. Fig. 2.4A). Above a pH of<br />
approximately 13.1 Fe-ettringite became instable with respect <strong>to</strong> Fe-monosulphate. At pH-<br />
values above 13.1, where Fe-monosulphate was present, portlandite precipitated as under<br />
these conditions an excess of calcium was present. At pH-values above 13.4 the formation<br />
of Fe-monocarbonate was observed.<br />
33