MAP SKILLS FOR ENVIRONMENTAL SCIENCE - McMaster University
MAP SKILLS FOR ENVIRONMENTAL SCIENCE - McMaster University
MAP SKILLS FOR ENVIRONMENTAL SCIENCE - McMaster University

You also want an ePaper? Increase the reach of your titles
YUMPU automatically turns print PDFs into web optimized ePapers that Google loves.
<strong>MAP</strong> <strong>SKILLS</strong> <strong>FOR</strong> <strong>ENVIRONMENTAL</strong> <strong>SCIENCE</strong><br />
Gord Beck | Cathy Moulder | Lloyd Reeds Map Collection, Mills Library<br />
Env. Sci. 1G03
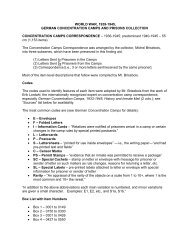
TOPOGRAPHIC <strong>MAP</strong>S<br />
Topographic map Google map<br />
1. High level of detail<br />
2. Produced in series<br />
3. Elevation information
COLOURS & SYMBOLS<br />
• International system of colours & symbols<br />
• intuitive<br />
Image from: Natural Resources Canada, Topographic Maps: the basics<br />
Blue = ?<br />
Green = ?<br />
Brown = ?<br />
Pink = ?<br />
Black = ?<br />
Legend<br />
found on<br />
back of map
MARGINAL IN<strong>FOR</strong>MATION<br />
• Index to adjoining map<br />
sheets<br />
• Coordinate systems<br />
• Publication date<br />
• Information currency date<br />
• North arrow<br />
• Magnetic declination<br />
statement<br />
• Scale<br />
• Contour interval statement
SCALE:<br />
(1) GRAPHIC LINE OR BAR SCALE<br />
2 cm on the map = 1 km in the real world<br />
1 cm on the map = .5 km in the real world
SCALE:<br />
(2) VERBAL
SCALE:<br />
(3) REPRESENTATIVE FRACTION<br />
1:50,000 = __1___<br />
50,000<br />
1:10,000 = ___1___<br />
10,000
SPOT HEIGHTS & CONTOURS<br />
Spot Heights to Contour Lines
CONTOUR LINES<br />
Image from: Natural Resources Canada, Topographic Maps: the basics
STREAM GRADIENT<br />
RISE<br />
Difference<br />
In elevation<br />
(metres)<br />
Point A:<br />
250m asl<br />
10m<br />
RUN<br />
Horizontal “real world” distance (metres)<br />
GRADIENT: RISE = Vertical Distance (10m)<br />
RUN Horizontal Distance (1000m)<br />
10m = 0.01 (no units)<br />
1000m<br />
1000m (1km)<br />
Point B:<br />
240m asl<br />
Section 8.12 in the Handbook for the Earth & Environmental Science Student
STREAM GRADIENT<br />
1. Use your coordinates to locate<br />
your start and end points.<br />
2. Use the first contour line you<br />
come to as the elevation for<br />
each point and calculate the<br />
difference in their elevations.<br />
3. Calculate the “real world”<br />
distance between them using a<br />
ruler and the map scale.<br />
GRADIENT = RISE = VERTICAL DISTANCE<br />
RUN HORIZONTAL DISTANCE
CROSS SECTIONAL PROFILES<br />
Use contour lines to create a cross section of the land surface<br />
STEP 1<br />
2cm = 1km therefore 12cm = 6km<br />
Use coordinates to find your start and end points<br />
Determine “real world” distance between points by using map scale<br />
Section 8.4 in the Handbook for the Earth & Environmental Science Student
CROSS SECTIONAL PROFILES<br />
• Place the edge of a piece of paper along the line.<br />
• Mark off the distance between both points based on<br />
the map scale determined in STEP 1<br />
• Mark all the contour lines and record their elevations.<br />
• Mark all features like streams, roads, etc.
STEP 3: Create a Graph<br />
180<br />
160<br />
140<br />
1cm<br />
120<br />
100<br />
80<br />
metres<br />
Y = Elevation (m asl)<br />
X = Distance from A to A’ (“real world” m or km)<br />
100<br />
120<br />
• Align your paper strip with<br />
the bottom (“X” axis) of<br />
your graph and transfer<br />
your contour, scale and<br />
feature data.<br />
• Assign your own scale to<br />
the Y axis (e.g. 1cm=20m).<br />
120<br />
100<br />
80<br />
stream<br />
scale<br />
80<br />
100<br />
120<br />
140<br />
160
STEP 4<br />
180<br />
160<br />
140<br />
120<br />
100<br />
80<br />
metres<br />
100<br />
120<br />
120<br />
Plot the corresponding elevation at each point<br />
100<br />
80<br />
scale<br />
Connect the dots and you’ve got a cross sectional profile!<br />
stream<br />
80<br />
100<br />
120<br />
140<br />
160
STEP 5<br />
180<br />
160<br />
140<br />
1cm<br />
120<br />
100<br />
80<br />
metres<br />
Calculate the Vertical Exaggeration (VE)<br />
1:2,000<br />
1 cm on the graph = 20m or 2,000 cm in the real world<br />
Vertical scale<br />
2cm<br />
1:50,000<br />
1 cm on the graph and map = .5 km or 50,000 cm in the real world<br />
Horizontal scale
VERTICAL EXAGGERATION<br />
VE =<br />
Vertical scale<br />
Horizontal scale<br />
=<br />
__1__<br />
2,000<br />
__1__<br />
50,000<br />
.0005<br />
= = 25<br />
.00002
<strong>MAP</strong> REFERENCING SYSTEMS<br />
Latitude & Longitude<br />
(Spherical system)<br />
Universal Transverse Mercator<br />
(Grid system)<br />
Military<br />
(Grid system)<br />
All systems use the intersection<br />
of an X and Y plane<br />
These 3 systems<br />
appear on Canadian<br />
topographic maps
UTM GRID SYSTEM<br />
Universal Transverse Mercator (UTM) Grid<br />
is a “planar” coordinate system.<br />
It deliberately attempts to remove<br />
the curvature of the earth in order to<br />
work on a flat surface.<br />
To create the flat surface<br />
the Earth is divided into 60 strips<br />
like sections of an orange.
When recording a UTM coordinate:<br />
the Easting is always written first<br />
the Northing is always written second.<br />
Read:<br />
Right...<br />
(Easting first)<br />
...Up<br />
(Northing second)
Step 1: Identify the UTM Grid<br />
It appears as<br />
BLUE lines<br />
on the surface of the<br />
map, and is indicated by<br />
BLUE numbers<br />
outside the neat line.
Step 2: Easting<br />
Read the Easting value for<br />
this line at the top or bottom<br />
edge of the map.<br />
Your first 2 digits are: 18<br />
Locate the blue line which is to the left (west)<br />
of your target location (an airport in this example).
Your 3 rd digit is a: 6<br />
Hint<br />
The Map Collection has<br />
special scale rulers for<br />
this purpose, but you<br />
can also use any ruler<br />
graduated in millimetres.<br />
• Use a ruler or “roamer” to measure the distance<br />
of your target location beyond the Easting line.
Add this digit to your Easting.<br />
186
Step 3: Northing<br />
Read the northing<br />
value for this line at the<br />
left or right edge of the<br />
map.<br />
Your next 2 digits are:<br />
47<br />
Locate the blue line that is below (south)<br />
of your target location.
Your 6 th digit<br />
is a: 5<br />
• Use your ruler or “roamer” to measure the distance of<br />
your target location above the Northing line.
Add this digit to your Northing.<br />
475
Easting: 186<br />
Northing: 475<br />
6-digit: 186475<br />
Combine the Easting & Northing numbers<br />
to form one 6-digit coordinate.
LATITUDE & LONGITUDE<br />
• There are two base lines or zero lines for the Latitude &<br />
Longitude coordinate system.<br />
• The base line for Longitude is called the Prime Meridian<br />
• The base line of Latitude is the Equator.
LATITUDE & LONGITUDE<br />
• When you calculate a coordinate you are actually<br />
establishing the angle at which your point of reference<br />
is located in relation to the zero line.<br />
• For this reason the units of measurement are angular<br />
and shown in Degrees, Minutes and Seconds.
LATITUDE & LONGITUDE<br />
50 degrees, 20 minutes and 10 seconds = 50˚ 20' 10''<br />
• A circle = 360 degrees<br />
• 1 degree = 60 minutes<br />
• 1 minute = 60 seconds<br />
A Degree is designated by a superscript “o”<br />
A Minute is designated by a single prime mark '<br />
A Second is designated by a double prime mark "
LATITUDE & LONGITUDE<br />
• Your coordinate should always include the ordinal<br />
(compass) direction<br />
For example: 50˚ 20' 10'' N<br />
Latitude 50˚ 20′ 10″ N,<br />
Longitude 105˚ 33′ 30″ W<br />
is Moose Jaw Airport!<br />
…and, of course you need a pair of coordinates to<br />
uniquely identify your location.
LATITUDE & LONGITUDE<br />
Step 1:<br />
Locate the Referencing System on the Map.<br />
It appears at the neat line of<br />
the map, and is indicated by:<br />
BLACK numbers<br />
and<br />
BLACK & WHITE bars.<br />
Disregard all BLUE lines and<br />
BLUE numbers. They are not<br />
related to latitude & longitude.
LATITUDE & LONGITUDE<br />
Step 2:<br />
In Which Direction Should You Count?<br />
In this example, the top of the map displays the larger number.<br />
Remember that you are measuring<br />
away from the base zero line, and<br />
towards the larger coordinate<br />
number.<br />
So you are measuring North on this<br />
side of the map.<br />
Latitude ˚ ′ ″ N
LATITUDE & LONGITUDE<br />
Step 3: Degrees<br />
On a 1:50,000 scale map<br />
the degrees usually do not<br />
require calculation…<br />
…as the area depicted<br />
on the map is smaller than<br />
one degree of latitude.<br />
Latitude 50˚ ′ ″ N
LATITUDE & LONGITUDE<br />
Step 4: Minutes<br />
Each black unit = 1 minute<br />
Each white unit = 1 minute<br />
Canadian topographic maps at 1:50,000 scale show minutes by<br />
means of these black and white markings along the neat line.
LATITUDE & LONGITUDE<br />
the target is farther than 18,<br />
but not as far as 19 minutes<br />
Count to the last full minute<br />
mark before your target and<br />
record that number as your<br />
minutes.<br />
Latitude 50˚ 18′ ″ N
LATITUDE & LONGITUDE<br />
Step 5: Seconds<br />
30''<br />
Latitude 50˚ 18' 30'' N<br />
There are 60 seconds in a<br />
minute so the trick here is<br />
dividing this small length into<br />
sixtieths.<br />
Count up the seconds until you<br />
are even with your target.<br />
In this example we are at the<br />
half-way point so the answer is<br />
30 seconds
LATITUDE & LONGITUDE<br />
So now you have your “X” plane coordinate:<br />
Latitude: 50˚ 18' 30'' N<br />
Repeat the same process to get your “Y” plane coordinate:<br />
Longitude: ___ ___ ___ W<br />
“Y”<br />
“X”<br />
http://www.portcities.org.uk/london/server/show/conMediaFile.6132/Latitude-and-longitude.html
NORTH ARROWS<br />
On topographic maps, direction is indicated in 3 ways:<br />
True North (TN)<br />
geometric/physical north pole<br />
Magnetic North (MN)<br />
location a compass points to,<br />
changes annually at a constant rate<br />
Grid North (GN)<br />
North orientation of the UTM Grid<br />
Sections 8.7 and 8.8 in the Handbook for the Earth & Environmental Science Student
MAGNETIC DECLINATION<br />
Describes the movement of<br />
Magnetic North (MN)<br />
away from<br />
True North (TN)<br />
It is the measurement of the angle shown as “X”<br />
It is expressed in degrees and minutes<br />
Annual rate of change found below the arrows<br />
(in this example: 4.3' per year)
MAGNETIC DECLINATION<br />
Find magnetic declination for 1993 (angle MN TN)<br />
9°39' - 0°31' = 9°08'<br />
Determine total change<br />
Years passed: 2010 – 1993 = 17<br />
17 * 0°4.3' = 73.1' 1°13.1'<br />
Add change to 1993 declination<br />
9°08' + 1°13.1' = 10°21.1'<br />
Therefore: the magnetic declination<br />
for 2010 would be 10°21.1'
HOURS<br />
Monday to Thursday: 9 a.m. to 9 p.m.<br />
Friday: 9 a.m. to 5 p.m.<br />
Saturday & Sunday: CLOSED