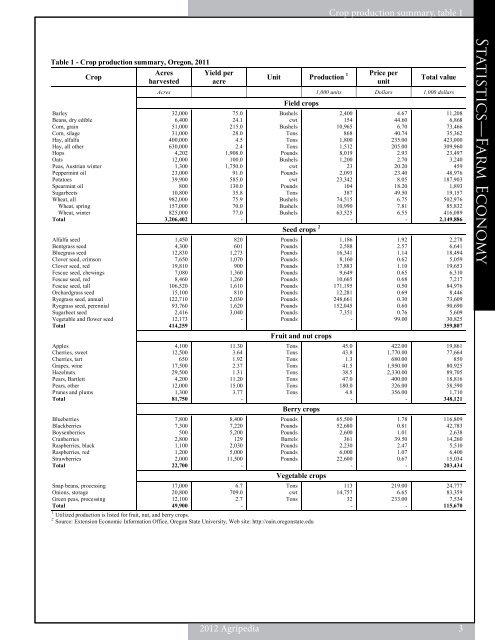
Table 1 - Crop production summary, <strong>Oregon</strong>, 2011 Crop Barley Beans, dry edible Corn, grain Corn, silage Hay, alfalfa Hay, all other Hops Oats Peas, Austrian winter Peppermint oil Potatoes Spearmint oil Sugarbeets Wheat, all Wheat, spring Wheat, winter Total Alfalfa seed Bentgrass seed Bluegrass seed Clover seed, crimson Clover seed, red Fescue seed, chewings Fescue seed, red Fescue seed, tall Orchardgrass seed Ryegrass seed, annual Ryegrass seed, perennial Sugarbeet seed Vegetable and flower seed Total Apples Cherries, sweet Cherries, tart Grapes, wine Hazelnuts Pears, Bartlett Pears, other Prunes and plums Total Blueberries Blackberries Boysenberries Cranberries Raspberries, black Raspberries, red Strawberries Total Snap beans, processing Onions, storage Green peas, processing Total Acres harvested Yield per acre Unit Production 1 Crop production summary, table 1 Price per unit Total value Acres 1,000 units Dollars 1,000 dollars 32,000 6,400 51,000 31,000 400,000 630,000 4,202 12,000 1,300 23,000 39,900 800 10,800 982,000 157,000 825,000 3,206,402 1,450 4,300 12,830 7,650 19,810 7,080 8,460 106,520 15,100 122,710 93,760 2,416 12,173 414,259 4,100 12,500 650 17,500 29,500 4,200 12,000 1,300 81,750 7,800 7,300 500 2,800 1,100 1,200 2,000 22,700 17,000 20,800 12,100 49,900 75.0 24.1 215.0 28.0 4.5 2.4 1,908.0 100.0 1,750.0 91.0 585.0 130.0 35.8 75.9 70.0 77.0 - 820 601 1,273 1,070 900 1,360 1,260 1,610 810 2,030 1,620 3,040 - 11.30 3.64 1.92 2.37 1.31 11.20 15.00 3.77 - 8,400 7,220 5,200 129 2,030 5,000 11,500 - 6.7 709.0 2.7 - Field crops Bushels cwt Bushels Tons Tons Tons Pounds Bushels cwt Pounds cwt Pounds Tons Bushels Bushels Bushels Seed crops 2 Pounds Pounds Pounds Pounds Pounds Pounds Pounds Pounds Pounds Pounds Pounds Pounds Pounds Fruit and nut crops Tons Tons Tons Tons Tons Tons Tons Tons Berry crops Pounds Pounds Pounds Barrels Pounds Pounds Pounds Vegetable crops Tons cwt Tons 1 Utilized production is listed for fruit, nut, and berry crops. 2 Source: Extension Economic <strong>Information</strong> Office, <strong>Oregon</strong> <strong>State</strong> University, Web site: http://oain.oregonstate.edu 2,400 154 10,965 868 1,800 1,512 8,019 1,200 23 2,093 23,342 104 387 74,515 10,990 63,525 - 1,186 2,588 16,341 8,160 17,883 9,649 10,665 171,195 12,281 248,661 152,045 7,351 - 45.0 43.8 1.3 41.5 38.5 47.0 180.0 4.8 - 65,500 52,680 2,600 361 2,230 6,000 22,600 - 113 14,757 32 - 4.67 44.60 6.70 40.74 235.00 205.00 2.93 2.70 20.20 23.40 8.05 18.20 49.50 6.75 7.81 6.55 - 1.92 2.57 1.14 0.62 1.10 0.65 0.68 0.50 0.69 0.30 0.60 0.76 99.00 422.00 1,770.00 680.00 1,950.00 2,330.00 400.00 326.00 356.00 - 1.78 0.81 1.01 39.50 2.47 1.07 0.67 - 219.00 6.65 233.00 - 11,208 6,868 73,466 35,362 423,000 309,960 23,497 3,240 459 48,976 187,903 1,893 19,157 502,976 85,832 416,089 2,149,886 2,278 6,641 18,494 5,059 19,653 6,310 7,217 84,976 8,446 73,609 90,690 5,609 30,825 359,807 19,861 77,664 850 80,925 89,705 18,816 58,590 1,710 348,121 116,809 42,783 2,638 14,260 5,510 6,400 15,034 203,434 24,777 83,359 7,534 115,670 <strong>2012</strong> Agripedia 3 Regulations—Farm Statistics—Farm Economy
Regulations—Farm Statistics—Farm Economy Number of farms and land in farms, table 2 Table 2 - Number of farms and land in farms: Total farms, land, average size, and value, <strong>Oregon</strong> and the United <strong>State</strong>s, selected years 1997-2011 1 1997 1998 1999 2000 2001 2002 2003 2004 2005 2006 2007 2008 2009 2010 2011 Year Number of farms Land in farms <strong>Oregon</strong> United <strong>State</strong>s Average size of farm Value per acre 2 Number of farms 4 <strong>2012</strong> Agripedia Land in farms Average size of farm Value per 2 3 acre 1,000 1,000 acres Acres Dollars 1,000 1,000 acres Acres Dollars 39.0 39.5 40.0 40.0 40.0 40.0 40.0 40.0 40.0 39.3 38.6 38.6 38.6 38.5 38.3 17,500 17,300 17,300 17,300 17,200 17,200 17,100 17,000 16,700 16,600 16,400 16,400 16,400 16,350 16,300 449 438 433 433 430 430 430 430 428 435 425 425 425 425 426 960 960 1,000 1,050 1,100 1,150 1,200 1,250 1,380 1,470 1,720 1,900 1,800 1,900 2,000 2,191 2,192 2,187 2,167 2,149 2,135 2,127 2,113 2,099 2,089 2,205 2,200 2,200 2,192 2,181 956,010 952,080 948,460 945,080 942,070 940,300 936,750 932,260 927,940 925,790 921,460 919,910 919,890 918,840 916,990 1 A farm is defined as any place that sells or would normally sell $1,000 worth of agricultural products or receives at least $1,000 in farm program payments. 2 Reference date for value per acre estimates is January 1 of each year. 3 Exclude Alaska and Hawaii. Table 3 - Economic sales classes: Number of farms and land in farms, <strong>Oregon</strong> and the United <strong>State</strong>s, 2006-2011 Area Year <strong>Oregon</strong> United <strong>State</strong>s <strong>Oregon</strong> United <strong>State</strong>s <strong>Oregon</strong> United <strong>State</strong>s <strong>Oregon</strong> United <strong>State</strong>s <strong>Oregon</strong> United <strong>State</strong>s <strong>Oregon</strong> United <strong>State</strong>s <strong>Oregon</strong> United <strong>State</strong>s <strong>Oregon</strong> United <strong>State</strong>s <strong>Oregon</strong> United <strong>State</strong>s <strong>Oregon</strong> United <strong>State</strong>s <strong>Oregon</strong> United <strong>State</strong>s <strong>Oregon</strong> United <strong>State</strong>s 2006 2006 2007 2007 2008 2008 2009 2009 2010 2010 2011 2011 2006 2006 2007 2007 2008 2008 2009 2009 2010 2010 2011 2011 $1,000- $9,999 $10,000- $99,999 $100,000- $249,999 $250,000- $499,999 Number of farms by economic sales class $500,000 and over 436 434 434 436 438 440 441 443 445 446 418 418 418 419 420 Total Farms Farms Farms Farms Farms Farms 25,200 1,153,310 24,600 1,228,560 24,400 1,222,100 24,400 1,229,400 24,400 1,227,200 24,600 1,200,550 9,200 595,950 9,200 608,670 8,900 604,500 9,300 597,080 9,200 592,420 8,700 600,350 2,100 166,220 2,000 150,300 2,300 149,000 2,100 147,290 2,100 147,290 2,000 145,640 1,400 90,960 1,100 97,230 1,200 98,500 1,000 99,570 1,000 98,980 1,000 100,890 Land in farms by economic sales class 1,400 82,350 1,700 120,190 1,800 126,000 1,800 124,770 1,800 126,110 2,000 133,570 1,000 acres 1,000 acres 1,000 acres 1,000 acres 1,000 acres 1,000 acres 1,400 114,610 1,700 107,870 1,700 106,700 1,600 105,580 1,600 104,380 1,600 100,680 4,200 252,180 3,400 228,220 3,400 225,310 3,600 226,900 3,550 225,130 3,300 225,050 3,500 185,336 3,100 153,407 3,100 151,300 3,200 147,890 3,200 143,710 3,000 138,730 3,300 149,316 2,600 145,725 2,600 143,545 2,400 149,385 2,400 147,295 2,400 146,805 4,200 224,348 5,600 286,238 5,600 293,055 5,600 290,135 5,600 298,325 6,000 305,725 926 974 1,020 1,090 1,150 1,210 1,270 1,360 1,610 1,830 2,010 2,170 2,110 2,200 2,390 39,300 2,088,790 38,600 2,204,950 38,600 2,200,100 38,600 2,200,210 38,500 2,192,000 38,300 2,181,000 16,600 925,790 16,400 921,460 16,400 919,910 16,400 919,890 16,350 918,840 16,300 916,990
- Page 2 and 3: OregOn Agriculture Oregon Agricultu
- Page 4 and 5: Oregon Agriculture & Fisheries Stat
- Page 6 and 7: Vineyards and wineries overview ...
- Page 8 and 9: Grower Assisted Inspection Program
- Page 10 and 11: 2011-2012 Oregon Agriculture & Fish
- Page 14 and 15: Exports: Top Estimated destinations
- Page 16 and 17: Per capita consumption, table 7 Tab
- Page 18 and 19: Hired workers by region, table 8 Ta
- Page 20 and 21: Crop production rankings, table 10
- Page 22 and 23: Table 12 - Oregon historical highli
- Page 24 and 25: Table 14 - Cash receipts: Farm mark
- Page 26 and 27: Prices paid by farmers, table 16 Ta
- Page 28 and 29: Horticulture and specialty products
- Page 30 and 31: Floriculture: Flats, Floriculture:
- Page 32 and 33: Hay production was high in 2011 whi
- Page 34 and 35: Table 25 - All wheat: Acreage, yiel
- Page 36 and 37: Table 27 - Spring wheat, all practi
- Page 38 and 39: Barley: By county, table 29 Table 2
- Page 40 and 41: Table 31 - Hay: Acreage, yield, and
- Page 42 and 43: Table 33 - Alfalfa hay: Acreage, yi
- Page 44 and 45: Table 35 - All potatoes: Acreage, y
- Page 46 and 47: Table 37 - Potatoes: Stocks, Oregon
- Page 48 and 49: Alfalfa, clover, and grass Peppermi
- Page 50 and 51: Fruit and nut crops production, tab
- Page 52 and 53: Million pounds 200 180 160 140 120
- Page 54 and 55: Tons 50,000 45,000 40,000 35,000 30
- Page 56 and 57: Oregon wine grape production rose 3
- Page 58 and 59: Overall 2011 berry production incre
- Page 60 and 61: Berry crops: By county, table 60 Ta
- Page 62 and 63:
Table 61 - Strawberries: Acreage, y
- Page 64 and 65:
Table 62 - Vegetable crops: Acreage
- Page 66 and 67:
Table 65 - Snap beans for processin
- Page 68 and 69:
Table 67 - Cold storage holdings: S
- Page 70 and 71:
Fertilizer: Material sold or distri
- Page 72 and 73:
Table 69 - Value of production: Liv
- Page 74 and 75:
Table 72 - Cattle and calves: Inven
- Page 76 and 77:
Million pounds 2,500 2,000 1,500 1,
- Page 78 and 79:
1,000 head 30 25 20 15 10 - 5 Hogs:
- Page 80 and 81:
Table 84 - All sheep: Inventory, va
- Page 82 and 83:
Sheep and lambs: Goats: Inventory,
- Page 84 and 85:
Honey, Mink, table 94 95 Table 94 -
- Page 86 and 87:
Commercial food fish: Historical, t
- Page 88:
ALABAMA 4121 Carmichael Rd. Sterlin
- Page 91 and 92:
Regulations Photograph by Jessica H
- Page 93 and 94:
Regulations—employment Employing
- Page 95 and 96:
Regulations—employment Employment
- Page 97 and 98:
Regulations—employment Family and
- Page 99 and 100:
Regulations—employment Minimum wa
- Page 101 and 102:
Regulations—employment Recruiting
- Page 103 and 104:
Regulations—employment Social Sec
- Page 105 and 106:
Regulations—employment Workers’
- Page 107 and 108:
Regulations—business Bird, predat
- Page 109 and 110:
Regulations—business Energy and a
- Page 111 and 112:
Regulations—business Exclusive fa
- Page 113 and 114:
Regulations—business Farm scales
- Page 115 and 116:
Regulations—business Fertilizers
- Page 117 and 118:
Regulations—business Grants and f
- Page 119 and 120:
Regulations—business Oregon Centu
- Page 121 and 122:
Regulations—business Oregon’s r
- Page 123 and 124:
Regulations—business Specialty Cr
- Page 125 and 126:
Regulations—livestock Caged Layin
- Page 127 and 128:
Regulations—livestock Confined An
- Page 129 and 130:
Regulations—livestock Importation
- Page 131 and 132:
Regulations—livestock Interstate
- Page 133 and 134:
Regulations—marketing Dairy produ
- Page 135 and 136:
Regulations—marketing Field inspe
- Page 137 and 138:
Regulations—marketing Good Agricu
- Page 139 and 140:
Regulations—marketing Organic Cos
- Page 141 and 142:
Regulations—marketing Weed-Free F
- Page 143 and 144:
Regulations—plants Imported firew
- Page 145 and 146:
Regulations—plants Protected nati
- Page 147 and 148:
Regulations—taxes Income tax with
- Page 149 and 150:
Regulations—taxes Self-employment
- Page 151 and 152:
Regulations—taxes Unemployment ta
- Page 153 and 154:
Regulations—Waste Composting wast
- Page 155 and 156:
Regulations—Waste Federal hazardo
- Page 157 and 158:
Regulations—Waste Pesticide use,
- Page 159 and 160:
Regulations—Waste Waste tire usag
- Page 161 and 162:
Regulations—Water Fish passage at
- Page 163 and 164:
Regulations—Water Groundwater $75
- Page 165 and 166:
Regulations—Water Water rights wh
- Page 167 and 168:
Regulations—Worker safety Agricul
- Page 169 and 170:
Regulations—Worker safety Field s
- Page 171 and 172:
Regulations—Worker safety Worker
- Page 173 and 174:
Regulations—Worker safety Worker
- Page 175 and 176:
Regulations—Worker safety Worker
- Page 177 and 178:
Regulations—Worker safety Worker
- Page 179 and 180:
Directory 170 2012 Agripedia Photog
- Page 181 and 182:
Directory—Ag organizations Americ
- Page 183 and 184:
Directory—Ag organizations Farm B
- Page 185 and 186:
Directory—Ag organizations Klamat
- Page 187 and 188:
Directory—Ag organizations Oregon
- Page 189 and 190:
Directory—Ag organizations Oregon
- Page 191 and 192:
Directory—Ag organizations Oregon
- Page 193 and 194:
Directory—Ag organizations Wallow
- Page 195 and 196:
Directory—Federal government Agri
- Page 197 and 198:
Directory—Federal government Labo
- Page 199 and 200:
Directory—State government Agricu
- Page 201 and 202:
Directory—State government Energy
- Page 203 and 204:
Directory—State government Occupa
- Page 205 and 206:
Directory—State government Oregon
- Page 207 and 208:
Directory—State government Soil &
- Page 210 and 211:
4-H Operating or riding on machiner
- Page 212 and 213:
Climate Environmental and Energy St
- Page 214 and 215:
FFA Organization National .........
- Page 216 and 217:
Material Safety Data Sheets Oregon
- Page 218 and 219:
Oregon Thoroughbred Owners & Breede
- Page 220 and 221:
Tree fruit Home Orchard Society ...