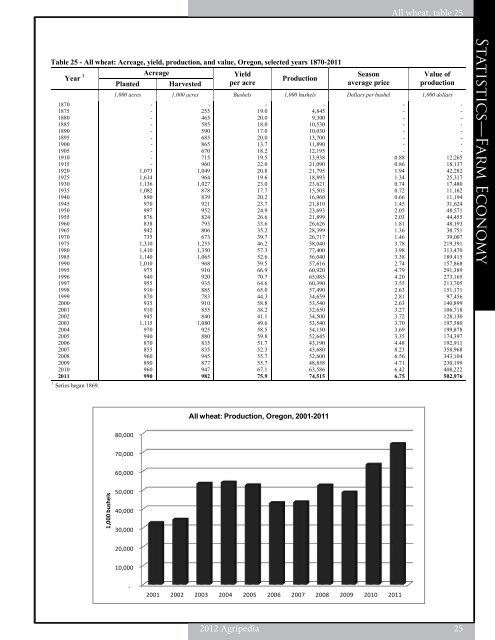
Table 25 - All wheat: Acreage, yield, production, and value, <strong>Oregon</strong>, selected years 1870-2011 Year 1 Acreage Planted Harvested Yield per acre Production 1870 1875 1880 1885 1890 1895 1900 1905 1910 1915 1920 1925 1930 1935 1940 1945 1950 1955 1960 1965 1970 1975 1980 1985 1990 1995 1996 1997 1998 1999 2000 2001 2002 2003 2004 2005 2006 2007 2008 2009 2010 2011 1 Series began 1869. 1,000 bushels Season average price All wheat, table 25 Value of production 1,000 acres 1,000 acres Bushels 1,000 bushels Dollars per bushel 1,000 dollars 80,000 70,000 60,000 50,000 40,000 30,000 20,000 10,000 - - - - - - - - - - - 1,073 1,614 1,136 1,082 890 970 997 876 838 942 735 1,310 1,410 1,140 1,010 975 940 955 910 870 935 910 945 1,115 970 940 870 855 960 890 960 990 - 255 465 585 590 685 865 670 715 960 1,049 964 1,027 878 839 921 952 824 793 806 673 1,255 1,350 1,065 968 910 920 935 885 783 910 855 840 1,080 925 880 835 835 945 877 947 982 - 19.0 20.0 18.0 17.0 20.0 13.7 18.2 19.5 22.0 20.8 19.6 23.0 17.7 20.2 23.7 24.9 26.6 33.6 35.2 39.7 46.2 57.3 52.6 59.5 66.9 70.7 64.6 65.0 44.3 58.8 38.2 41.1 49.6 58.5 59.8 51.7 52.3 55.7 55.7 67.1 75.9 - 4,845 9,300 10,530 10,030 13,700 11,890 12,195 13,938 21,090 21,795 18,893 23,621 15,503 16,960 21,810 23,693 21,899 26,626 28,399 26,717 58,040 77,400 56,040 57,616 60,920 65,085 60,390 57,490 34,659 53,540 32,650 34,500 53,540 54,150 52,645 43,190 43,680 52,600 48,858 63,586 74,515 All wheat: Production, <strong>Oregon</strong>, 2001-2011 2001 2002 2003 2004 2005 2006 2007 2008 2009 2010 2011 - - - - - - - - 0.88 0.86 1.94 1.34 0.74 0.72 0.66 1.45 2.05 2.03 1.81 1.36 1.46 3.78 3.98 3.38 2.74 4.79 4.20 3.55 2.63 2.81 2.63 3.27 3.72 3.70 3.69 3.35 4.48 8.23 6.56 4.71 6.42 6.75 - - - - - - - - 12,265 18,137 42,282 25,317 17,480 11,162 11,194 31,624 48,571 44,455 48,193 38,751 39,007 219,391 313,470 189,415 157,868 291,389 273,165 213,705 151,171 97,456 140,899 106,718 128,130 197,580 199,878 174,397 192,911 358,968 343,104 230,199 408,222 502,976 <strong>2012</strong> Agripedia 25 Regulations—Farm Statistics—Farm Economy
Regulations—Farm Statistics—Farm Economy Winter wheat, table 26 Table 26 - Winter wheat, all practices: Acreage, yield, and production, <strong>Oregon</strong>, by county, 2010-2011 District and county 1 2010 Acreage Yield Planted Harvested per acre Production 2011 Acreage Yield Planted Harvested per acre Benton Clackamas Clatsop Columbia Lane Lincoln Linn Marion Multnomah Polk Tillamook Washington Yamhill Combined counties Northwest Gilliam Hood River Morrow Sherman Wasco Combined counties North Central Baker Umatilla Union Wallowa Combined counties Northeast Coos Curry Douglas Jackson Josephine Combined counties Southwest Crook Deschutes Grant Harney Jefferson Klamath Lake Malheur Wheeler Combined counties Southeast Combined districts <strong>State</strong> total 820,000 810,000 1 Data not published (-) summed into combined counties or districts. (-) Data not published or no winter wheat. 26 <strong>2012</strong> Agripedia Production Acres Acres Bushels Bushels Acres Acres Bushels Bushels - - - - 7,600 - 22,700 21,000 800 18,500 - 12,600 14,000 15,800 113,000 84,000 - 126,000 105,000 62,000 - 377,000 7,000 247,000 28,000 6,500 - 288,500 - - - - - 500 500 - - - - - 3,600 - 26,000 - 11,400 41,000 - - - - - 7,500 - 22,500 21,000 800 18,500 - 12,600 13,100 15,400 111,400 84,000 - 123,400 103,600 62,000 - 373,000 7,000 245,000 27,600 5,900 - 285,500 - - - - - 300 300 - - - - - 3,600 - 25,800 - 10,400 39,800 - - - - - 104.0 - 103.6 110.1 112.5 97.7 - 99.8 97.9 88.9 100.8 43.2 - 44.5 51.4 55.5 - 48.0 106.0 71.9 88.7 67.8 - 74.3 - - - - - 43.3 43.3 - - - - - 75.0 - 98.9 - 105.2 98.4 - 67.0 - - - - 780,000 - 2,332,000 2,313,000 90,000 1,807,000 - 1,258,000 1,283,000 1,369,000 11,232,000 3,632,000 - 5,491,000 5,330,000 3,442,000 - 17,895,000 742,000 17,626,000 2,447,000 400,000 - 21,215,000 - - - - - 13,000 13,000 - - - - - 270,000 - 2,551,000 - 1,094,000 3,915,000 - 54,270,000 9,000 - - - - - 24,300 22,200 - 21,800 - 15,000 15,800 12,400 120,500 95,000 - 122,000 102,000 57,000 - 376,000 8,300 250,000 28,200 6,500 - 293,000 - - - - - 500 500 - - - - 6,800 3,700 - 26,000 - 3,500 40,000 - 830,000 9,000 - - - - - 24,200 22,100 - 21,800 - 14,900 15,800 12,200 120,000 95,000 - 122,000 102,000 57,000 - 376,000 8,300 250,000 25,200 6,500 - 290,000 - - - - - 400 400 - - - - 6,800 2,700 - 25,700 - 3,400 38,600 - 825,000 106.1 - - - - - 104.0 110.5 - 100.9 - 106.0 108.9 93.1 104.6 57.0 - 63.7 63.1 62.8 - 61.7 109.3 80.1 89.0 57.5 - 81.2 - - - - - 22.5 22.5 - - - - 121.6 101.9 - 110.1 - 84.7 109.3 - 77.0 955,000 - - - - - 2,517,000 2,442,000 - 2,200,000 - 1,580,000 1,720,000 1,136,000 12,550,000 5,414,000 - 7,771,000 6,436,000 3,579,000 - 23,200,000 907,000 20,022,000 2,243,000 374,000 - 23,546,000 - - - - - 9,000 9,000 - - - - 827,000 275,000 - 2,830,000 - 288,000 4,220,000 - 63,525,000
- Page 2 and 3: OregOn Agriculture Oregon Agricultu
- Page 4 and 5: Oregon Agriculture & Fisheries Stat
- Page 6 and 7: Vineyards and wineries overview ...
- Page 8 and 9: Grower Assisted Inspection Program
- Page 10 and 11: 2011-2012 Oregon Agriculture & Fish
- Page 12 and 13: Table 1 - Crop production summary,
- Page 14 and 15: Exports: Top Estimated destinations
- Page 16 and 17: Per capita consumption, table 7 Tab
- Page 18 and 19: Hired workers by region, table 8 Ta
- Page 20 and 21: Crop production rankings, table 10
- Page 22 and 23: Table 12 - Oregon historical highli
- Page 24 and 25: Table 14 - Cash receipts: Farm mark
- Page 26 and 27: Prices paid by farmers, table 16 Ta
- Page 28 and 29: Horticulture and specialty products
- Page 30 and 31: Floriculture: Flats, Floriculture:
- Page 32 and 33: Hay production was high in 2011 whi
- Page 36 and 37: Table 27 - Spring wheat, all practi
- Page 38 and 39: Barley: By county, table 29 Table 2
- Page 40 and 41: Table 31 - Hay: Acreage, yield, and
- Page 42 and 43: Table 33 - Alfalfa hay: Acreage, yi
- Page 44 and 45: Table 35 - All potatoes: Acreage, y
- Page 46 and 47: Table 37 - Potatoes: Stocks, Oregon
- Page 48 and 49: Alfalfa, clover, and grass Peppermi
- Page 50 and 51: Fruit and nut crops production, tab
- Page 52 and 53: Million pounds 200 180 160 140 120
- Page 54 and 55: Tons 50,000 45,000 40,000 35,000 30
- Page 56 and 57: Oregon wine grape production rose 3
- Page 58 and 59: Overall 2011 berry production incre
- Page 60 and 61: Berry crops: By county, table 60 Ta
- Page 62 and 63: Table 61 - Strawberries: Acreage, y
- Page 64 and 65: Table 62 - Vegetable crops: Acreage
- Page 66 and 67: Table 65 - Snap beans for processin
- Page 68 and 69: Table 67 - Cold storage holdings: S
- Page 70 and 71: Fertilizer: Material sold or distri
- Page 72 and 73: Table 69 - Value of production: Liv
- Page 74 and 75: Table 72 - Cattle and calves: Inven
- Page 76 and 77: Million pounds 2,500 2,000 1,500 1,
- Page 78 and 79: 1,000 head 30 25 20 15 10 - 5 Hogs:
- Page 80 and 81: Table 84 - All sheep: Inventory, va
- Page 82 and 83: Sheep and lambs: Goats: Inventory,
- Page 84 and 85:
Honey, Mink, table 94 95 Table 94 -
- Page 86 and 87:
Commercial food fish: Historical, t
- Page 88:
ALABAMA 4121 Carmichael Rd. Sterlin
- Page 91 and 92:
Regulations Photograph by Jessica H
- Page 93 and 94:
Regulations—employment Employing
- Page 95 and 96:
Regulations—employment Employment
- Page 97 and 98:
Regulations—employment Family and
- Page 99 and 100:
Regulations—employment Minimum wa
- Page 101 and 102:
Regulations—employment Recruiting
- Page 103 and 104:
Regulations—employment Social Sec
- Page 105 and 106:
Regulations—employment Workers’
- Page 107 and 108:
Regulations—business Bird, predat
- Page 109 and 110:
Regulations—business Energy and a
- Page 111 and 112:
Regulations—business Exclusive fa
- Page 113 and 114:
Regulations—business Farm scales
- Page 115 and 116:
Regulations—business Fertilizers
- Page 117 and 118:
Regulations—business Grants and f
- Page 119 and 120:
Regulations—business Oregon Centu
- Page 121 and 122:
Regulations—business Oregon’s r
- Page 123 and 124:
Regulations—business Specialty Cr
- Page 125 and 126:
Regulations—livestock Caged Layin
- Page 127 and 128:
Regulations—livestock Confined An
- Page 129 and 130:
Regulations—livestock Importation
- Page 131 and 132:
Regulations—livestock Interstate
- Page 133 and 134:
Regulations—marketing Dairy produ
- Page 135 and 136:
Regulations—marketing Field inspe
- Page 137 and 138:
Regulations—marketing Good Agricu
- Page 139 and 140:
Regulations—marketing Organic Cos
- Page 141 and 142:
Regulations—marketing Weed-Free F
- Page 143 and 144:
Regulations—plants Imported firew
- Page 145 and 146:
Regulations—plants Protected nati
- Page 147 and 148:
Regulations—taxes Income tax with
- Page 149 and 150:
Regulations—taxes Self-employment
- Page 151 and 152:
Regulations—taxes Unemployment ta
- Page 153 and 154:
Regulations—Waste Composting wast
- Page 155 and 156:
Regulations—Waste Federal hazardo
- Page 157 and 158:
Regulations—Waste Pesticide use,
- Page 159 and 160:
Regulations—Waste Waste tire usag
- Page 161 and 162:
Regulations—Water Fish passage at
- Page 163 and 164:
Regulations—Water Groundwater $75
- Page 165 and 166:
Regulations—Water Water rights wh
- Page 167 and 168:
Regulations—Worker safety Agricul
- Page 169 and 170:
Regulations—Worker safety Field s
- Page 171 and 172:
Regulations—Worker safety Worker
- Page 173 and 174:
Regulations—Worker safety Worker
- Page 175 and 176:
Regulations—Worker safety Worker
- Page 177 and 178:
Regulations—Worker safety Worker
- Page 179 and 180:
Directory 170 2012 Agripedia Photog
- Page 181 and 182:
Directory—Ag organizations Americ
- Page 183 and 184:
Directory—Ag organizations Farm B
- Page 185 and 186:
Directory—Ag organizations Klamat
- Page 187 and 188:
Directory—Ag organizations Oregon
- Page 189 and 190:
Directory—Ag organizations Oregon
- Page 191 and 192:
Directory—Ag organizations Oregon
- Page 193 and 194:
Directory—Ag organizations Wallow
- Page 195 and 196:
Directory—Federal government Agri
- Page 197 and 198:
Directory—Federal government Labo
- Page 199 and 200:
Directory—State government Agricu
- Page 201 and 202:
Directory—State government Energy
- Page 203 and 204:
Directory—State government Occupa
- Page 205 and 206:
Directory—State government Oregon
- Page 207 and 208:
Directory—State government Soil &
- Page 210 and 211:
4-H Operating or riding on machiner
- Page 212 and 213:
Climate Environmental and Energy St
- Page 214 and 215:
FFA Organization National .........
- Page 216 and 217:
Material Safety Data Sheets Oregon
- Page 218 and 219:
Oregon Thoroughbred Owners & Breede
- Page 220 and 221:
Tree fruit Home Orchard Society ...