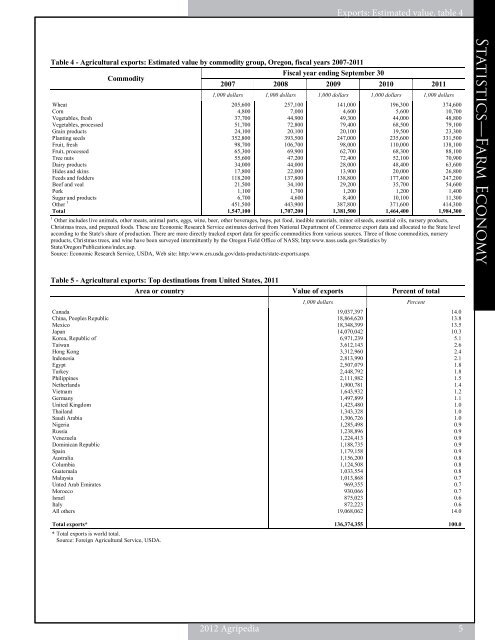
Exports: Top Estimated destinations, value, table 54 Table 4 - Agricultural exports: Estimated value by commodity group, <strong>Oregon</strong>, fiscal years 2007-2011 Commodity 2007 Fiscal year ending September 30 2008 2009 2010 2011 Wheat Corn Vegetables, fresh Vegetables, processed Grain products Planting seeds Fruit, fresh Fruit, processed Tree nuts Dairy products Hides and skins Feeds and fodders Beef and veal Pork Sugar and products Other 1 Total 1,000 dollars 1,000 dollars 1,000 dollars 1,000 dollars 1,000 dollars 205,600 4,800 37,700 51,700 24,100 352,800 98,700 65,300 55,600 34,000 17,800 118,200 21,500 1,100 6,700 451,500 1,547,100 257,100 7,000 44,900 72,800 20,100 393,500 106,700 69,900 47,200 44,000 22,000 137,800 34,100 1,700 4,600 443,900 1,707,200 141,000 4,600 49,300 79,400 20,100 247,000 98,000 62,700 72,400 28,000 13,900 138,800 29,200 1,200 8,400 387,800 1,381,500 196,300 5,600 44,000 68,500 19,500 235,600 110,000 68,300 52,100 48,400 20,000 177,400 35,700 1,200 10,100 371,600 1,464,400 374,600 10,700 48,800 79,100 23,300 331,500 138,100 88,100 70,900 63,600 26,800 247,200 54,600 1,400 11,300 414,300 1,984,300 1 Other includes live animals, other meats, animal parts, eggs, wine, beer, other beverages, hops, pet food, inedible materials, minor oilseeds, essential oils, nursery products, Christmas trees, and prepared foods. These are Economic Research Service estimates derived from National Department of Commerce export data and allocated to the <strong>State</strong> level according to the <strong>State</strong>'s share of production. There are more directly tracked export data for specific commodities from various sources. Three of those commodities, nursery products, Christmas trees, and wine have been surveyed intermittently by the <strong>Oregon</strong> Field Office of NASS; http:www.nass.usda.gov/Statistics by <strong>State</strong>/<strong>Oregon</strong>/Publications/index.asp. Source: Economic Research Service, USDA, Web site: http:/www.ers.usda.gov/data-products/state-exports.aspx Table 5 - Agricultural exports: Top destinations from United <strong>State</strong>s, 2011 Area or country Value of exports Percent of total Canada China, Peoples Republic Mexico Japan Korea, Republic of Taiwan Hong Kong Indonesia Egypt Turkey Philippines Netherlands Vietnam Germany United Kingdom Thailand Saudi Arabia Nigeria Russia Venezuela Dominican Republic Spain Australia Columbia Guatemala Malaysia Unted Arab Emirates Morocco Israel Italy All others Total exports* * Total exports is world total. Source: Foreign Agricultural Service, USDA. 1,000 dollars Percent 19,037,397 18,864,620 18,348,399 14,070,042 6,971,239 3,612,143 3,312,960 2,813,990 2,507,079 2,448,792 2,111,982 1,900,781 1,643,932 1,497,899 1,423,480 1,343,328 1,306,726 1,285,498 1,238,896 1,224,413 1,188,735 1,179,158 1,156,200 1,124,508 1,033,554 1,013,868 969,355 930,066 875,023 872,223 19,068,062 136,374,355 14.0 13.8 13.5 10.3 5.1 2.6 2.4 2.1 1.8 1.8 1.5 1.4 1.2 1.1 1.0 1.0 1.0 0.9 0.9 0.9 0.9 0.9 0.8 0.8 0.8 0.7 0.7 0.7 0.6 0.6 14.0 <strong>2012</strong> Agripedia 5 100.0 Regulations—Farm Statistics—Farm Economy
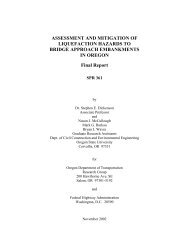
Regulations—Farm Statistics—Farm Economy World supply and utilization, table 6 Table 6 - World supply and utilization: Major crops, livestock and products, 2006-2013 Item/unit 2006-2007 2007-2008 2008-2009 2009-2010 2010-2011 2011-<strong>2012</strong> <strong>2012</strong>-2013 F Wheat Area (hectares) Production (metric tons) Exports 1 (metric tons) Consumption 2 (metric tons) Ending stocks 3 (metric tons) Coarse grains Area (hectares) Production (metric tons) Exports 1 (metric tons) Consumption 2 (metric tons) Ending stocks 3 (metric tons) Rice, milled Area (hectares) Production (metric tons) Exports 1 (metric tons) Consumption 2 (metric tons) Ending stocks 3 (metric tons) Total grains Area (hectares) Production (metric tons) Exports 1 (metric tons) Consumption 2 (metric tons) Ending stocks 3 (metric tons) Oilseeds Crush (metric tons) Production (metric tons) Exports (metric tons) Ending stocks (metric tons) Meals Production (metric tons) Exports (metric tons) Oils Production (metric tons) Exports (metric tons) Cotton Area (hectares) Production (bales) Exports (bales) Consumption (bales) Ending stocks (bales) Beef and pork 4 Production (metric tons) Consumption (metric tons) Exports 1 (metric tons) Broilers and turkeys 4 Production (metric tons) Consumption (metric tons) Exports 1 (metric tons) Dairy Milk production (metric tons) Million units Million units Million units Million units Million units Million units Million units 212.2 596.1 111.9 618.0 133.9 304.1 988.7 149.5 1,008.8 141.3 154.5 419.9 31.4 418.2 75.4 670.8 2,004.7 292.8 2,044.9 350.6 314.1 403.8 83.1 73.2 224.0 69.0 121.8 49.2 34.5 122.2 37.6 121.6 63.0 217.1 611.9 117.3 613.9 128.2 316.1 1,080.8 159.3 1,057.1 164.4 155.1 432.9 31.5 425.9 80.8 688.3 2,125.6 308.1 2,096.8 373.4 324.3 390.7 91.5 61.6 231.5 72.2 128.7 53.8 32.8 119.6 39.1 120.9 62.0 224.6 682.8 144.5 636.5 167.8 312.3 1,112.8 145.8 1,079.7 195.1 158.2 448.7 29.0 435.5 92.4 695.1 2,244.2 319.3 2,151.7 455.3 323.2 396.7 94.2 56.3 228.9 69.4 133.8 56.2 30.6 107.3 30.4 106.9 62.5 6 <strong>2012</strong> Agripedia 225.8 686.2 137.2 650.0 200.6 306.1 1,112.6 151.3 1,103.1 197.3 156.1 441.3 31.1 435.6 95.2 688.1 2,240.1 319.6 2,188.7 493.0 344.2 445.0 108.3 73.3 244.0 72.1 140.8 57.9 30.2 102.2 35.6 117.7 47.8 218.2 651.9 132.4 653.7 198.0 303.1 1,097.9 151.4 1,129.6 165.2 157.7 449.4 34.8 443.8 98.6 679.1 2,199.2 318.7 2,227.1 461.7 361.4 456.7 109.2 81.4 257.0 77.4 147.5 60.0 33.3 116.4 36.7 114.0 49.5 221.7 695.2 153.9 688.1 197.6 311.1 1,149.0 161.7 1,137.3 168.5 158.9 465.0 35.5 456.6 105.0 691.8 2,309.2 351.1 2,282.0 471.1 373.0 436.4 108.8 61.2 264.6 79.1 153.5 62.9 35.8 122.7 44.3 104.4 67.8 2006 2007 2008 2009 2010 2011 P <strong>2012</strong> F Million units Million units Million units Million units Million units Million units Million units 153.0 151.9 12.9 70.5 70.3 7.1 427.9 152.5 151.8 12.9 74.6 74.3 8.0 436.7 F=forecast, P=preliminary. 1 Excludes intra-European Union trade but includes intra-former Soviet Union trade. 2 Where stocks data are not available, consumption includes stock changes. 3 Stocks data are based on differing marketing years and do not represent levels at a given date. Data not available for all countries. 4 Calendar year data, selected countries. <strong>Information</strong> contacts: Kenneth Mathews for red meat and poultry (202) 694-5183; Roger Hoskins for dairy (202) 694-5148. Source: Economic Research Service, USDA. Web site: ers.usda.gov. 156.2 155.6 13.8 78.2 77.3 9.1 435.4 157.7 156.8 13.2 78.6 78.0 8.8 435.1 160.0 158.9 13.9 82.9 81.8 9.4 442.0 158.6 157.0 15.1 85.7 84.6 10.0 452.5 218.8 662.8 135.2 683.7 177.2 317.7 1,121.4 149.2 1,132.3 152.1 158.8 463.2 35.9 464.0 101.8 695.4 2,247.5 320.3 2,280.0 431.1 374.2 457.3 112.1 60.7 265.1 79.7 155.3 64.8 33.4 114.1 37.2 107.2 74.7 161.4 159.4 15.7 87.5 86.4 10.2 464.1
- Page 2 and 3: OregOn Agriculture Oregon Agricultu
- Page 4 and 5: Oregon Agriculture & Fisheries Stat
- Page 6 and 7: Vineyards and wineries overview ...
- Page 8 and 9: Grower Assisted Inspection Program
- Page 10 and 11: 2011-2012 Oregon Agriculture & Fish
- Page 12 and 13: Table 1 - Crop production summary,
- Page 16 and 17: Per capita consumption, table 7 Tab
- Page 18 and 19: Hired workers by region, table 8 Ta
- Page 20 and 21: Crop production rankings, table 10
- Page 22 and 23: Table 12 - Oregon historical highli
- Page 24 and 25: Table 14 - Cash receipts: Farm mark
- Page 26 and 27: Prices paid by farmers, table 16 Ta
- Page 28 and 29: Horticulture and specialty products
- Page 30 and 31: Floriculture: Flats, Floriculture:
- Page 32 and 33: Hay production was high in 2011 whi
- Page 34 and 35: Table 25 - All wheat: Acreage, yiel
- Page 36 and 37: Table 27 - Spring wheat, all practi
- Page 38 and 39: Barley: By county, table 29 Table 2
- Page 40 and 41: Table 31 - Hay: Acreage, yield, and
- Page 42 and 43: Table 33 - Alfalfa hay: Acreage, yi
- Page 44 and 45: Table 35 - All potatoes: Acreage, y
- Page 46 and 47: Table 37 - Potatoes: Stocks, Oregon
- Page 48 and 49: Alfalfa, clover, and grass Peppermi
- Page 50 and 51: Fruit and nut crops production, tab
- Page 52 and 53: Million pounds 200 180 160 140 120
- Page 54 and 55: Tons 50,000 45,000 40,000 35,000 30
- Page 56 and 57: Oregon wine grape production rose 3
- Page 58 and 59: Overall 2011 berry production incre
- Page 60 and 61: Berry crops: By county, table 60 Ta
- Page 62 and 63: Table 61 - Strawberries: Acreage, y
- Page 64 and 65:
Table 62 - Vegetable crops: Acreage
- Page 66 and 67:
Table 65 - Snap beans for processin
- Page 68 and 69:
Table 67 - Cold storage holdings: S
- Page 70 and 71:
Fertilizer: Material sold or distri
- Page 72 and 73:
Table 69 - Value of production: Liv
- Page 74 and 75:
Table 72 - Cattle and calves: Inven
- Page 76 and 77:
Million pounds 2,500 2,000 1,500 1,
- Page 78 and 79:
1,000 head 30 25 20 15 10 - 5 Hogs:
- Page 80 and 81:
Table 84 - All sheep: Inventory, va
- Page 82 and 83:
Sheep and lambs: Goats: Inventory,
- Page 84 and 85:
Honey, Mink, table 94 95 Table 94 -
- Page 86 and 87:
Commercial food fish: Historical, t
- Page 88:
ALABAMA 4121 Carmichael Rd. Sterlin
- Page 91 and 92:
Regulations Photograph by Jessica H
- Page 93 and 94:
Regulations—employment Employing
- Page 95 and 96:
Regulations—employment Employment
- Page 97 and 98:
Regulations—employment Family and
- Page 99 and 100:
Regulations—employment Minimum wa
- Page 101 and 102:
Regulations—employment Recruiting
- Page 103 and 104:
Regulations—employment Social Sec
- Page 105 and 106:
Regulations—employment Workers’
- Page 107 and 108:
Regulations—business Bird, predat
- Page 109 and 110:
Regulations—business Energy and a
- Page 111 and 112:
Regulations—business Exclusive fa
- Page 113 and 114:
Regulations—business Farm scales
- Page 115 and 116:
Regulations—business Fertilizers
- Page 117 and 118:
Regulations—business Grants and f
- Page 119 and 120:
Regulations—business Oregon Centu
- Page 121 and 122:
Regulations—business Oregon’s r
- Page 123 and 124:
Regulations—business Specialty Cr
- Page 125 and 126:
Regulations—livestock Caged Layin
- Page 127 and 128:
Regulations—livestock Confined An
- Page 129 and 130:
Regulations—livestock Importation
- Page 131 and 132:
Regulations—livestock Interstate
- Page 133 and 134:
Regulations—marketing Dairy produ
- Page 135 and 136:
Regulations—marketing Field inspe
- Page 137 and 138:
Regulations—marketing Good Agricu
- Page 139 and 140:
Regulations—marketing Organic Cos
- Page 141 and 142:
Regulations—marketing Weed-Free F
- Page 143 and 144:
Regulations—plants Imported firew
- Page 145 and 146:
Regulations—plants Protected nati
- Page 147 and 148:
Regulations—taxes Income tax with
- Page 149 and 150:
Regulations—taxes Self-employment
- Page 151 and 152:
Regulations—taxes Unemployment ta
- Page 153 and 154:
Regulations—Waste Composting wast
- Page 155 and 156:
Regulations—Waste Federal hazardo
- Page 157 and 158:
Regulations—Waste Pesticide use,
- Page 159 and 160:
Regulations—Waste Waste tire usag
- Page 161 and 162:
Regulations—Water Fish passage at
- Page 163 and 164:
Regulations—Water Groundwater $75
- Page 165 and 166:
Regulations—Water Water rights wh
- Page 167 and 168:
Regulations—Worker safety Agricul
- Page 169 and 170:
Regulations—Worker safety Field s
- Page 171 and 172:
Regulations—Worker safety Worker
- Page 173 and 174:
Regulations—Worker safety Worker
- Page 175 and 176:
Regulations—Worker safety Worker
- Page 177 and 178:
Regulations—Worker safety Worker
- Page 179 and 180:
Directory 170 2012 Agripedia Photog
- Page 181 and 182:
Directory—Ag organizations Americ
- Page 183 and 184:
Directory—Ag organizations Farm B
- Page 185 and 186:
Directory—Ag organizations Klamat
- Page 187 and 188:
Directory—Ag organizations Oregon
- Page 189 and 190:
Directory—Ag organizations Oregon
- Page 191 and 192:
Directory—Ag organizations Oregon
- Page 193 and 194:
Directory—Ag organizations Wallow
- Page 195 and 196:
Directory—Federal government Agri
- Page 197 and 198:
Directory—Federal government Labo
- Page 199 and 200:
Directory—State government Agricu
- Page 201 and 202:
Directory—State government Energy
- Page 203 and 204:
Directory—State government Occupa
- Page 205 and 206:
Directory—State government Oregon
- Page 207 and 208:
Directory—State government Soil &
- Page 210 and 211:
4-H Operating or riding on machiner
- Page 212 and 213:
Climate Environmental and Energy St
- Page 214 and 215:
FFA Organization National .........
- Page 216 and 217:
Material Safety Data Sheets Oregon
- Page 218 and 219:
Oregon Thoroughbred Owners & Breede
- Page 220 and 221:
Tree fruit Home Orchard Society ...