2012 - Oregon State Library: State Employee Information Center
2012 - Oregon State Library: State Employee Information Center
2012 - Oregon State Library: State Employee Information Center

You also want an ePaper? Increase the reach of your titles
YUMPU automatically turns print PDFs into web optimized ePapers that Google loves.
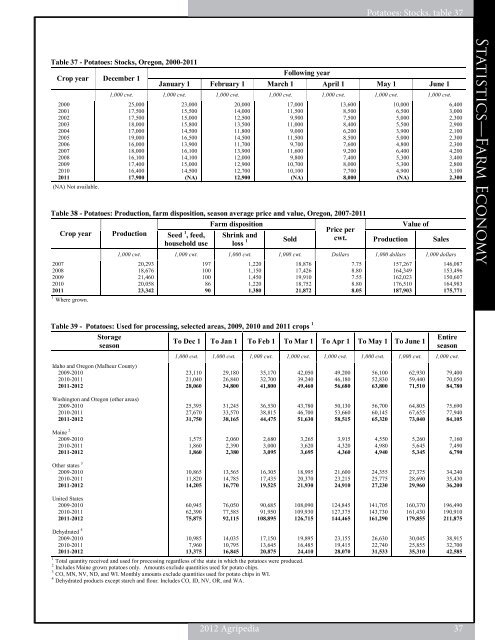
Table 37 - Potatoes: Stocks, <strong>Oregon</strong>, 2000-2011<br />
Crop year December 1<br />
2000<br />
2001<br />
2002<br />
2003<br />
2004<br />
2005<br />
2006<br />
2007<br />
2008<br />
2009<br />
2010<br />
2011<br />
(NA) Not available.<br />
Following year<br />
Potatoes: Potatoes: Processing, Stocks, table 39 37<br />
January 1 February 1 March 1 April 1 May 1 June 1<br />
1,000 cwt. 1,000 cwt. 1,000 cwt. 1,000 cwt. 1,000 cwt. 1,000 cwt. 1,000 cwt.<br />
25,000<br />
17,500<br />
17,500<br />
18,000<br />
17,000<br />
19,000<br />
16,000<br />
18,000<br />
16,100<br />
17,400<br />
16,400<br />
17,900<br />
23,000<br />
15,500<br />
15,000<br />
15,800<br />
14,500<br />
16,500<br />
13,900<br />
16,100<br />
14,100<br />
15,000<br />
14,500<br />
(NA)<br />
20,000<br />
14,000<br />
12,500<br />
13,500<br />
11,800<br />
14,500<br />
11,700<br />
13,900<br />
12,000<br />
12,900<br />
12,700<br />
12,900<br />
Table 38 - Potatoes: Production, farm disposition, season average price and value, <strong>Oregon</strong>, 2007-2011<br />
Crop year Production<br />
Farm disposition<br />
Seed<br />
Price per<br />
cwt.<br />
Value of<br />
1 , feed, Shrink and<br />
household use loss 1 Sold Production Sales<br />
2007<br />
2008<br />
2009<br />
2010<br />
2011<br />
1<br />
Where grown.<br />
17,000<br />
11,500<br />
9,900<br />
11,000<br />
9,000<br />
11,500<br />
9,700<br />
11,600<br />
9,800<br />
10,700<br />
10,100<br />
(NA)<br />
13,600<br />
8,500<br />
7,500<br />
8,400<br />
6,200<br />
8,500<br />
7,600<br />
9,200<br />
7,400<br />
8,000<br />
7,700<br />
8,000<br />
10,000<br />
6,500<br />
5,000<br />
5,500<br />
3,900<br />
5,000<br />
4,800<br />
6,400<br />
5,300<br />
5,300<br />
4,900<br />
(NA)<br />
1,000 cwt. 1,000 cwt. 1,000 cwt. 1,000 cwt. Dollars 1,000 dollars 1,000 dollars<br />
20,293<br />
18,676<br />
21,460<br />
20,058<br />
23,342<br />
197<br />
100<br />
100<br />
86<br />
90<br />
1,220<br />
1,150<br />
1,450<br />
1,220<br />
1,380<br />
18,876<br />
17,426<br />
19,910<br />
18,752<br />
21,872<br />
7.75<br />
8.80<br />
7.55<br />
8.80<br />
8.05<br />
157,267<br />
164,349<br />
162,023<br />
176,510<br />
187,903<br />
Table 39 - Potatoes: Used for processing, selected areas, 2009, 2010 and 2011 crops 1<br />
Storage<br />
season<br />
To Dec 1 To Jan 1 To Feb 1 To Mar 1 To Apr 1 To May 1 To June 1<br />
Idaho and <strong>Oregon</strong> (Malheur County)<br />
2009-2010<br />
2010-2011<br />
2011-<strong>2012</strong><br />
Washington and <strong>Oregon</strong> (other areas)<br />
2009-2010<br />
2010-2011<br />
2011-<strong>2012</strong><br />
Maine 2<br />
2009-2010<br />
2010-2011<br />
2011-<strong>2012</strong><br />
Other states 3<br />
2009-2010<br />
2010-2011<br />
2011-<strong>2012</strong><br />
United <strong>State</strong>s<br />
2009-2010<br />
2010-2011<br />
2011-<strong>2012</strong><br />
Dehydrated 4<br />
2009-2010<br />
2010-2011<br />
2011-<strong>2012</strong><br />
6,400<br />
3,000<br />
2,300<br />
2,900<br />
2,100<br />
2,300<br />
2,300<br />
4,200<br />
3,400<br />
2,800<br />
3,100<br />
2,300<br />
146,087<br />
153,496<br />
150,607<br />
164,983<br />
175,771<br />
Entire<br />
season<br />
1,000 cwt. 1,000 cwt. 1,000 cwt. 1,000 cwt. 1,000 cwt. 1,000 cwt. 1,000 cwt. 1,000 cwt.<br />
23,110<br />
21,040<br />
28,060<br />
25,395<br />
27,670<br />
31,750<br />
1,575<br />
1,860<br />
1,860<br />
10,865<br />
11,820<br />
14,205<br />
60,945<br />
62,390<br />
75,875<br />
10,985<br />
7,960<br />
13,375<br />
29,180<br />
26,840<br />
34,800<br />
31,245<br />
33,570<br />
38,165<br />
2,060<br />
2,390<br />
2,380<br />
13,565<br />
14,785<br />
16,770<br />
76,050<br />
77,585<br />
92,115<br />
14,035<br />
10,795<br />
16,845<br />
35,170<br />
32,700<br />
41,800<br />
36,530<br />
38,815<br />
44,475<br />
2,680<br />
3,000<br />
3,095<br />
16,305<br />
17,435<br />
19,525<br />
90,685<br />
91,950<br />
108,895<br />
17,150<br />
13,645<br />
20,875<br />
1 Total quantity received and used for processing regardless of the state in which the potatoes were produced.<br />
2 Includes Maine grown potatoes only. Amounts exclude quantities used for potato chips.<br />
3 CO, MN, NV, ND, and WI. Monthly amounts exclude quantities used for potato chips in WI.<br />
4 Dehydrated products except starch and flour. Includes CO, ID, NV, OR, and WA.<br />
42,050<br />
39,240<br />
49,460<br />
43,780<br />
46,700<br />
51,630<br />
3,265<br />
3,620<br />
3,695<br />
18,995<br />
20,370<br />
21,930<br />
108,090<br />
109,930<br />
126,715<br />
19,895<br />
16,485<br />
24,410<br />
49,200<br />
46,180<br />
56,680<br />
50,130<br />
53,660<br />
58,515<br />
3,915<br />
4,320<br />
4,360<br />
21,600<br />
23,215<br />
24,910<br />
124,845<br />
127,375<br />
144,465<br />
23,155<br />
19,415<br />
28,070<br />
56,100<br />
52,830<br />
63,800<br />
56,700<br />
60,145<br />
65,320<br />
4,550<br />
4,980<br />
4,940<br />
24,355<br />
25,775<br />
27,230<br />
141,705<br />
143,730<br />
161,290<br />
26,630<br />
22,740<br />
31,533<br />
62,930<br />
59,440<br />
71,510<br />
64,805<br />
67,655<br />
73,040<br />
5,260<br />
5,645<br />
5,345<br />
27,375<br />
28,690<br />
29,960<br />
160,370<br />
161,430<br />
179,855<br />
30,045<br />
25,855<br />
35,310<br />
79,400<br />
70,050<br />
84,780<br />
75,690<br />
77,940<br />
84,105<br />
7,160<br />
7,490<br />
6,790<br />
34,240<br />
35,430<br />
36,200<br />
196,490<br />
190,910<br />
211,875<br />
38,915<br />
32,700<br />
42,585<br />
<strong>2012</strong> Agripedia 37<br />
Regulations—Farm Statistics—Farm Economy